Abstract
Creatine Kinase (CK) is essential for buffering and rapid regeneration of adenosine triphosphate (ATP) in heart tissue. Herein we demonstrate a 31P magnetic resonance spectroscopy (MRS) protocol to quantify CK reaction kinetics in human myocardium at 3T. Furthermore we sought to quantify the test–retest reliability of the measured metabolic parameters. The method localizes 31P signal from heart using modified 1D image selected in vivo spectroscopy (ISIS) and a time dependent saturation transfer (TDST) approach was used to measure CK reaction parameters. Fifteen healthy volunteers (22 measurements total) were tested. The CK reaction rate constant (kf) was 0.32 ± 0.05 sec−1 and coefficient of variation (CV) = 15.62%. Intrinsic T1 for phosphocreatine (PCr) was 7.36 ± 1.79 sec with CV = 24.32%. These values are consistent those previously reported. PCr/ATP ratio was equal to 1.94 ± 0.15 with CV = 7.73%, which is within the range of healthy subjects. The reproducibility of the technique was tested in 7 subjects and inferred parameters such as kf and T1 exhibited good reliability (intraclass correlation coefficient (ICC) = 0.90 and 0.79 for kf and T1 respectively). The reproducibility data provided in this study will enable calculation of power and sample sizes required for clinical and research studies. The technique will allow for the examination of cardiac energy metabolism in clinical and research studies providing insight in the relationship between energy deficit and functional deficiency in heart.
Keywords: Heart, Saturation Transfer, 31P-MRS, Creatine Kinase, ATP, ISIS, TDST, Reproducibility
INTRODUCTION
Heart uses chemical energy in the form of ATP for its systolic and diastolic functions. The amount of ATP stored in the heart is small therefore there is a constant need for ATP synthesis and transport for normal cardiac function. CK shuttle plays an important role in this regard and reversibly converts adenosine diphosphate (ADP) and PCr to ATP and Creatine (Cr):
| [1] |
It functions as an energy reserve and transport mechanism, ensuring that there is an abundant and immediate ATP supply for contractile work (1). Changes in the CK system are seen in heart failure indicative of impaired delivery of ATP to energy consuming systems (2,3) and these changes have been linked with cardiac performance and heart dysfunction (4,5). CK is one of the first enzymes affected in a pathologic myocardium as evidenced by decrease in total CK activity and a shift in the expression of its isoenzymes in hypoxia, coronary occlusion, hypertensive hypertrophy (6–8). Isolated heart studies have shown the CK reaction rate constant is closely coupled to the rate of ATP production (9) while other studies have demonstrated that CK forward reaction rate constant correlates with brain activity (10,11). These findings support the pursuit of reliable and clinically feasible techniques to measure cardiac CK reaction kinetics.
The CK reaction rate can be measured noninvasively by the saturation transfer (ST) MRS technique and flux through the reaction is determined using the steady-state PCr levels (12). This has been extensively studied in animal heart using either isolated perfused hearts or open chest experiments with the MRS coil directly over the hearts of otherwise intact animals (9,13–16). Feasibility of measuring CK reaction kinetics in human hearts within clinically feasible time was first demonstrated at 1.5T magnet using four angle saturation transfer approach. CK flux was reduced in patients with left ventricle (LV) hypertrophy and cardiac heart failure (CHF), and the severity of the reduction in CK rate constant was correlated with the severity of LV dysfunction (17,18). Recently a triple repetition time saturation transfer (TRiST) method with 1D chemical shift imaging (CSI) localization was developed at 3T magnet to take advantages of high SNR and spectral resolution (19). In this study only two repetition times were used to calculate CK reaction kinetic parameters and a 3rd acquisition was used to determine basal levels of PCr concentration ([PCr]). Low signal to noise (SNR) ratio of 31P experiments and imperfections in the excitation flip angles can make these measurements prone to errors. Furthermore CSI is highly susceptible to cross voxel signal contamination and could potentially compromise the accuracy of measurements (20). In addition the test-retest reliability of the parameters of the CK kinetics has never been experimentally tested.
The purpose of this work was to implement TDST technique at 3T for measuring CK reaction kinetics in human heart and to assess the test-retest reproducibility of the technique. In order to achieve these goals we used a signal localization approach which allows maximum coverage of the heart thus improving SNR. First the experimental parameters, such as RF pulses and localization efficiency were tested in phantoms. Then the technique was implemented in a group of healthy volunteers and the repeatability of the technique was tested in a subset of subjects.
THEORY
Detailed theory about NMR saturation transfer can be found in several excellent reviews (21–23). Briefly, a low power saturation pulse is applied to the γ-ATP resonance and transfer of magnetic label to PCr is measured. The longitudinal magnetization of PCr when γ-ATP peak is saturated is given by:
| [2] |
where T1 is the intrinsic relaxation time constant of PCr in absence of exchange, kf is the forward (PCr → ATP) chemical reaction rate constant of the CK reaction, and and MPCr(t) are the fully relaxed and time dependent magnetization of the PCr resonance. The solution to the modified Bloch equation is given by
| [3] |
where is the apparent relaxation rate constant. A series of spectra with different saturation times (Tsat)is acquired and τ is determined using equation 3. The CK reaction rate constant can then be determined using the following equation:
| [4] |
where is the steady state magnetization with γ-ATP peak saturated and is the PCr intensity measured without any saturation pulse.
A non-ideal situation may occur if the selectivity of the saturation pulse scheme is imperfect which will cause unwanted direct saturation of the PCr peak. To accurately measure kf this direct RF bleed over must be removed from the measurements. First order correction for spill over is generally achieved by replacing with where μ is the loss factor, measured by control spectra obtained by irradiating the spins at the appropriate frequency contralateral to the PCr resonance i.e. at 2.5 ppm (9,23).
MATERIALS AND METHODS
Experiments were done on Siemens 3T magnet equipped with broadband capabilities (Siemens Medical Systems Erlangen) using a home built 10 cm 31P transmit receive RF coil. All human studies were approved by the Institutional Review Board at Washington University in St. Louis, and participants provided written informed consent.
Pulse sequence
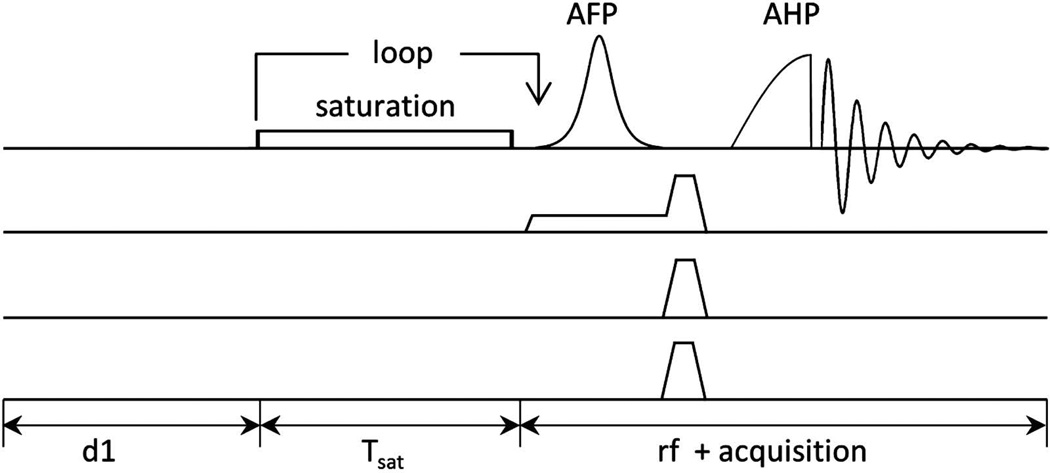
The schematic diagram of the TDST pulse sequence with modified 1D-ISIS localization is shown in figure 1. The one dimensional localization technique consisted of two scans. In the first scan all the spins within the sensitive region of the RF coil were excited with a 90° adiabatic half passage pulse (AHP). During the second acquisition the spin population within a defined region of interest (ROI) was inverted with a B1 insensitive adiabatic full passage pulse (AFP) in presence of linear field gradients. After the spins were spatially encoded, spoiling gradient was applied to dephase any residual transverse component. Addition of the scans would eliminate the signal from the selected ROI whereas difference between the two scans would contain the signal from the ROI.
Figure 1.
(a) Schematic Pulse sequence for time dependent magnetization transfer using 1D-ISIS localization. The selective spectral saturation is achieved by a low power RF pulse centered on the γ-ATP resonance. Saturation times are varied by looping over the saturation pulse with 1 ms gap between the successive pulses. An adiabatic full passage pulse immediately follows the saturation pulse train for ISIS localization. Spoiling gradients are used before excitation to disperse any residual transverse magnetization.
We placed the selected ROI (6 – 8 cm) on the chest and the addition of the two acquisitions was used to eliminate the signal from the chest leaving the signal from the heart. ROI was placed on the chest since it is in the most sensitive region of the surface RF coil and allows the use of short duration AFP pulses at low RF power. The use of adiabatic pulses also neutralizes the effect of coil loading and no RF calibration was needed before in vivo experiments. The localization in the other two planes was achieved by the sensitive region of the surface 31P coil as previously demonstrated (17,18,24).
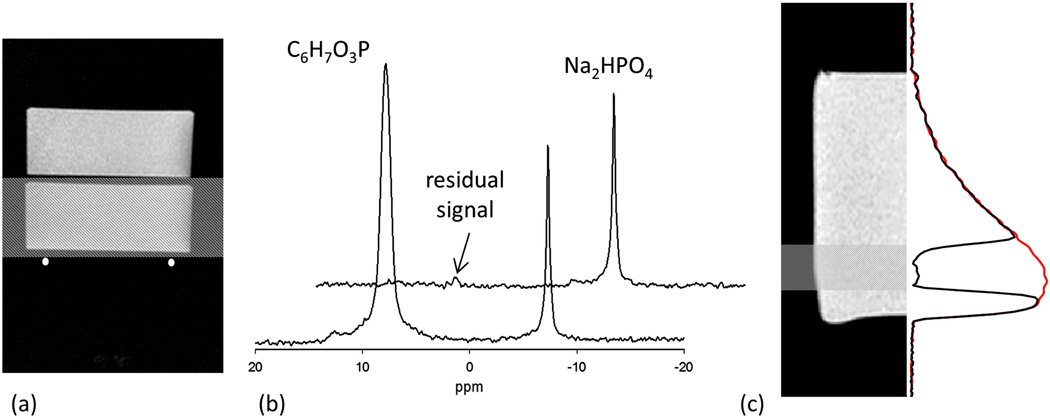
The calibration of AFP pulse was done using a two compartment phantom consisting of 650 ml 4 cm deep plastic disks containing 150 mM phenylphosphonic acid (C6H7O3P) and of 150 mM sodium phosphate (Na2HPO4) solution. Body phantom provided by Siemens was used to ensure that the coil was loaded similar to the in vivo conditions and coil tuning and matching was checked before each experiment. ROI was placed on the phantom closest to the coil mimicking the chest. Area under the peak was used to determine the relative phosphate concentration and unwanted signal contribution determined as a percentage of the total signal was typically < 5% (Fig 2). Signal localization was further tested by acquiring a 1D profile of a phosphate phantom in a plane perpendicular to the surface of the coil, i.e. the signal was detected in the presence of a readout gradient perpendicular to the surface of the coil. The phantom consisted of 8 cm diameter and 10 cm deep flask filled with 150 mM sodium phosphate solution. A 2 cm thick slice was placed approximately 2 cm from the bottom of the phosphate phantom. Other acquisition parameters are as follows: field of view = 40 cm, TR = 2 sec, TE = 1 ms, matrix size = 128 and signal averages = 256. 1D-MR spectrum shows the elimination of signal from the ROI and extent of RF pulse transition bands with no distortion of signal outside the ROI.
Figure 2.
(a) Image of two compartment phantom showing the location of the RF coil. The shaded region represents position of ROI. (b) Front spectrum shows the signal from the phantom without any localization and a large peak from phenylphosphonic acid compartment closer to the RF coil is visible. Spectrum in the back is the result of addition of two spectra with and without the inversion of spins in the selected ROI. The addition of the two spectra shows almost complete suppression of spectral peak from phenylphosphonic acid. (c) The image of the phantom, location of ROI and 1D-spectrum. Red spectrum shows the signal without saturation band and the signal in the selected ROI is eliminated when the saturation band is placed. The decaying profile of spectrum represents the loss of sensitivity of the surface coil with distance from the coil.
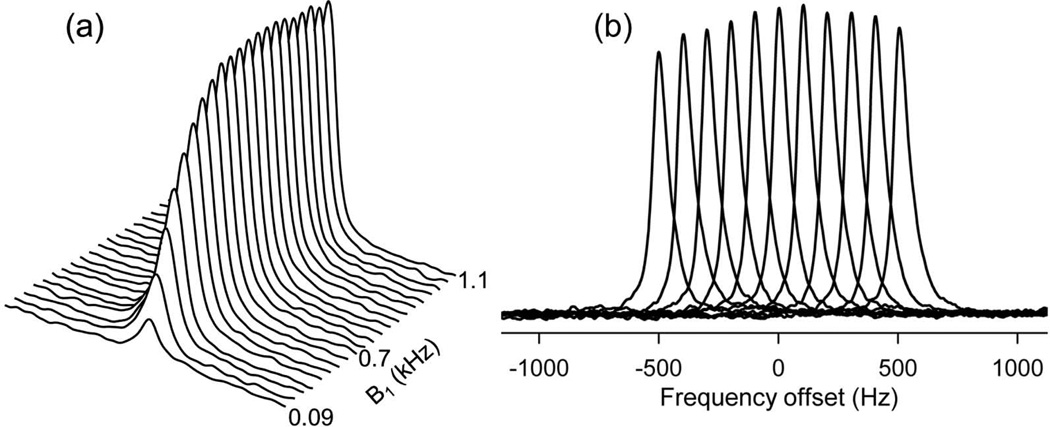
An adiabatic half passage pulse (2.56 ms sin/cos modulated, bandwidth 3000 Hz) was used for excitation. The pulse was designed to provide a uniform 90° excitation at a distance of at least 7 cm from the coil. The B1 field was increased from ~ 0.09 to 1.1 kHz to determine optimal excitation field strength. Optimal field strength of 0.9 kHz was used for all experiments to ensure that the pulse was adiabatic over most of the sensitive region of the coil (Fig 3a). The off-resonance efficiency of the adiabatic excitation pulse was determined by varying the offset frequency from −500 Hz to 500 Hz with an increment of 100 Hz. Excitation efficiency was calculated as the resonance amplitude at a given offset frequency normalized to that of the resonance amplitude at offset = 0. The excitation pulse had adequate bandwidth (~ 400Hz) to fully excite PCr and γ-ATP resonances (~ 120 Hz apart at 3T). The pulse efficiency dropped quickly towards the α- and β-ATP resonances, and these peaks were not included in the analysis (Fig 3b).
Figure 3.
(a) Spectrum demonstrating calibration of AHP pulse. Spectrum amplitude initially increased with B1 field strength and reached a maximum value at B1 = 0.7 kHz. Further increase in B1 did not affect the spectral peak intensity confirming uniform 90° excitation over the region of interest. (b) Plot shows the frequency dependence of AHP pulse. The adiabatic conditions were met in ~400 Hz around the resonance frequency. This bandwidth is appropriate to simultaneously quantify PCr and γ-ATP which are approximately 120 Hz apart at 3T.
Selective γ-ATP peak suppression was achieved by repetitive application of a 100 ms (99 ms on and 1ms off) square pulses which results in narrow suppression bandwidth. The heating caused by the saturation pulses were tested in a saline phantom in a 25 cm wide by 45 cm long and 18 cm deep beaker containing 4.5 g/L of NaCl to match in vivo loading and conductivity properties of the human muscle (εr = 76.4 and σ = 0.7S/m) in accordance with the American College of Radiology (ACR) body phantom recommendation (25). Body phantom was used to ensure proper coil loading. Temperature was recorded using a fiber optic probe at 5 locations with 3 close to the coil and two at ~6 cm above the coil surface. No change in temperature was measured.
Simulations
Saturation transfer studies are typically conducted with long relaxation delay (d1) to allow for complete relaxation of the spins which makes the scanning time prohibitive for in vivo studies. For a 90° excitation the maximum SNR per unit time is achieved when where (~ 5 sec) is the apparent relaxation time constant of PCr in presence of chemical exchange (17,24,26). Monte Carlo simulations were done to estimate the effect of SNR on the calculation of CK reaction kinetic parameters under partial saturation. The parameters to generate the simulated data correspond to signal acquired from in vivo heart spectrum and consisted of 512 complex data points. A Gaussian noise with a zero mean value and a variance σ was added (on both the real and imaginary parts). We synthesized 31P signals with SNR = 10, 15, 20, 30, 40, and 50, where SNR was defined as the area under the PCr peak over noise. A set of 25 FIDs were simulated for each SNR. We also used the following simulation parameters kf = 0.3 sec−1, T1 = sec.
Studies in Leg
Calf-muscle studies (n = 2) were used to test whether the TDST measurements with short d1 yield that same values of the CK reaction kinetics as the conventional fully relaxed saturation transfer method. Saturation transfer data sets were acquired with 20 sec and 6 sec relaxation time. Other acquisition parameters were: Tsat = 0.2, 0.4, 0.7, 1.3, 2.5, 4, and 6 sec, receiver band width = 3000 Hz and 512 acquisition points were acquired.
Studies in heart
15 volunteers (13 male 2 female) (mean age ± SD = 40.87 ± 13.67 years) participated in this study (Table 1). 31P surface coil was positioned on the chest with the center of the coil just below the mitral valve of the heart using proton scout images. A small fiducial placed at the center of the RF coil was used as a marker to adjust the positioning of the coil relative to the heart. A non-localized 31P spectrum was then acquired and RF transmit frequency was centered on the PCr resonance. TDST data was acquired with Tsat = 0.2, 0.4, 0.7, 1.3, 2.5, 4 and 6 sec, relaxation delay = 6 sec, receiver bandwidth = 3000 Hz, and 48 signal averages. Non-saturated spectra were also acquired with repetition time of 6 and 12 sec. The strength of off resonance spillover was estimated by applying the saturation pulse at +2.5 ppm. Total data acquisition time was approximately 1 hour.
Table 1.
Subjects characteristics and CK reaction kinetic parameters
| Subject characteristics | CK Parameters | |||||
|---|---|---|---|---|---|---|
| Age Years |
Height ft |
Weight lb |
kf (1/sec) |
T1 sec |
PCr/ATP | |
| Mean | 40.87 | 5.9 | 172.47 | 0.32 | 7.36 | 1.94 |
| SD | 13.67 | 0.22 | 28.90 | 0.05 | 1.79 | 0.15 |
| Maximum | 57 | 225 | 6.33 | 0.38 | 9.54 | 2.13 |
| Minimum | 25 | 125 | 5.58 | 0.25 | 3.59 | 1.73 |
To assess the repeatability of measurement a subgroup of subjects (n = 7; 6 males 1 female), were scanned twice. Three subjects were scanned same day. One subject was removed and then returned to the scanner several minutes later. The other two subjects were not removed from the scanner however the localizer images, shimming and frequency was verified between the measurements. Four other subjects were scanned within the 60 days of their initial visit.
Data Analysis
Spectra were processed offline using the jMRUI (Java-based magnetic resonance user interface) software. Spectra were fitted in time domain by using a nonlinear least-squares algorithm (AMARES) (27,28). ATP, PCr, inorganic phosphates (Pi), 2,3-diphosphoglycerate (DPG), inorganic phosphate, and phosphodiester (PDE) signals were fitted to Lorentzian line shapes. For unsaturated spectra the three ATP peaks were fitted as two doublets and one triplet, with equal amplitudes and line widths and prior knowledge for the J -coupling constant (29). The value for the γ-ATP peak was corrected for blood contamination as described previously (30). γ-ATP doublet was not included when model was fit to saturation transfer data. When fitting the TDST data the PCr linewidth was constrained to the linewidth of control spectra obtained from unconstrained fit. The PCr peak intensity was then fit to Eq. [3] in MATLAB to calculate , and τ, with determined from non-saturated spectra corrected for partial saturation. Blood contains no observable PCr hence no correction is needed for these calculations. All values reported are mean ± standard deviation. Absolute concentration of PCr was calculated with the assumption that ATP concentration is 5.5 µM/g in healthy hearts (18).
Statistical Analysis
Results are expressed as mean ± standard deviation. The percentage coefficients of variation [CV (%) = (standard deviation/mean) × 100] was calculated to determine the reproducibility of the technique. Assessment of repeatability was also determined by the methods outlined by Bland and Altman and the coefficient of repeatability was calculated by multiplying the standard deviation of the differences by 1.96 (31). Test-retest reliability was analyzed using the intraclass correlation coefficient (ICC). Values are expressed as mean ± standard error of the mean unless otherwise stated.
RESULTS
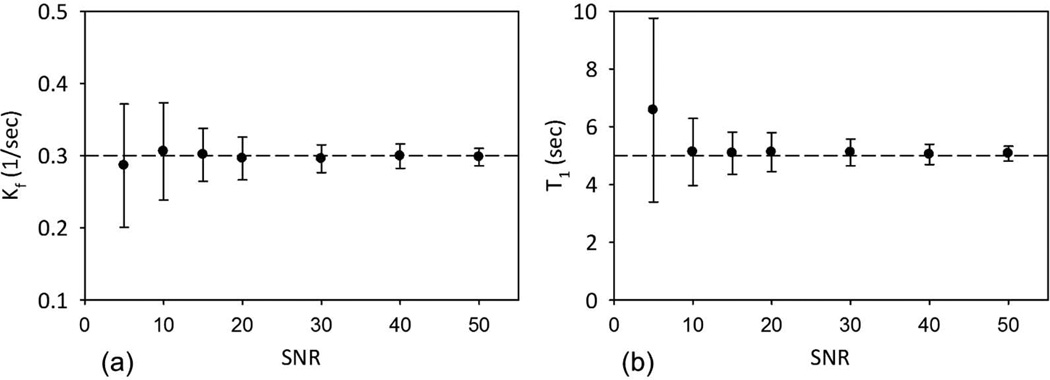
Monte Carlo simulations show that for SNR > 30 observed in vivo, the errors in CK reaction kinetic parameters would be less than 2% and CV = 6.5% and 9.0% for kf and T1 respectively (Fig. 4). As SNR increased to 50 the errors reduced to less than 1% and CV below 5% for both parameters. For SNR of 5, lowest tested in these simulations, the errors increased to 4.3% and 31.5% for kf and T1 respectively. Although the error remains small for the CK rate constant the standard deviation of the estimate rises to 29.1%.
Figure 4.
Mean CK reaction rate constant (kf) (a) and T1 (b) and corresponding standard deviation are shown as a function of SNR from Monte Carlo simulations. Although the percentage error is small even for low SNR the standard deviation in the measured reaction rate increases.
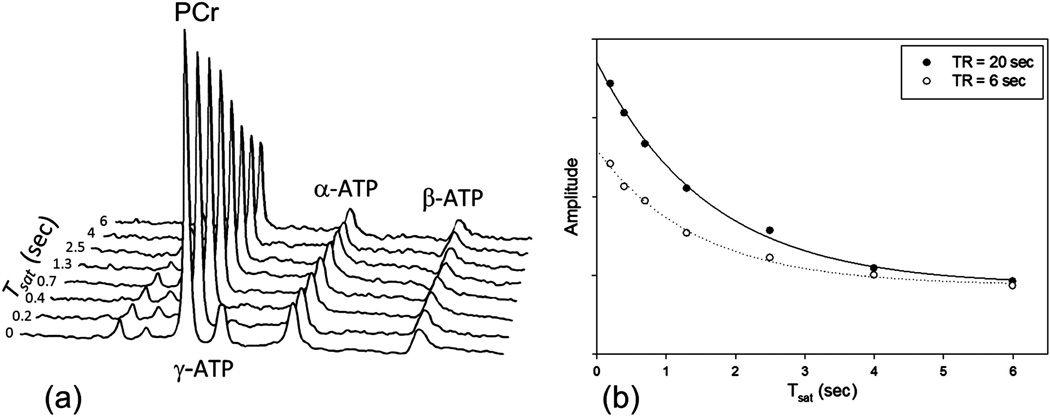
Skeletal muscle studies show that PCr signal intensity as a function of Tsat decays exponentially for both d1 = 20 sec and 6 sec and similar steady state magnetization is achieved as long as γ-ATP is fully saturated (Fig. 5). Mean kf determined for the two protocols were the same 0.44 ± 0.02 sec−1 and 0.42 ± 0.01 sec−1 respectively. However, the short d1 measurement resulted in 63% saving in scanning time based on our protocol. These measurements are in agreement with previously reported results in skeletal muscle (29,32). Furthermore Xiong et al. have demonstrated that the choice of relaxation delay does not impact the measurement of kf and optimal delay can result in significant saving in experimental time (16).
Figure 5.
(a) Representative TDST spectra from the leg. The PCr peak intensity decreases as the saturation time for γ-ATP is increased. (b) Data and fitting results shown for long (d1 = 20 sec) and short (d1 = 6 sec). The plots show similar apparent relaxation rate constant and steady state magnetization. Short TR acquisition resulted in 63% time savings for the experiment.
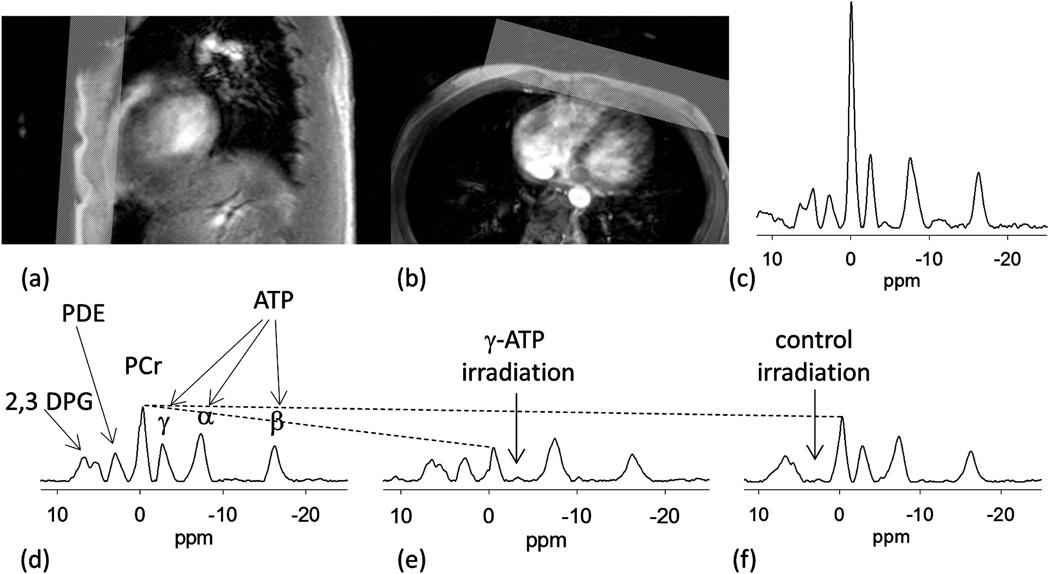
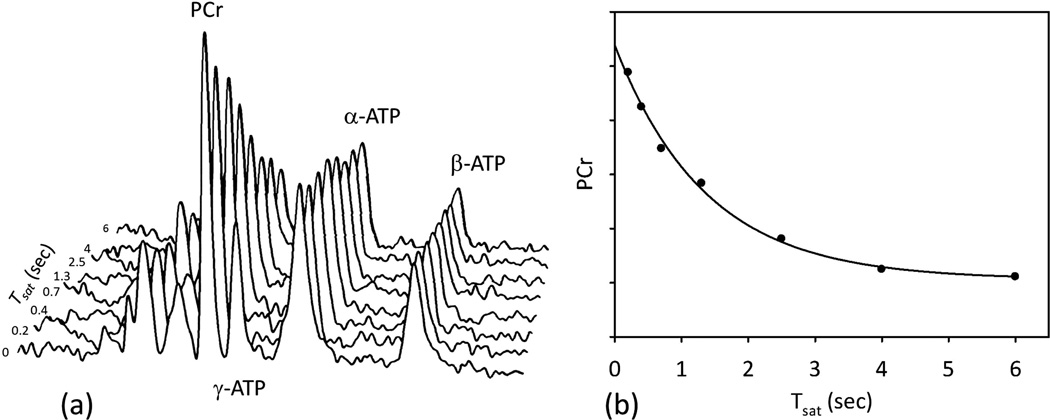
Scout image of the heart and location of ROI to eliminate the signal from the chest muscles is shown figure 6a and 6b. When no ROI is used the high PCr/ATP (>3) indicate unwanted signal contribution from the chest muscles (Fig. 6c). Typical 31P spectra of the heart without saturation, with saturation of γ-ATP peak, and with control irradiation from a subject are shown in figure 6d – 6f respectively. The PCr signal is significantly reduced when the γ-ATP signal is irradiated because the saturated γ-ATP peak does not contribute to the PCr signal via the CK reverse reaction. When control irradiation is applied a small decrease is seen in the PCr peak intensity due to direct spillover effect. The stack of TDST spectra and example of data fitting for the forward CK reaction rate constant (kf) are shown in figure 7.
Figure 6.
Sagittal (a) and axial (b) reference images of the heart and placement of the ROI. (b) A small fiducial marking the center of the RF coil is visible in the images. (c) Spectrum without localization shows a large PCr peak relative to ATP indicating signal arising from the chest muscles. (d) Typical spectrum from heart without selective RF irradiation detailing the peaks of PCr, ATP, PDE and 2,3 DPG. (e) Representative spectra from a saturation transfer experiment when γ-ATP peak is saturated. The decrease in PCr peak is due to the transfer of saturation between γ-ATP and PCr through the CK reaction. (f) Control spectrum with selective RF irradiation at 2.5 ppm. The arrows identify the frequency of the saturating irradiation. The dotted line gives a visual cue of direct saturation of PCr peak due to imperfect selectivity of saturating pulse.
Figure 7.
(a) Example spectra representing a TDST experiment from the heart. The PCr peak intensity decreased as the saturation time (Tsat) was increased. The decrease in PCr peak is due to ATP production via CK reaction. (b) Calculation of apparent PCr relaxation time constant (τ) and the steady state PCr magnetization ().
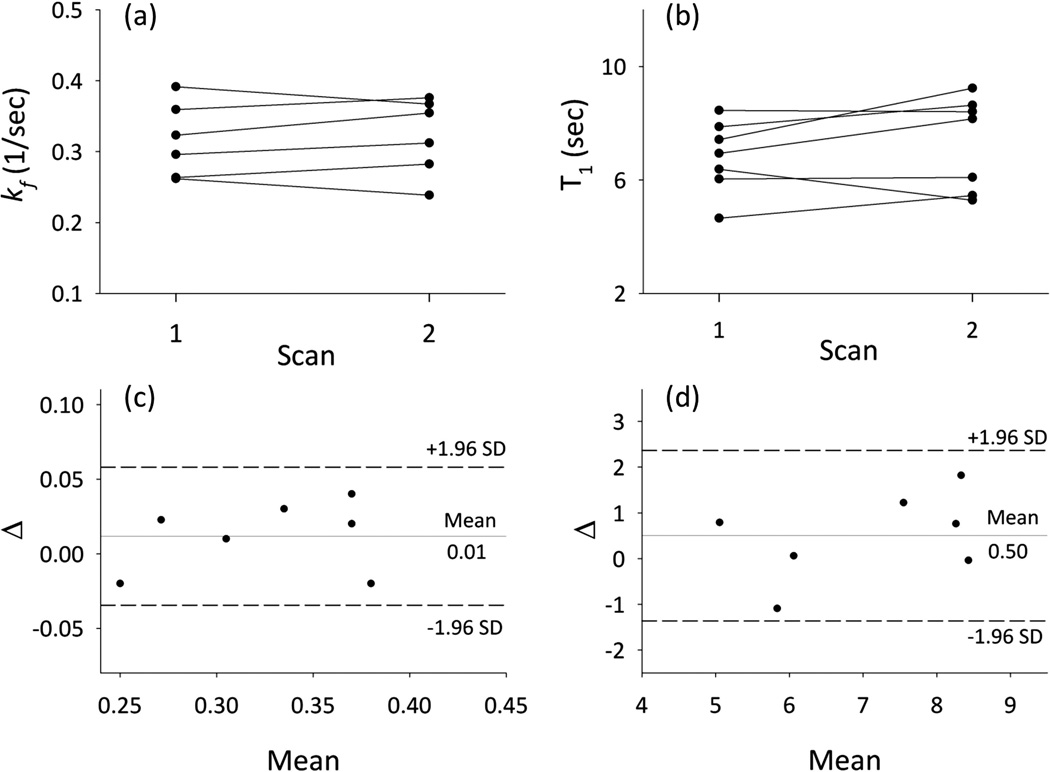
Based on all measurements (including repeats) the kf values for heart were found to be 0.32 ± 0.05 sec−1 with CV = 15.62%. Intrinsic T1 for PCr in absence of exchange was 7.36 ± 1.79 sec with CV = 24.32%. This is consistent simulation results which showed higher CV for T1 calculation. The PCr/ATP ratio was 1.94 ± 0.15 which is in the range for control subjects and the [PCr] = 10.48 ± 0.81 µM/g wet weight which is comparable with previous reports. CK flux was calculated using the equation CKflux = kf.[PCr] and was = 3.29 ± 0.62 (µM/g.sec). Test-retest showed good reproducibility of CK reaction rate constant with an ICC = 0.90 and a repeatability at 5.67%. Similarly good reproducibility was observed for T1 (ICC = 0.79) and PCr concentration (ICC = 0.86). The results are summarized in Table 1 and Bland–Altman plots of the test-retest experiments are shown in Fig. 8.
Figure 8.
Individual data for kf (a) and T1 (b) during each test. Bland-Altman plots of the repeatability between the measurements of the same subject (c) kf and (d) T1.
DISCUSSION
We have implemented TDST method to measure first order CK reaction rates in human hearts at 3T. The strategy resulted in effective signal localization from the heart, SAR within FDA guidelines, and optimal data acquisition within the constraints of a clinically acceptable scan time (~1 hour). CK flux and kf reported here are similar to the published values in human heart (17–19). Based on all measurements CV of the CK reaction rate constant was = 15.2%. Test-retest studies showed good reliability with ICC = 0.90 and 0.79 for kf and T1 respectively. The CV of PCr/ATP ratios in our study is similar to previously reported results.
The TDST implementation used in this study offers several advantages. (i) By eliminating the signal from chest muscles we were able to maximize the volume of the heart tissue that contributes to the NMR signal leading to increased SNR. (ii) The determination of relaxation rate constant is not dependent on the precise flip angle of the excitation pulse as long as each data point has the same B1 weighting. This was ensured by using the same relaxation delay hence the same steady state is achieved before saturation pulse. (iii) Relaxation delay of 6 sec allowed us to optimize SNR and also ensure that SAR is kept well below the FDA guidelines. In high field studies where SAR may become a limitation hence d1 can be adjusted to limit RF power deposition.
The results show good reproducibility of the CK reaction kinetic parameters however our subject consisted of mostly healthy males. Several factors might reduce the reproducibility of the technique, such as heart failure, where the CK reaction rate constant is slower and/or the PCr concentration may also be reduced. In addition the size of the subjects (such as obese or female subjects) may also affect the measurements due to the distance of the heart from the surface coil which can reduce the available SNR. We used a 10 cm surface coil and similar or smaller size coils have been used in previous cardiac 31P MRS studies, (17,18,24) however studies in obese subjects will require larger RF coil optimized for the subject population. The measurements highlight the errors inherent in the technical acquisition and processing of the data. Simulation studies indicate that SNR of over 20 is desirable to achieve this level of reproducibility. Typical SNR ranged from approximately 20 for spectra with Tsat = 6 sec to over 45 for spectra without any saturation. Even though a small number of subjects were used for reproducibility measurements this data is still crucial for design of future clinical studies and will enable power calculations to determine appropriate sample sizes to reveal differences in the groups.
A 10 cm surface coil has sufficient coverage to allow acquisition of signal from the myocardium but it might be susceptible to contamination from the lateral chest muscles. A smaller coil would be less susceptible to contamination from the lateral wall but will suffer from reduced SNR due to poor depth coverage. Most of cardiac 31P studies use surface coils ranging from 9–12 cm and a central placement of the coil reduces the contamination from the lateral walls. Another consideration is the transition bands of the AFP pulse can cause signal loss from the myocardium. Although this loss is small in two compartment phantom studies however it needs to be quantified for absolute measurement of [PCr] and [ATP] in vivo.
Compared to 1.5T magnet the 3T offers two significant advantages, increased SNR and chemical shift dispersion (33). Increased chemical shift improves the ability to saturate γ-ATP while minimizing the spillover to the PCr peak. We use a near continuous low power RF pulse to saturate γ-ATP. This produces a narrow suppression band at the desired frequency and is attractive to minimize spillover. We did observe direct small spillover effect on the PCr peak. Analysis of exchange modified Bloch equations demonstrate that errors caused by spillover are small for kf when the spillover is under 20% (17). Recently the feasibility of human heart 31P MRS was demonstrated at 7T, (34) which has several advantages such as shorter T1 relaxation time of 31P metabolites, higher SNR and increased chemical shift. However 3T magnet is still the most widely used system for clinical research and implementation of cardiac saturation transfer spectroscopy at 7T still need to overcome several challenges especially increased SAR.
Besides PCr, saturation of γ-ATP showed a small decrease in β- and α-ATP peaks. This has been observed before in heart and brain 31P saturation transfer studies (35,36). The mechanisms behind this phenomenon were investigated in a recent study (37). The decrease in β-ATP by saturating γ-ATP may result from simultaneous saturation of nearby β-ADP peak which exchanges with β-ATP during reactions catalyzed by CK and ATPase and also be chemical exchange between γ- and β-ATP catalyzed by adenylate kinase reaction. The study also identified that the reason of decrease in α-ATP signal intensity comes from the negative 31P Nuclear Overhauser effect (NOE) among the γ-ATP, β-ATP and α-ATP spins in situ. However these effects are small and should not significantly affect the measurements of the chemical exchange fluxes.
Lack of experimental quantification of [PCr] is a major limitation of this study. [PCr] was based on the assumption that in vivo ATP concentration is highly regulated and similar approach has been used previously (38–40). However, reports have shown that [PCr] is reduced in hypertrophied and in failing human myocardium and both absolute [ATP] and [PCr] are reduced in dilated cardiomyopathy. Age related changes in PCr and ATP concentrations in human myocardium have also been observed (18,41–43). These studies highlight the importance of measuring absolute [PCr] in disease state. However numerous studies have shown that kf is a more sensitive and early indicator of pathology than steady state metabolite concentrations (9,14,18). Alterations in PCr and ATP do not affect the measurement of kf however [PCr] will affect the absolute flux through the CK reaction. Future studies should include measurement of [PCr] and [ATP] as these combined with kf would provide a complete picture of bioenergetic abnormalities.
We did not use any respiratory gating or cardiac gating in this study and most previous saturation transfer studies in heart have been conducted without respiratory and cardiac gating (17,18). Respiratory motion can cause the chest to move outside the ROI reducing the efficiency of the localizations. In order to reduce breathing artifacts we acquired several free breathing scout images and the ROI was placed to accommodate for any breathing related motion. Similarly cardiac gating was not employed since experimental restrictions (fixed duration saturation pulses) do not permit cardiac gating. Cardiac motion can potentially increase the line width of the spectral peaks however good quality spectra were obtained without gating.
Cardiac 31P MRS suffers from inherent SNR limitations and studies have been mostly limited to measurement of steady state value of PCr/ATP ratio. We have demonstrated a 31P ST MRS which provides accurate measurements of in vivo cardiac CK forward rate constant and flux in human heart. This reproducibility data will enable calculation of the power and sample sizes required for clinical and research studies. Future studies may provide new insights in the relationship between energy deficit and functional deficiency in heart.
ACKNOWLEDGEMENTS
This work was supported by NIH grant K01 EB 010171. The authors would also like to thank J. Ackerman, D. Yablonskiy and B. O’Connor for helpful discussions.
Abbreviations
- TDST
Time dependent saturation transfer
- CK
Creatine kinase
- ATP
Adenosine triphosphate
- ADP
Adenosine diphosphate
- PCr
Phosphocreatine
- Cr
Creatine
- ISIS
Image selected in vivo spectroscopy
- CSI
Chemical shift imaging
- AHP
Adiabatic half passage
- AFP
Adiabatic full passage
- LV
Left ventricle
- CHF
Cardiac heart failure
- d1
relaxation delay
REFERENCES
- 1.Lipskaya TY. Mitochondrial creatine kinase: properties and function. Biochemistry (Mosc) 2001;66(10):1098–1111. doi: 10.1023/a:1012428812780. [DOI] [PubMed] [Google Scholar]
- 2.Nascimben L, Ingwall JS, Pauletto P, Friedrich J, Gwathmey JK, Saks V, Pessina AC, Allen PD. Creatine kinase system in failing and nonfailing human myocardium. Circulation. 1996;94(8):1894–1901. doi: 10.1161/01.cir.94.8.1894. [DOI] [PubMed] [Google Scholar]
- 3.De Sousa E, Veksler V, Minajeva A, Kaasik A, Mateo P, Mayoux E, Hoerter J, Bigard X, Serrurier B, Ventura-Clapier R. Subcellular creatine kinase alterations. Implications in heart failure. Circ Res. 1999;85(1):68–76. doi: 10.1161/01.res.85.1.68. [DOI] [PubMed] [Google Scholar]
- 4.Nascimben L, Friedrich J, Liao R, Pauletto P, Pessina AC, Ingwall JS. Enalapril treatment increases cardiac performance and energy reserve via the creatine kinase reaction in myocardium of Syrian myopathic hamsters with advanced heart failure. Circulation. 1995;91(6):1824–1833. doi: 10.1161/01.cir.91.6.1824. [DOI] [PubMed] [Google Scholar]
- 5.Tian R, Nascimben L, Kaddurah-Daouk R, Ingwall JS. Depletion of energy reserve via the creatine kinase reaction during the evolution of heart failure in cardiomyopathic hamsters. Journal of molecular and cellular cardiology. 1996;28(4):755–765. doi: 10.1006/jmcc.1996.0070. [DOI] [PubMed] [Google Scholar]
- 6.Field ML, Clark JF, Henderson C, Seymour AM, Radda GK. Alterations in the myocardial creatine kinase system during chronic anaemic hypoxia. Cardiovasc Res. 1994;28(1):86–91. doi: 10.1093/cvr/28.1.86. [DOI] [PubMed] [Google Scholar]
- 7.Sharkey SW, Murakami MM, Smith SA, Apple FS. Canine myocardial creatine kinase isoenzymes after chronic coronary artery occlusion. Circulation. 1991;84(1):333–340. doi: 10.1161/01.cir.84.1.333. [DOI] [PubMed] [Google Scholar]
- 8.Smith SH, Kramer MF, Reis I, Bishop SP, Ingwall JS. Regional changes in creatine kinase and myocyte size in hypertensive and nonhypertensive cardiac hypertrophy. Circ Res. 1990;67(6):1334–1344. doi: 10.1161/01.res.67.6.1334. [DOI] [PubMed] [Google Scholar]
- 9.Bittl JA, Ingwall JS. Reaction rates of creatine kinase and ATP synthesis in the isolated rat heart. A 31P NMR magnetization transfer study. J Biol Chem. 1985;260(6):3512–3517. [PubMed] [Google Scholar]
- 10.Chen W, Zhu XH, Adriany G, Ugurbil K. Increase of creatine kinase activity in the visual cortex of human brain during visual stimulation: a 31P magnetization transfer study. Magn Reson Med. 1997;38(4):551–557. doi: 10.1002/mrm.1910380408. [DOI] [PubMed] [Google Scholar]
- 11.Sauter A, Rudin M. Determination of creatine kinase kinetic parameters in rat brain by NMR magnetization transfer. Correlation with brain function. J Biol Chem. 1993;268(18):13166–13171. [PubMed] [Google Scholar]
- 12.Forsén S, Hoffman RA. Study of moderately rapid chemical exchange reactions by means of nuclear magnetic double resonance. J Chem Phys. 1964;39:2892–2901. [Google Scholar]
- 13.Bittl JA, Balschi JA, Ingwall JS. Contractile failure and high-energy phosphate turnover during hypoxia: 31P-NMR surface coil studies in living rat. Circ Res. 1987;60(6):871–878. doi: 10.1161/01.res.60.6.871. [DOI] [PubMed] [Google Scholar]
- 14.Hamman BL, Bittl JA, Jacobus WE, Allen PD, Spencer RS, Tian R, Ingwall JS. Inhibition of the creatine kinase reaction decreases the contractile reserve of isolated rat hearts. Am J Physiol. 1995;269(3 Pt 2):H1030–H1036. doi: 10.1152/ajpheart.1995.269.3.H1030. [DOI] [PubMed] [Google Scholar]
- 15.Matsumoto Y, Kaneko M, Kobayashi A, Fujise Y, Yamazaki N. Creatine kinase kinetics in diabetic cardiomyopathy. Am J Physiol. 1995;268(6 Pt 1):E1070–E1076. doi: 10.1152/ajpendo.1995.268.6.E1070. [DOI] [PubMed] [Google Scholar]
- 16.Xiong Q, Li Q, Mansoor A, Jameel MN, Du F, Chen W, Zhang J. Novel strategy for measuring creatine kinase reaction rate in the in vivo heart. Am J Physiol Heart Circ Physiol. 2009;297(3):H1010–H1019. doi: 10.1152/ajpheart.01195.2008. [DOI] [PMC free article] [PubMed] [Google Scholar]
- 17.Bottomley PA, Ouwerkerk R, Lee RF, Weiss RG. Four-angle saturation transfer (FAST) method for measuring creatine kinase reaction rates in vivo. Magn Reson Med. 2002;47(5):850–863. doi: 10.1002/mrm.10130. [DOI] [PMC free article] [PubMed] [Google Scholar]
- 18.Smith CS, Bottomley PA, Schulman SP, Gerstenblith G, Weiss RG. Altered creatine kinase adenosine triphosphate kinetics in failing hypertrophied human myocardium. Circulation. 2006;114(11):1151–1158. doi: 10.1161/CIRCULATIONAHA.106.613646. [DOI] [PMC free article] [PubMed] [Google Scholar]
- 19.Schar M, El-Sharkawy AM, Weiss RG, Bottomley PA. Triple repetition time saturation transfer (TRiST) 31P spectroscopy for measuring human creatine kinase reaction kinetics. Magn Reson Med. 2010;63(6):1493–1501. doi: 10.1002/mrm.22347. [DOI] [PMC free article] [PubMed] [Google Scholar]
- 20.Bashir A, Yablonskiy DA. Natural linewidth chemical shift imaging (NL-CSI) Magn Reson Med. 2006;56(1):7–18. doi: 10.1002/mrm.20917. [DOI] [PMC free article] [PubMed] [Google Scholar]
- 21.Alger JR, Shulman RG. NMR studies of enzymatic rates in vitro and in vivo by magnetization transfer. Q Rev Biophys. 1984;17(1):83–124. doi: 10.1017/s0033583500005266. [DOI] [PubMed] [Google Scholar]
- 22.Brindle KM. NMR methods for measuring enzyme kinetics in vivo. Prog Nucl Magn Reson Spectrosc. 1988;20(3):257–293. [Google Scholar]
- 23.Kuchel PW. Spin-exchange NMR spectroscopy in studies of the kinetics of enzymes and membrane transport. NMR Biomed. 1990;3(3):102–119. doi: 10.1002/nbm.1940030303. [DOI] [PubMed] [Google Scholar]
- 24.El-Sharkawy AM, Schar M, Ouwerkerk R, Weiss RG, Bottomley PA. Quantitative cardiac 31P spectroscopy at 3 Tesla using adiabatic pulses. Magn Reson Med. 2009;61(4):785–795. doi: 10.1002/mrm.21867. [DOI] [PMC free article] [PubMed] [Google Scholar]
- 25.Weglage J, Wiedermann D, Denecke J, Feldmann R, Koch HG, Ullrich K, Harms E, Moller HE. Individual blood-brain barrier phenylalanine transport determines clinical outcome in phenylketonuria. Annals of neurology. 2001;50(4):463–467. doi: 10.1002/ana.1226. [DOI] [PubMed] [Google Scholar]
- 26.Menon RS, Hendrich K, Hu X, Ugurbil K. 31P NMR spectroscopy of the human heart at 4 T: detection of substantially uncontaminated cardiac spectra and differentiation of subepicardium and subendocardium. Magn Reson Med. 1992;26(2):368–376. doi: 10.1002/mrm.1910260216. [DOI] [PubMed] [Google Scholar]
- 27.Naressi A, Couturier C, Devos JM, Janssen M, Mangeat C, de Beer R, Graveron-Demilly D. Java-based graphical user interface for the MRUI quantitation package. MAGMA. 2001;12:141–152. doi: 10.1007/BF02668096. [DOI] [PubMed] [Google Scholar]
- 28.Vanhamme L, Van Huffel S, Van Hecke P, van Ormondt D. Time-domain quantification of series of biomedical magnetic resonance spectroscopy signals. J Magn Reson. 1999;140(1):120–130. doi: 10.1006/jmre.1999.1835. [DOI] [PubMed] [Google Scholar]
- 29.Wiedermann D, Schneider J, Fromme A, Thorwesten L, Moller HE. Creatine loading and resting skeletal muscle phosphocreatine flux: a saturation-transfer NMR study. MAGMA. 2001;13(2):118–126. doi: 10.1007/BF02668160. [DOI] [PubMed] [Google Scholar]
- 30.Neubauer S, Krahe T, Schindler R, Horn M, Hillenbrand H, Entzeroth C, Mader H, Kromer EP, Riegger GA, Lackner K, et al. 31P magnetic resonance spectroscopy in dilated cardiomyopathy and coronary artery disease. Altered cardiac high-energy phosphate metabolism in heart failure. Circulation. 1992;86(6):1810–1818. doi: 10.1161/01.cir.86.6.1810. [DOI] [PubMed] [Google Scholar]
- 31.Bland JM, Altman DG. Statistical methods for assessing agreement between two methods of clinical measurement. Lancet. 1986;1(8476):307–310. [PubMed] [Google Scholar]
- 32.Goudemant JF, Francaux M, Mottet I, Demeure R, Sibomana M, Sturbois X. 31P NMR saturation transfer study of the creatine kinase reaction in human skeletal muscle at rest and during exercise. Magn Reson Med. 1997;37(5):744–753. doi: 10.1002/mrm.1910370518. [DOI] [PubMed] [Google Scholar]
- 33.Tyler DJ, Hudsmith LE, Clarke K, Neubauer S, Robson MD. A comparison of cardiac (31)P MRS at 1.5 and 3T. NMR Biomed. 2008;21(8):793–798. doi: 10.1002/nbm.1255. [DOI] [PubMed] [Google Scholar]
- 34.Rodgers CT, Clarke WT, Snyder C, Vaughan JT, Neubauer S, Robson MD. Human cardiac P magnetic resonance spectroscopy at 7 tesla. Magn Reson Med. 2013 doi: 10.1002/mrm.24922. [DOI] [PMC free article] [PubMed] [Google Scholar]
- 35.Koretsky AP, Basus VJ, James TL, Klein MP, Weiner MW. Detection of exchange reactions involving small metabolite pools using NMR magnetization transfer techniques: relevance to subcellular compartmentation of creatine kinase. Magn Reson Med. 1985;2(6):586–594. doi: 10.1002/mrm.1910020610. [DOI] [PubMed] [Google Scholar]
- 36.Shoubridge EA, Briggs RW, Radda GK. 31p NMR saturation transfer measurements of the steady state rates of creatine kinase and ATP synthetase in the rat brain. FEBS letters. 1982;140(2):289–292. doi: 10.1016/0014-5793(82)80916-2. [DOI] [PubMed] [Google Scholar]
- 37.Du F, Zhang Y, Chen W. Relayed magnetization transfer from nuclear Overhauser effect and chemical exchange observed by in vivo (3)(1)P MRS in rat brain. Magnetic resonance imaging. 2012;30(5):716–721. doi: 10.1016/j.mri.2012.01.005. [DOI] [PMC free article] [PubMed] [Google Scholar]
- 38.Hudsmith LE, Neubauer S. Detection of myocardial disorders by magnetic resonance spectroscopy. Nature clinical practice Cardiovascular medicine. 2008;5(Suppl 2):S49–S56. doi: 10.1038/ncpcardio1158. [DOI] [PubMed] [Google Scholar]
- 39.Hudsmith LE, Neubauer S. Magnetic resonance spectroscopy in myocardial disease. JACC Cardiovascular imaging. 2009;2(1):87–96. doi: 10.1016/j.jcmg.2008.08.005. [DOI] [PubMed] [Google Scholar]
- 40.Smith SA, Montain SJ, Matott RP, Zientara GP, Jolesz FA, Fielding RA. Effects of creatine supplementation on the energy cost of muscle contraction: a 31P-MRS study. J Appl Physiol. 1999;87(1):116–123. doi: 10.1152/jappl.1999.87.1.116. [DOI] [PubMed] [Google Scholar]
- 41.Conway MA, Allis J, Ouwerkerk R, Niioka T, Rajagopalan B, Radda GK. Detection of low phosphocreatine to ATP ratio in failing hypertrophied human myocardium by 31P magnetic resonance spectroscopy. Lancet. 1991;338(8773):973–976. doi: 10.1016/0140-6736(91)91838-l. [DOI] [PubMed] [Google Scholar]
- 42.Kostler H, Landschutz W, Koeppe S, Seyfarth T, Lipke C, Sandstede J, Spindler M, von Kienlin M, Hahn D, Beer M. Age and gender dependence of human cardiac phosphorus metabolites determined by SLOOP 31P MR spectroscopy. Magn Reson Med. 2006;56(4):907–911. doi: 10.1002/mrm.21027. [DOI] [PubMed] [Google Scholar]
- 43.Lamb HJ, Beyerbacht HP, van der Laarse A, Stoel BC, Doornbos J, van der Wall EE, de Roos A. Diastolic dysfunction in hypertensive heart disease is associated with altered myocardial metabolism. Circulation. 1999;99(17):2261–2267. doi: 10.1161/01.cir.99.17.2261. [DOI] [PubMed] [Google Scholar]


