



Abstract
The aim of this study was to obtain detailed information regarding the three-dimensional structure of the gastro-oesophageal region, and, in particular, the fiber orientation of the different muscle layers of the junction. This was achieved by a study of an en bloc resection of the gastro-oesophageal junction (GOJ) harvested from a human cadaver. The excised tissue block was suspended in a cage to preserve anatomical relationships, fixed in formalin and embedded in wax. The tissue block was then processed by a custom-built extended-volume imaging system to obtain the microstructural information using a digital camera which acquires images at a resolution of 8.2 μm/pixel. The top surface of the tissue block was sequentially stained and imaged. At each step, the imaged surface was milled off at a depth of 50 μm. The processing of the tissue block resulted in 650 images covering a length of 32.25 mm of the GOJ. Structures, including the different muscle and fascial layers, were then traced out from the cross-sectional images using color thresholding. The traced regions were then aligned and assembled to provide a three-dimensional representation of the GOJ. The result is the detailed three-dimensional microstructural anatomy of the GOJ represented in a new way. The next stage will be to integrate key physiological events, including peristalsis and relaxation, into this model using mathematical modeling to allow accurate visual tools for training health professionals and patients.
Keywords: gastro-oesophageal junction, micro-anatomy, three-dimensional, microstructural information
INTRODUCTION
The gastro-oesophageal junction (GOJ) is a highly specialized anatomical region that is often difficult to understand. Furthermore, the definition and description of the GOJ vary between the anatomist, histologist, endoscopist, physiologist, and surgeon (Mosher, 1930; Peters, 1955; Botha, 1958; Bombeck et al., 1966; Liebermann-Meffert and Brauer, 1995; Kahrilas, 1997; Skandalakis et al., 1997; Park et al., 2003; Castell and Richter, 2004). The surgeon dissects the GOJ according to the type of operation being performed. In surgery for cancer, it is usual to remove a cuff (superficial section) of the diaphragm with the GOJ to ensure the lowest risk of a positive radial margin (Law and Wong, 2007). In surgery for benign disease, including gastro-oesophageal reflux disease and achalasia, the crura of the diaphragm are left intact, and the attachment of the lower oesophagus to the diaphragm is divided or disrupted (Nussbaum, 2007). This circumferential attachment is the phreno-oesophageal ligament (POL), derived from the conjoined endo-thoracic and endo-abdominal fascia of the diaphragm, and an understanding of this structure is important in understanding the surgical anatomy of the GOJ (Kwok et al., 1999).
The highly elastic POL is designed to return the lower oesophagus to its neutral position, with two to three centimeters within the abdomen, following the periodic shortening of the oesophagus resulting from longitudinal muscle (LM) contraction during peristalsis. There remains confusion in the literature about the structure and functions of the POL. Some studies have, however, questioned the existence of the POL and its contribution to the function of the GOJ and the anti-reflux mechanism and have described this tissue as simply “a continuation of the diaphragmatic fascia from the abdominal aspect and the diaphragmatic reflection of the endo-thoracic fascia from the thoracic side” (Davis, 1953; Daniels, 1965; Bremner et al., 1970). The POL is now understood to be a key structure. The anatomy needs to be understood for the safe dissection of the GOJ, and the physiology needs to be understood to appreciate the functional significance of the POL. Oesophageal contraction during peristalsis results in oesophageal shortening. The highly elastic upper leaf of the POL acts to return the GOJ to the neutral position. A sliding hiatus hernia is the result of failure of this POL function and is seen as the attenuation of this structure (Curci et al., 2008). This is analogous to the failure of the transversalis fascia in the inguinal hernia, and this fascia and POL are both specialized regions of the same layer of the somatic wall.
Although general descriptions of the GOJ are available, detailed high-resolution anatomical images of the GOJ in three-dimensions are lacking. Understanding the anatomy in three-dimensions may improve the understanding of the interdependence between the anatomy and physiology of the GOJ. The aim of this study was to produce a microanatomically accurate three-dimensional model of the GOJ region. Such a model should provide a valuable tool for health professional training and patient education.
MATERIALS AND METHODS
The technique presented in this study was initially performed using fresh GOJ tissue obtained from a sheep (Yassi et al., 2005). An attempt was subsequently made using two tissue samples of GOJs obtained from normal and diseased embalmed cadavers. The technique presented in this study required the tissue to be stained for muscle fibers and connective tissue. Because of the embalming process performed on the cadavers, the tissues were not able to react to the stains. Therefore, a distinction between the muscle fibers and connective tissues could not be clearly demonstrated using embalmed cadaveric tissues. Hence, GOJ tissue from a recently deceased subject was required.
Obtaining Fresh Tissue Specimen
Ethics approval was obtained from the Northern Regional Ethics Committee (Auckland District Health Board, New Zealand) for the en bloc excision of the lower oesophagus, GOJ, upper stomach, lower oesophagus, and central diaphragm from a fresh cadaver at postmortem. Informed consent was obtained by the staff at the mortuary at Auckland Hospital from the mother of a 19-year-old male. The tissue was excised 10 hr after death. There was no prior history of oesophageal symptoms, such as gastro-oesophageal reflux or dysphagia, and no prior surgery to the region.
Tissue Preparation
The specimen was extracted to retain 1.5 cm of oesophagus, 3.0 cm of the cardia of the stomach, the entire length of the crura, and a 2.0 cm circumferential cuff of diaphragm. The specimen was then suspended by multiple stay sutures in a cage (Fig. 1a and 1b) to ensure that the three-dimensional anatomical relations of all component structures were maintained and that there was no undue tension in any direction. The suspended specimen was then soaked in 3% buffered formalin solution for 7 days and then dehydrated in a graduated series of ethanol concentrations. The dehydrated specimen was then embedded in wax using a TISSUE-TEK VIP 2000 automatic processor (Global Medical Instrumentation, MN). Figure 1b illustrates the specimen during wax embedding. The dimensions of the block of the wax-embedded specimen were 75 × 75 × 55 mm3.
Figure 1.
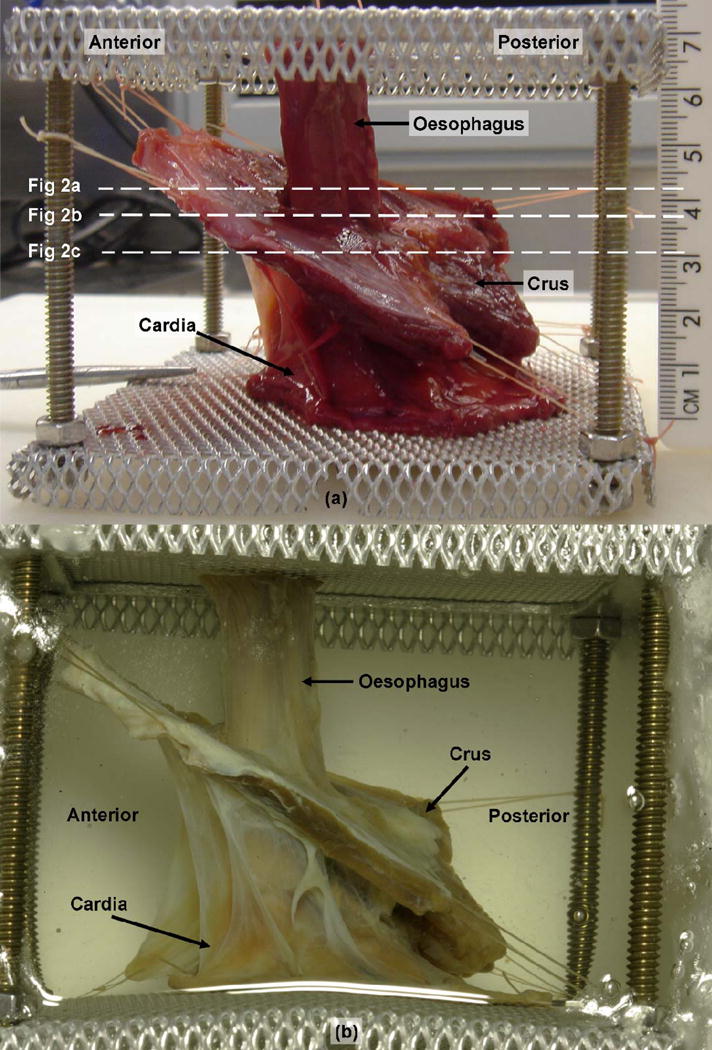
a: A left lateral view of the fresh mounted human cadaveric gastro-oesophageal junction, prior to formalin fixation and wax-embedding. b: A left lateral view of the human cadaveric gastro-oesophageal junction, during wax-embedding. The tissue was suspended in a specially designed jig with sutures to maintain the in vivo anatomic relations. The white-dashed lines indicate the level of the cross-sectional images in Figure 2a, 2b, and 2c.
Extended-Volume Imaging System
A custom-built extended-volume imaging system (Gerneke et al., 2007) was used to obtain two-dimensional images of the tissue block at ~8 μm/pixel resolution. The system consisted of a high-precision (0.1 μm step) three-axis (XYZ) Aerotech translation stage mounted on a Newport 1.5 × 1 m2 antivibration table (Newport Corporation, Irvine, CA), an imaging facility [Leica 4D confocal microscope and an 8.2 megapixels (3,504 × 2,336 pixels) digital camera (Canon 1D mark II, Tokyo, Japan) with a Canon 65-mm Photomicro lens] and a tissue milling facility (Leica SP2600 ultramill, Nussloch, Germany). The ultramill can produce a flat surface by removing as little as 2.5 μm from the sample over an 80-mm path using diamondtipped cutters. The three-axis translation stage can travel 1,000 mm, 200 mm, and 76 mm in the X, Y, and Z directions, respectively.
The wax-embedded tissue block was fixed onto an aluminum sample plate using melted wax and was then mounted on the stage of the extended-volume imaging system. The tissue block was oriented to give transverse images of the GOJ as the stage moves vertically in the Z direction. Illumination of the block was by two high frequency (40–70 kHz) TCSEL 18 W/Atco PC fluorescent tubes using PCA TCL ECO C18-24W dimmable electronic ballast (TridonicAtco GmbH & Co KG, Dornbirn, Austria).
The system (movement of stage, digital camera, and the ultramill) was controlled using customized imaging software (Sands et al., 2005) written using the Lab-VIEW™ programming language on a personal computer [Pentium IV, 1.8 GHz, 1 GB memory (Dell, Round Rock, TX) running Microsoft Windows 2000]. The software integrated the control of each item of equipment through a single-user interface. The software enabled image acquisition and milling to be controlled interactively or automatically and allowed the operator to process, reconstruct, and visualize the obtained images.
Milling, Staining, and Image Acquisition
The milled surface of the tissue block was stained with May–Grunwald stain to distinguish the different histological layers through the wall of the tissue specimen. The choice of stain was based on the stain’s chromatic ability to be used for surface staining to distinguish between muscle layers (green) and connective tissue (pink/purple) in the shortest time possible (few seconds). This allowed us to obtain an image of the top-stained surface, which was differentiated from the remaining intact tissue beneath the stained surface.
At each step, the upper surface of the mounted tissue block, perpendicular to the digital camera, was manually etched and stained using the process outlined in Table 1. Care was taken to maintain a consistent application and even spreading of the solutions at each staining step. Light paraffin oil (RI =1.4666, Hansen & Rosenthal KG, Hamburg, Germany) followed by a 1-mm glass plate was applied to the surface before imaging to improve image quality.
Table 1.
The Method Used for Manual Staining of the Wax-Embedded Tissue Block
| Solution | Purpose | Time (s) |
|---|---|---|
| 25% xylol in 100% of ethanol | To etch surface for staining | 10 |
| 100% ethanol | Wash-off etchant | 5 |
| Tap water | Wash-off ethanol | 5 |
| May–Grunwald stain (4% in methanol) | To distinguish between muscle layers (green) and connective tissue (pink/purple) | 20 |
| NH4 water (five drops of ammonia+distilled water) | Ammonia intensifies stain | 5 |
| Air jet | Dry surface | 5 |
| Oil and 1-mm glass cover plate | To obtain a sharper image | 10 |
| Total time for staining each ‘image slice’ | 60 |
Once imaged, the stained surface was then removed by the ultramill. The milling, staining, and imaging cycle were then repeated at 50 μm in the Z direction throughout the tissue block. The average time taken to process the surface of the tissue block (stain, image, and mill) at each 50 μm step was ~5 min. Because of the large size of the tissue block, to capture the entire X–Y (in-plane in relation to the stage) surface of the sample, the system was set up to capture nine subimages within a 3 × 3 matrix. Each subimage covered a 28 mm × 19 mm field of view and overlapped its neighbors by ~5 mm in X and Y. The subimages were acquired in RAW format, transferred to the control computer, and stored in an indexed file structure. Individual subimages were first background-corrected (McNally et al., 1999) to compensate for the small intensity variations arising from uneven illumination of the sample and then aligned and blended to create a single montage image for each Z-plane. The final stack of 650 montage images was cropped to enclose the tissue region, resulting in an image volume of 7,000 × 5,816 × 650 pixels (57.5 × 47.8 × 32.25 mm3).
Image Processing
Ten anatomical structures were traced out on each image using different combinations of color planes (Russ, 2002). Traced anatomical structures consisted of the epithelium, submucosa, circular muscle (CM), LM, POL, crura, lymph nodes, nerves, endo-thoracic fascia, and blood vessels. As a consequence of the manual staining procedure, a slight difference in the color contrast and intensity of the stained surfaces was observed between the images. This was accounted for by manual tracing of the affected areas of the images. Approximately half of the structures were manually traced, whereas the remaining half was traced semiautomatically using local thresholding. At each Z step, each segmented structure was saved in a separate PNG file. Each traced structure was identified using a specific index value and saved in an individual file.
The file size of each image was 18 MB and there were 650 images considered for processing. We therefore aimed at capturing the detailed microstructural information from the images while optimizing the time to process the images. Hence, an initial assessment of the variation in the size and orientation of the muscle fibers between images was carried out. We concluded that the changes in the muscle fiber orientations would be retained by reducing the resolution of the images considered for tracing to 3,500 × 2,908 pixels (7 MB each), and using every fifth image (250 μm Z step).
Three-Dimensional Reconstruction
The traced images were then assembled and stacked using software developed at The University of Auckland (http://www.cmiss.org/), and this allowed the presentation of the microstructural information in three-dimensions. The alignment and assembly of images were carried out on a personal computer (Pentium D, 3.2 GHz, 2 GB memory running Linux). The software package allows the three-dimensional texture to be interactively rotated and viewed in different orientations. Because of the limitation of memory in the graphics card, the resolution of each image was reduced further to 400 × 400 pixels for visualization.
The software used the unique index value associated with each traced structure to provide the flexibility of viewing the structures interactively. This meant that it was possible to add or remove structures. In addition, it was possible to view the structures in their original texture or by using artificial color assigned to the index value to highlight the structure.
Anatomical Measurements
To examine the existence of an anatomical sphincter in the tissue, the cross-sectional area and wall thickness of each muscle layer (CM and LM layers) were calculated throughout the tissue block using the segmented images. The thickness was calculated at one degree intervals around the circumference of the GOJ on each segmented image. The thickness of the CM, LM, and both layers combined were averaged over the segmented images of the tissue block.
RESULTS
The milling and imaging of the GOJ block (75 × 75 × 55 mm3) produced 650 images in 50 μm steps. The time taken to image, stain, and mill the tissue block was almost 100 hr. The imaging data required 75 gigabytes of hard disc space. The resolution for each section was 8.2 μm/pixel, and the size of each montaged image was 7,000 × 5816 pixels in the XY plane. Figure 2a, 2b, and 2c are examples of the montaged images with the overlaps removed. The montaged image provided a view of the upper surface of the tissue. The connective tissue through and around the tissue was shown in purple/pink, whereas the different muscle layers through the wall of the tissue were shown in green. Figure 2a is at a level above the diaphragmatic hiatus, with the diaphragm to the left and in front of the lower mediastinal oesophagus. Also clearly evident is the well-defined endo-abdominal fascia and the endo-thoracic fascia, with the diaphragmatic muscle sandwiched between these fascial layers. The peri-oesophageal lymph nodes are seen within the fibro-fatty tissue of the oesophageal mesentery. The vagal fibers are evident as anterior and posterior trunks. The adventitia, longitudinal, circular, submucosa, and epithelial layers are all seen as distinct layers. The separation of the submucosa from the subjacent CM of the oesophagus seen in Figure 2b is an artefact introduced at some stage during the handling of the tissue between the times of extraction to the time of imaging. The thickening of the diaphragm can be seen at the upper reaches on the left hand side.
Figure 2.
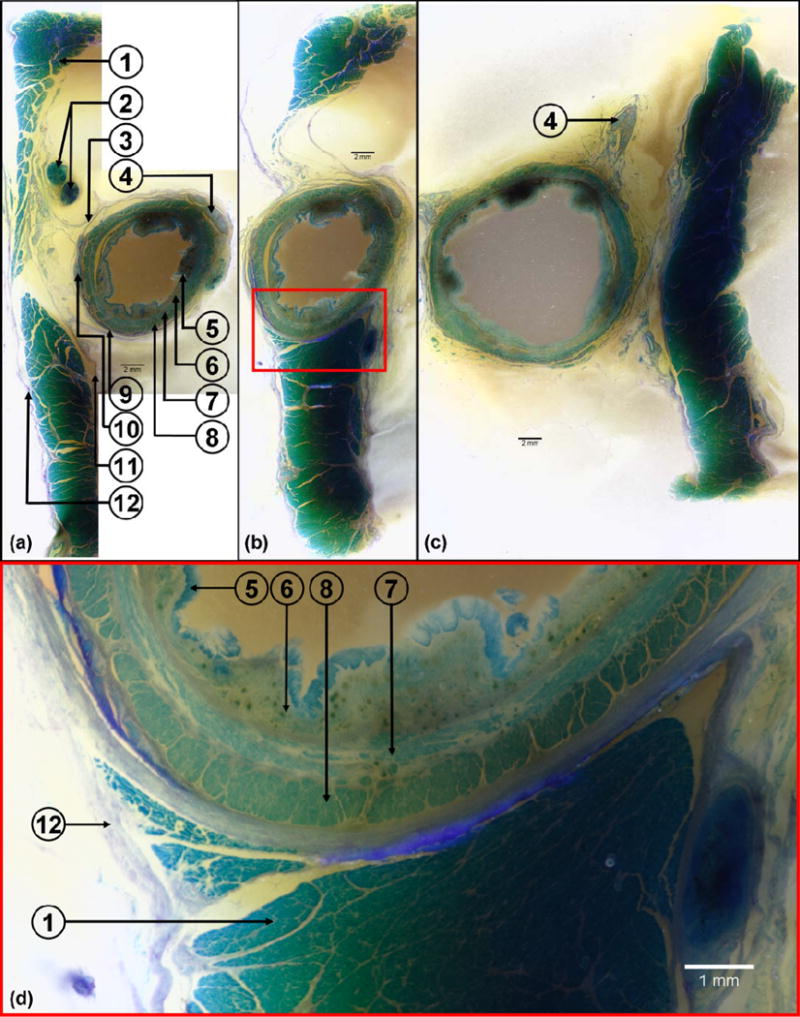
Cropped images showing the cross-section of the oesophagus and the diaphragmatic crura at (a) above the oesophageal hiatus (b) through the upper oesophageal hiatus and (c) through the lower oesophageal hiatus. The section bordered in red in image (b) is enlarged in (d) to illustrate the high resolution of the images obtained in this study. Muscle layers are shown in green while connective tissue is pink/purple in color. The numbers shown on the images refer to the following structures: (1) muscular diaphragm, (2) peri-oesophageal lymph nodes, (3) mesentery of the oesophagus, (4) posterior vagal nerve trunk, (5) mucosa, (6) submucosa, (7) circular muscle, (8) longitudinal muscle, (9) adventitia, (10) anterior vagal nerve fibers, (11) endo-thoracic fascia, and (12) endo-abdominal fascia.
Ten anatomical structures were traced using different color planes, Figure 3 illustrates an example of a section with the traced structures. The traced structures from the images were then assembled and stacked to provide a three-dimensional representation of the GOJ. Figure 4a shows the three-dimensional stack of the traced structures in their original texture colors. The total height of the tissue block was 32.25 mm. The software allowed the tissue block to be rotated and viewed in different orientations in three-dimensions. Figure 4b shows the structures of the tissue block using artificial colors.
Figure 3.
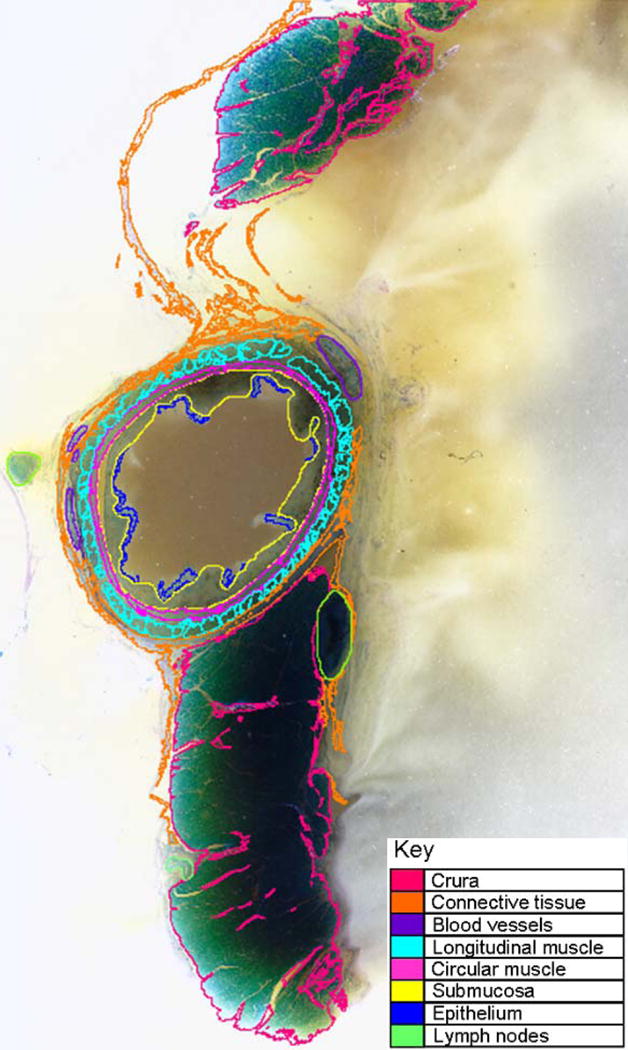
Cross-sectional image showing segmented structures. Different colors were used to distinguish the segmented structures; connective tissue (orange), crura (light purple), lymph nodes (green), blood vessels (purple), longitudinal muscle (light blue), circular muscle (pink), submucosa (yellow), and epithelium (dark blue).
Figure 4.
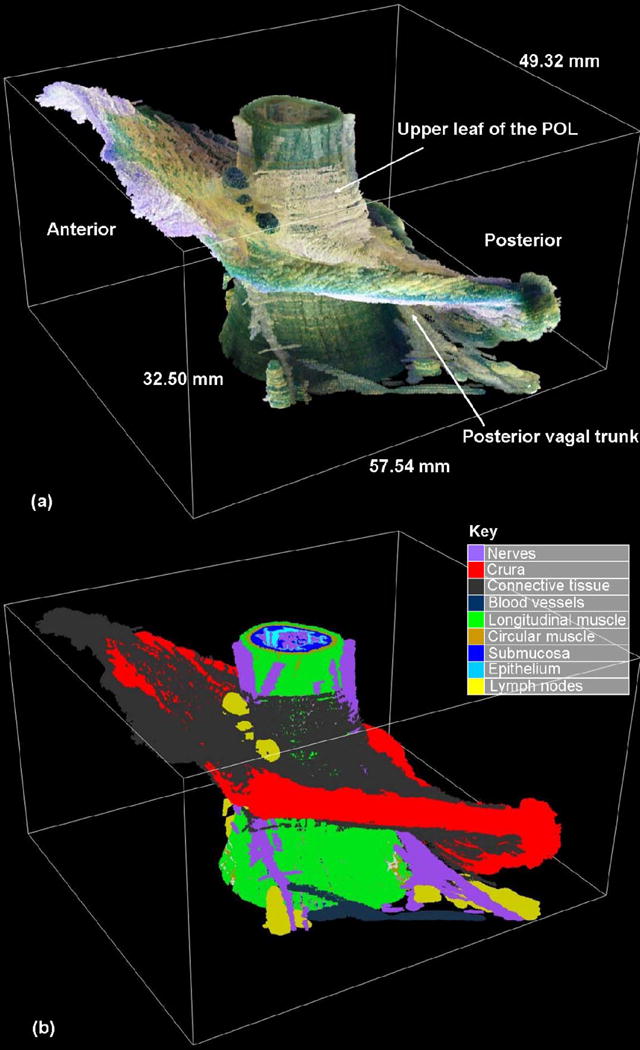
High-resolution microstructural information of the gastro-oesophageal junction in three-dimensions. a: The three-dimensional tissue block in its original texture color showing the gastro-oesophageal junction in relation to the crura and the connective tissue. b: Artificial colors were used to provide an easier method of distinguishing between the different structures of the three-dimensional tissue block.
The use of artificial colors provided a clearer visualization of the different structures within the tissue block. The two muscular layers were clearly displayed as the outer LM layer and the inner CM layer. Because of the current requirements to down sample the data for interactive visualization purposes, the muscle fibers were only partially visible in the current three-dimensional reconstruction. With the continued improvement of computer graphics cards, it will be possible to view the muscle fiber orientation at higher resolutions. The submucosa and mucosal layers were also apparent. The transition from the squamous epithelium in the oesophagus to the columnar epithelium could be identified, although at different levels. The change in the epithelium occurred more distally in the left anterior side as shown in Figure 5.
Figure 5.
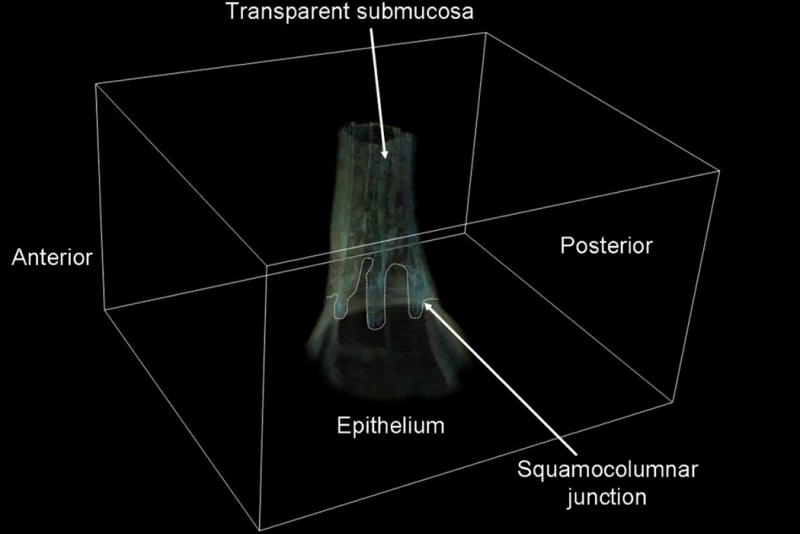
The inner layer of the three-dimensional model, with muscle and submucosal layers stripped away, to demonstrate an accurate rendering of the squamocolumnar junction.
In addition to the main structures (i.e., muscular layers, squamocolumnar junction, crura, and connective tissue), structures surrounding the GOJ were also traced. Structures such as blood vessels, nerves, and lymph nodes were traced from the images. The posterior vagal trunk ran posteriorly and was not attached to the oesophageal wall. The oesophageal branch of the left gastric artery ran toward the right lateral side of the oesophageal wall.
The connective tissue (including the POL) extended from the diaphragm to the wall of the oesophagus. Some difficulties were experienced during the manual tracing of the connective tissue, and particularly the POL, due to its diaphanous nature and the way it is derived by the coalescence of the endo-thoracic and endo-abdominal fasciae which then splits into upper and lower leaves. Our results show that the upper leaf is longer and more prominent than the lower leaf. The fibers of the leaves then penetrate into the wall of the oesophagus to insert into the submucosal layer, which is consistent with what has been reported by Kwok et al. (1999). The point of attachment of the POL to the oesophagus extended to the upper end of the sample (32.25 mm in length), from the proximal point of the upper leaf to the distal point of the lower leaf, which is within the range reported in the literature (Kwok et al., 1999; Apaydin et al., 2008b). Figure 6 shows a coronal view of the tissue sample illustrating the leaves of the POL. The figure was reconstructed by stacking the high-resolution axial images and resampling them in the coronal plane.
Figure 6.
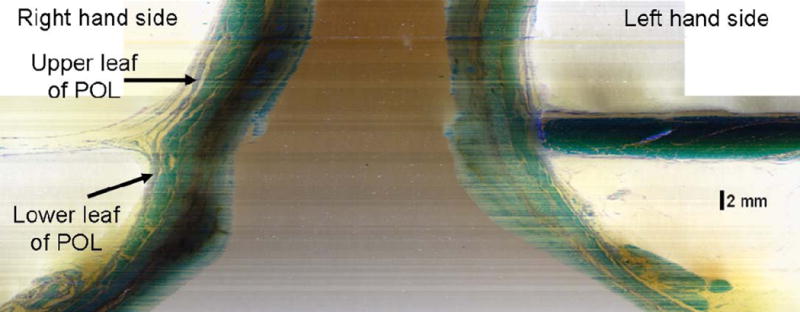
An anterior view onto the coronal plane of the tissue sample illustrating the extension of the POL (phreno-oesophageal ligament) from the diaphragm to the oesophagus. The POL is then divided into a prominent upper leaf and lower leaf. The fibers of the leaves extend and penetrate the wall of the oesophagus at different levels and unite with the fascial covering of the muscular wall of the oesophagus.
An interactive three-dimensional model of the tissue block can be viewed from http://www.bioeng.auckland.ac.nz/goj3danatomy, which allows rotation, enlarging, and viewing of the different structures individually.
Anatomical Measurements
The average cross-sectional area for the CM, LM, and both layers combined over the tissue block was found to be 15.68 ± 6.46 mm2, 14.32 ± 2.13 mm2, and 30.00 ± 6.36 mm2, respectively. The overall muscle thicknesses were found to be 0.40 ± 0.07 mm (CM), 0.38 ± 0.09 mm (LM), and 0.78 ± 0.09 mm (total) over the three-dimensional tissue block. A slight increase in the thickness of the CM layer (~0.1 mm) was observed distally where the CM muscle fibers also changed orientation as seen in Figure 7. This change in fiber orientation was observed ~20 mm from the top of the tissue block, around the squamocolumnar junction. This change in fiber orientation occurred in two regions; toward the right posteriorly and toward the left anteriorly.
Figure 7.
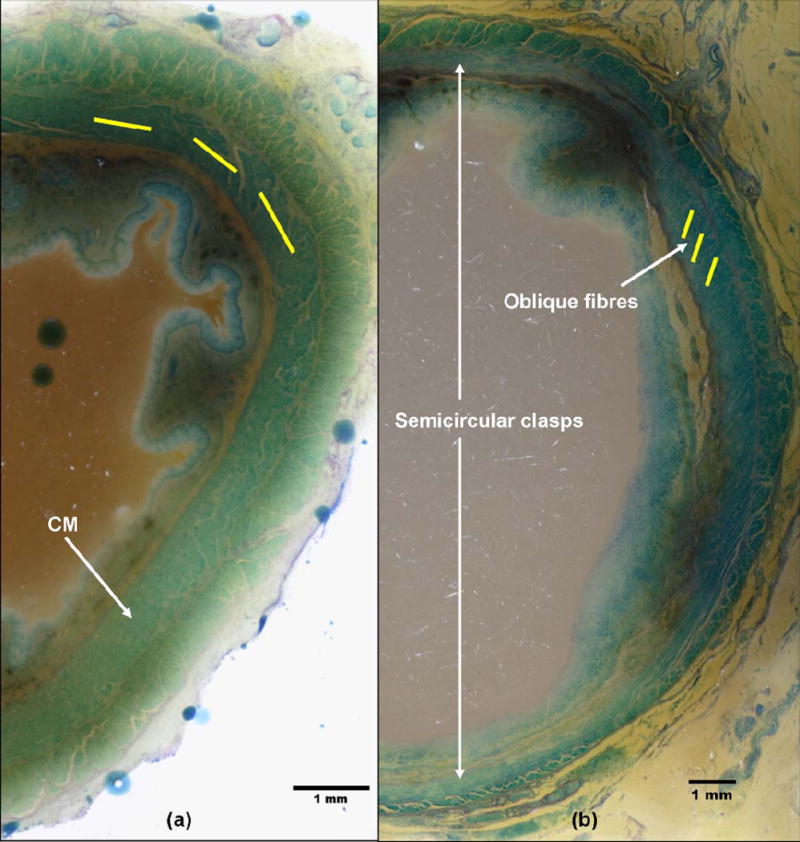
A change in the fiber direction of the CM (circular muscle) layer was observed at the squamocolumnar junction. The change in the fiber direction of the CM layer can be clearly seen as the circular fibers change into an oblique orientation. The CM layer is semicircular and incomplete anteriorly and posteriorly in the intra-abdominal region (b) compared to the intrathoracic region (a).
DISCUSSION
The definition and description of the GOJ varies and depends on the author’s perspective. The endoscopist sees the GOJ as narrowing of the lower oesophagus due to indentation by the diaphragm, and the pathologist takes note of the squamocolumnar junction, recognizing that this will alter in the presence of metaplasia. The GOJ to the physiologist is the higher pressure zone mapped by manometry, and generated by the diaphragm, the intrinsic tone of the lower oesophageal sphincter region and positive intra-abdominal pressure. The gross anatomist notes the angle of His and the transition from the tubular abdominal oesophagus to the flared gastric cardia. There has been a previous study seeking to define the microanatomy of the GOJ, including muscle fiber orientation. Liebermann-Meffert et al. (1979) used standard histology methods on tissues dissected from formalin-fixed cadavers. The aim of this study was to create a high-resolution three-dimensional reconstruction of the microanatomy of the GOJ from tissue derived from a recently deceased subject during postmortem examination. This is possible because of the novel micro-milling and selective staining technique that was originally developed for a similar study on the heart (Gerneke et al., 2007). This approach is an important part of our research toward providing an integrated and interactive model of anatomy and physiology of the human body and is best understood within the broader context of the Physiome project (Hunter and Borg, 2003).
The development of a high-resolution three-dimensional reconstruction of the GOJ has several potential applications. The anatomical model, as presented in this work, can be adapted to provide a useful tool for health professional training and patient education. The sequential removal of the layers during the slow rotation of the three-dimensional model enables understanding of the different elements of the GOJ and their relationships [1]. This can be further enhanced by selective coloring and labeling of the elements within the animation.
The authors are aware of the limitations associated with suspending the tissue in a cage, which may lead to some distortion in the arrangement of the GOJ in relation to surrounding anatomical structures. Care was taken by the upper GI surgeon to minimize the distortions of the suspended tissue and to retain its accurate in vivo position. An improved approach would involve inserting fiducial markers (e.g., pins) onto the GOJ in situ to identify the anterior, posterior, and superior positions and then obtain in vivo anatomical images via CT or MR scanning prior to the postmortem examination. These images with the markers could then be used to reposition the extracted tissue sample more accurately. However, it was not possible to scan the cadaver because of constraints imposed by the time taken to obtain consent and the limited time the body was available for the study. Access to the body after the postmortem examination was only available for a few minutes, therefore the use of the clinical scanners on the recently deceased person prior to post-mortem examination was not possible. Another limitation of the study is the resolution of the images for the three-dimensional reconstruction. Continued developments in the capabilities of computer graphics cards may allow the ability to reconstruct the microanatomy of the GOJ in three dimensions at full resolution. Using the high-resolution images will permit clearer visualization of the muscle fibers when reconstructed in three dimensions.
The existence of an anatomical sphincter in the GOJ has been controversial (Mosher, 1930; Bombeck et al., 1966; Liebermann-Meffert and Brauer, 1995;Apaydin et al., 2008a). The findings in this study showed that the cross-sectional area of the muscle layers and the inner radius at the upper surface of the tissue block was consistent with the measurements obtained by Mittal et al. (2006) and Nicosia et al. (2001). The average muscle thickness obtained in this study was ~60% less than the thickness reported by Pehlivanov et al. (2001) and Liu et al. (1997). This difference could be due to many reasons, in particular, the shrinkage caused by the fixation, dehydration, and wax embedding of the tissue sample (shrinkage was estimated to range between 15 and 41%). Additional reduction in size of the tissue might have resulted during the excision of the tissue. Because of the limitations of the research protocol presented in this study, measurements of the tissue in vivo could not be carried out, preventing an accurate calculation of the tissue shrinkage after excision.
The change in the orientation of the CM layer observed in this tissue block has also been found by Liebermann-Meffert et al. (1979) using a total of 32 human specimens with ages ranging between 18 and 89 years. The CM layer has been described by Liebermann-Meffert and colleagues as incomplete at the level of the GOJ with a semicircular disposition of the fibers, which are open at the anterior and posterior regions of the oesophageal wall. The authors also found oblique fibers known as Laimer’s bracket fibers in the internal layer of the oesophagus. The functional significance of these fibers, when contracted, is to increase the acuteness of the angle of His, and increase the antireflux mechanism. This change in the CM layer was also observed in our tissue block in two regions: toward the right posterior and left anterior directions. The tissue also showed traceable but minor thickening (0.1 mm) in these two regions, which is not expected to be visible to the naked eye during anatomical dissections of the human cadaver. Similar observations have been reported in literature where a region of maximum muscle thickness around the GOJ was observed by Liebermann-Meffert et al. (1979) and labeled the gastro-oesophageal ring.
The future application and the subject of a subsequent study is the use of the high-resolution three-dimensional model of the GOJ to simulate a normal physiological event with the aid of mathematical modeling. The anatomical information obtained from this study will be used to construct an anatomically realistic three-dimensional computer model of the GOJ. The physiology of this region will be modeled by incorporating mathematical equations into the three-dimensional computer model. This will allow the integration of anatomy and physiology into a single model illustrating their co-dependence. A preliminary anatomically realistic three-dimensional computer model has been constructed to study the relationship between the anatomy and physiology of the GOJ (Yassi et al., 2009). In addition to modeling normal physiological events (including oesophageal peristalsis, swallowing induced relaxation of the lower oesophageal sphincter, and transient lower oesophageal sphincter relaxation in response to distension of the stomach cardia), it is also possible to model abnormal physiology. Obvious clinical examples include gastro-oesophageal reflux disease with or without a sliding hiatus hernia and achalasia. A further application for this approach would be to fit this model into individual patient-specific anatomic data, such as CT or MR images, and physiologic data, such as manometry recordings, from clinical investigations into the animated three-dimensional model. Although this would have obvious interest for the patient and treating doctor, it also opens up the possibility of designing customized treatments for individual patients and predicting the outcomes. Such patient-specific modeling could open up an opportunity to custom design aspects of an operation to interrogate the relative contributions of an anatomical repair and to even consider the additional effects of drug therapy. The development of this approach might also reduce the need for animal experimentation and clinical trials.
Acknowledgments
The authors acknowledge the assistance of the staff at the mortuary at Auckland City Hospital, in particular, Ms Rosalie Gow whose role it was to obtain informed consent. The authors thank the Gross Anatomy Laboratory, particularly, Mr Peter Cook and the Histology Laboratory, particularly, Ms Lorraine Rolston at the Faculty of Medical and Health Sciences at The University of Auckland. The authors extend their appreciation to Dr Phil Blyth and Mr Shane Blackett for their assistance with this work.
Grant sponsor: Royal Society of NZ Marsden and NIH; Grant number: R01 DK64775.
Footnotes
The sequential removal of the different layers is illustrated with the movie (goj_human.mpeg) supplied with this manuscript.
References
- 1.Apaydin N, Uz A, Elhan A, Loukas M, Tubbs RS. Does an anatomical sphincter exist in the distal esophagus? Surg Radiol Anat. 2008a;30:11–16. doi: 10.1007/s00276-007-0276-3. [DOI] [PubMed] [Google Scholar]
- 2.Apaydin N, Uz A, Evirgen O, Loukas M, Tubbs RS, Elhan A. The phrenico-esophageal ligament: An anatomical study. Surg Radiol Anat. 2008b;30:29–36. doi: 10.1007/s00276-007-0279-0. [DOI] [PubMed] [Google Scholar]
- 3.Bombeck CT, Dillard DH, Nyhus LM. Muscular anatomy of the gastroesophageal junction and role of phrenoesophageal ligament; autopsy study of sphincter mechanism. Ann Surg. 1966;164:643–654. doi: 10.1097/00000658-196610000-00011. [DOI] [PMC free article] [PubMed] [Google Scholar]
- 4.Botha GS. Mucosal folds at the cardia as a component of the gastro-oesophageal closing mechanism. Br J Surg. 1958;45:569–580. doi: 10.1002/bjs.18004519402. [DOI] [PubMed] [Google Scholar]
- 5.Bremner CG, Schlegel JF, Ellis FH., Jr Studies of the “gastroesophageal sphincter mechanism”: The role of the phrenoesophageal membrane. Surgery. 1970;67:735–740. [PubMed] [Google Scholar]
- 6.Castell DO, Richter JE. The Esophagus. 4. Philadelphia: Lippincott Williams and Wilkins; 2004. p. 714. [Google Scholar]
- 7.Curci JA, Melman LM, Thompson RW, Soper NJ, Matthews BD. Elastic fiber depletion in the supporting ligaments of the gastroesophageal junction: A structural basis for the development of hiatal hernia. J Am Coll Surg. 2008;207:191–196. doi: 10.1016/j.jamcollsurg.2008.02.036. [DOI] [PubMed] [Google Scholar]
- 8.Daniels BT. The phrenoesophageal membrane. Am J Surg. 1965;110:814–817. doi: 10.1016/0002-9610(65)90130-3. [DOI] [PubMed] [Google Scholar]; Davis ED. The anatomy and physiology of the cardiac end of the oesophagus applied to hiatus hernia and achalasia. J Laryngol Otol. 1953;67:139–152. doi: 10.1017/s002221510004843x. [DOI] [PubMed] [Google Scholar]
- 9.Gerneke DA, Sands GB, Ganesalingam R, Joshi P, Caldwell BJ, Smaill BH, Legrice IJ. Surface imaging microscopy using an ultramiller for large volume 3D reconstruction of wax- and resin-embedded tissues. Microsc Res Tech. 2007;70:886–894. doi: 10.1002/jemt.20491. [DOI] [PubMed] [Google Scholar]
- 10.Hunter PJ, Borg TK. Integration from proteins to organs: The Physiome Project. Nat Rev Mol Cell Biol. 2003;4:237–243. doi: 10.1038/nrm1054. [DOI] [PubMed] [Google Scholar]
- 11.Kahrilas PJ. Anatomy and physiology of the gastroesophageal junction. Gastroenterol Clin North Am. 1997;26:467–486. doi: 10.1016/s0889-8553(05)70307-1. [DOI] [PubMed] [Google Scholar]
- 12.Kwok H, Marriz Y, Al-Ali S, Windsor JA. Phrenoesophageal ligament re-visited. Clin Anat. 1999;12:164–170. doi: 10.1002/(SICI)1098-2353(1999)12:3<164::AID-CA4>3.0.CO;2-N. [DOI] [PubMed] [Google Scholar]
- 13.Law SY, Wong J. Esophagogastrectomy for carcinoma of the esophagus and gastric cardia, and the esophageal anastomosis. In: Fischer JE, editor. Mastery of Surgery. 5. New York: Lippincott Williams & Wilkins; 2007. pp. 752–770. [Google Scholar]
- 14.Liebermann-Meffert D, Allgöwer M, Schmid P, Blum AL. Muscular equivalent of the lower esophageal sphincter. Gastroenterology. 1979;76:31–38. [PubMed] [Google Scholar]
- 15.Liebermann-Meffert D, Brauer RB. Surgery of the Esophagus, Stomach, and Small Intestine: Surgical Anatomy of the Distal Esophagus and Cardia. 5. Boston: Little, Brown and Company; 1995. pp. 32–44. [Google Scholar]
- 16.Liu J, Parashar VK, Mittal RK. Asymmetry of lower esophageal sphincter pressure: Is it related to the muscle thickness or its shape? Am J Physiol. 1997;272:G1509–G1517. doi: 10.1152/ajpgi.1997.272.6.G1509. [DOI] [PubMed] [Google Scholar]
- 17.McNally JG, Karpova T, Cooper J, Conchello JA. Three-dimensional imaging by deconvolution microscopy. Methods. 1999;19:373–385. doi: 10.1006/meth.1999.0873. [DOI] [PubMed] [Google Scholar]
- 18.Mittal RK, Padda B, Bhalla V, Bhargava V, Liu J. Synchrony between circular and longitudinal muscle contractions during peristalsis in normal subjects. Am J Physiol Gastrointest Liver Physiol. 2006;290:G431–G438. doi: 10.1152/ajpgi.00237.2005. [DOI] [PubMed] [Google Scholar]
- 19.Mosher HP. The lower end of the oesophagus at birth and in the adult. J Laryngol Otol. 1930;45:161–180. [Google Scholar]
- 20.Nicosia MA, Brasseur JG, Liu JB, Miller LS. Local longitudinal muscle shortening of the human esophagus from high-frequency ultrasonography. Am J Physiol Gastrointest Liver Physiol. 2001;281:G1022–G1033. doi: 10.1152/ajpgi.2001.281.4.G1022. [DOI] [PubMed] [Google Scholar]
- 21.Nussbaum MS. Minimally invasive treatment of achalasia and their esophageal dysmotility. In: Fischer JE, editor. Mastery of Surgery. 5. New York: Lippincott Williams & Wilkins; 2007. pp. 742–751. [Google Scholar]
- 22.Park YS, Park HJ, Kang GH, Kim CJ, Chi JG. History of gastroesophageal junction in fetal and pediatric autopsy. Arch Pathol Lab Med. 2003;127:451–455. doi: 10.5858/2003-127-0451-HOGJIF. [DOI] [PubMed] [Google Scholar]
- 23.Pehlivanov N, Liu J, Kassab GS, Puckett JL, Mittal RK. Relationship between esophageal muscle thickness and intraluminal pressure: An ultrasonographic study. Am J Physiol Gastrointest Liver Physiol. 2001;280:G1093–G1098. doi: 10.1152/ajpgi.2001.280.6.G1093. [DOI] [PubMed] [Google Scholar]
- 24.Peters PM. Closure mechanisms at the cardia with special reference to the diaphragmatico-oesophageal elastic ligament. Thorax. 1955;10:27–36. doi: 10.1136/thx.10.1.27. [DOI] [PMC free article] [PubMed] [Google Scholar]; Russ JC. The Image Processing Handbook. 4. United States of America: CRC Press; 2002. p. 732. [Google Scholar]
- 25.Sands GB, Gerneke DA, Hooks DA, Green CR, Smaill BH, Legrice IJ. Automated imaging of extended tissue volumes using confocal microscopy. Microsc Res Tech. 2005;67:227–239. doi: 10.1002/jemt.20200. [DOI] [PubMed] [Google Scholar]
- 26.Skandalakis LJ, Colborn GL, Skandalakis JE. Surgical anatomy of the diaphragm. In: Nyhus LM, Baker RJ, Fischer JE, editors. Mastery of Surgery. 3. United States of America: Little, Brown and Company; 1997. pp. 649–670. [Google Scholar]
- 27.Yassi R, Cheng LK, Gerneke D, Al-Ali S, Sands GB, LeGrice I, Windsor JA, Pullan AJ. The integration of conformational microanatomy and physiology of the gastroesophageal junction in a 3D computational model; Proceedings of the DDW Chicago, IL, USA; May 14–19, 2005; 2005. Abstract number: T1655, Digestive Disease Week. [Google Scholar]
- 28.Yassi R, Cheng LK, Rajagopal V, Nash MP, Windsor JA, Pullan AJ. Modeling of the mechanical function of the human gastroesophageal junction using an anatomically realistic three-dimensional model. J Biomech. 2009;42:1604–1609. doi: 10.1016/j.jbiomech.2009.04.041. [DOI] [PMC free article] [PubMed] [Google Scholar]