

Abstract
Objectives
Soluble CD14 (sCD14) is a monocyte activation marker associated with increased mortality in HIV. We assessed 48-week changes in sCD14 and other inflammatory biomarkers in virologically suppressed, HIV-infected women switching to raltegravir (RAL) from PI or NNRTI.
Methods
HIV-infected women with central adiposity and HIV-1 RNA <50 copies/mL continued their thymidine-sparing NRTI backbone and were randomized to switch to open-label RAL at week 0 (immediate) or 24 (delayed). In an exploratory analysis, inflammatory biomarkers were measured on stored fasting plasma.
Results
Thirty-seven evaluable subjects were 78% non-White and had median age 43 years, BMI 32 kg/m2 and CD4+ T cell count 558 cells/µL. At baseline, biomarker values were similar between groups. After 24 weeks, median sCD14 significantly declined in subjects switching to RAL (−21% (p<0.001) vs. PI/NNRTI −5% (p=0.49), between group p<0.01). After 48 weeks, immediate switch subjects maintained this decline and delayed switch subjects experienced a similar decline following switch to RAL (−10%, within-group p<0.01). Immediate switch subjects also experienced an initial increase in TNF-α that was neither maintained after 48 weeks nor seen in delayed switch subjects. After adjustment for multiple testing, only declines in sCD14 remained significant.
Conclusions
In this randomized trial of women with central adiposity, switch to RAL from PI or NNRTI was associated with a statistically significant decline in sCD14. Further studies are needed to determine whether integrase inhibitors have improved monocyte activation profiles compared to PIs and/or NNRTIs, and whether measured differences between antiretroviral agents translate to demonstrable clinical benefit.
Keywords: raltegravir, sCD14, monocyte activation, inflammation, women
INTRODUCTION
HIV infection is characterized by a state of inflammation and immune activation that may not normalize with suppressive antiretroviral therapy (ART),(1–5) and may contribute to the development of end-organ disease in HIV-infected persons. Recently, circulating markers of inflammation [including interleukin-6 (IL-6), high-sensitivity C-reactive protein (hs-CRP) and soluble CD14 (sCD14)] have been shown to predict all-cause mortality in HIV infection,(6–8) enhancing interest in biomarkers as predictors of morbidity and mortality in this patient population.
CD14 is a monocyte/macrophage surface marker that recognizes pathogen-associated molecular patterns and is a co-receptor for lipopolysaccharide.(9) CD14 may be membrane bound or exist as sCD14 when shed or secreted from activated monocytes/macrophages or secreted by hepatic Kupffer cells.(10, 11) sCD14 is elevated in the setting of HIV infection and does not normalize with ART initiation.(12–14) Similarly, significant declines in sCD14 have not previously been documented in virologically-suppressed patients switching or intensifying ART. The associations between higher sCD14 levels, increased all-cause mortality(7, 15, 16) and progression of HIV disease(15, 17) emphasize the need to both understand the mechanism of sCD14 elevation in HIV infection and determine whether interventions to normalize sCD14 levels/monocyte activation improve clinical outcomes.
Persistent immune activation in HIV-infected persons on ART may be the result of one or more stimuli such as concomitant infections and/or co-morbidities, enterocyte damage leading to microbial translocation, or medication-specific toxicities. Determining how sCD14 changes with other markers of monocyte activation, microbial translocation and inflammation [including soluble CD163 (sCD163), intestinal-type fatty acid binding protein (I-FABP), tumor necrosis factor-α (TNF-α) and soluble TNF receptor II (sTNF-RII)] could help define the mechanism driving changes in sCD14 following ART initiation or switch.
This analysis describes changes in biomarkers of inflammation, immune activation and microbial translocation in a 48-week trial of virologically-suppressed, HIV-infected women with central adiposity on protease inhibitor (PI)- or non-nucleoside reverse transcriptase inhibitor (NNRTI)-based ART who continued their thymidine-sparing nucleoside reverse transcriptase inhibitor (NRTI) backbone and were randomized to switch to raltegravir (RAL) immediately or after 24 weeks.
METHODS
Study design
Complete methods for the parent study have previously been published.(18) Briefly, HIV-infected women with central adiposity (defined as waist circumference >94 cm or waist-to-hip ratio >0.88) and HIV-1 RNA <50 copies/mL on a regimen of tenofovir or abacavir and emtricitabine or lamivudine plus a PI or NNRTI were randomized 1:1 to substitute PI or NNRTI for RAL 400 mg po bid at week 0 (immediate switch) or week 24 (delayed switch). Subjects randomized to delayed switch provided an internal control group of subjects on continued PI/NNRTI therapy for the first 24 weeks. During weeks 24–48, all subjects received RAL. The study was not blinded, as randomization required switching to RAL vs. continued standard of care.
Subjects were recruited from five centers in North America between September 2008 and July 2010. Inclusion criteria included: Age ≥18 years, documented HIV-1 infection, central adiposity, continuous virologic suppression since ART initiation and current HIV-1 RNA <50 copies/mL, current ART with a compatible NRTI backbone plus a PI or NNRTI (as above), no change in ART for ≥12 weeks prior to screening and ability and willingness to provide informed consent.
The parent study hypothesized that, in women experiencing central fat gain on PI/NNRTI, switch to a more metabolically neutral agent (RAL) might prevent ongoing fat gain or allow partial reversal of lipohypertrophy. As such, the study was powered to observe a ≥10% difference in computed tomography-quantified visceral fat between RAL- and PI/NNRTI-treated subjects over 24 weeks. While anticipated reductions in total and LDL cholesterol were observed in RAL-treated subjects, only a 5.4% between group difference in visceral fat was observed (RAL −3.6% visceral fat, PI/NNRTI +1.9%).(18)
A protocol-defined, exploratory analysis of changes in inflammatory biomarkers was performed on stored plasma samples. The institutional review boards/ethics committees of the participating institutions approved all study documents and procedures, and all subjects provided written informed consent prior to initiation of study procedures.
Assessments
Biomarker Assessments
Complete parent study assessments have previously been published.(18) For this analysis, blood for plasma isolation was obtained in EDTA tubes at weeks 0, 24 and 48 and centrifuged for 15 minutes at 2000 rpm's and 20–22 °C within 30 minutes of collection. Samples were stored at the sites in 1cc aliquots at −80 °C until the end of the study, when they were sent to the University of California, Los Angeles for sorting and cataloging prior to shipment to the Laboratory for Clinical Biochemistry Research at the University of Vermont, where all assays were performed under the supervision of Dr. Russell Tracy.
sCD14, sCD163, IL-6, sTNF-RII and soluble vascular cell adhesion molecule-1 (sVCAM-1) were measured via R&D Systems Human Quantikine® ELISA, TNF-α via Millipore Human Adipokine Panel B multiplex assay, I-FABP via R&D Systems Human FABP-2 DuoSet® ELISA, d-dimer via StagoSTA®-Liatest® assay, C-telopeptide (CTP) via Immunodiagnostic Systems (IDS) UniQ™ ICTP ELISA and pro-collagen type 1 N-terminal pro-peptide (P1NP) via IDS UniQ™P1NP radioimmunoassay. All assays had coefficients of variation of ten percent or less.
Statistical Analyses
Baseline characteristics were compared between treatment groups using the Mann-Whitney U test for continuous variables and the Fisher’s exact test for categorical variables. Median values and interquartile ranges (IQR) are reported for continuous variables, and percentages for categorical data.
Median, between group, 24-week change scores for all biomarkers were compared using the Wilcoxon sign-rank test. Additionally, 48-week change scores were calculated for the immediate switch group, and a pooled analysis of biomarker changes in the 24 weeks following switch to RAL was performed for all subjects. Spearman or Kendall tau rank correlation coefficients were calculated to assess relationships between 1) changes in biomarkers and 2) changes in biomarkers and clinical parameters. All analyses were as-treated, excluding subjects who did not remain on the study regimen and/or did not have an observed primary end point. A supplemental intent-to-treat analysis and analyses of log-transformed mean values were also performed and produced similar results (data not shown).
Sample size was determined by the parent study (n=37). All biomarker analyses were exploratory. However, 37 subjects provided 80% power to see a minimum between-group effect size of: sCD14 453.0 ng/mL, sCD163 372.0 ng/mL, I-FABP 1501.0 pg/mL, IL-6 13.0 pg/mL, d dimer 0.4 µg/mL, TNF-α 2.1 pg/mL, sTNF-RII 842.0 pg/mL, sVCAM-1 536.0 ng/mL, CTP 2.3 µg/L, and P1NP 43.0 µg/L. All statistical tests were two-sided with a nominal alpha level of 0.05. Analyses were exploratory and were performed with and without adjustment for multiple testing. Data analysis and management was performed using SAS 9.2 or 9.3 (SAS Institute, Inc., Cary, NC).
RESULTS
Patient population
Sixty-one subjects screened and 39 enrolled. Eighteen subjects were randomized to immediate switch, and 21 to delayed switch. Thirty-seven subjects completed the week 24 primary endpoint, and 36 completed the week 48 endpoint. No study withdrawals were RAL-related. Complete demographic and baseline clinical characteristics of the 37 participants included in the as-treated analysis are provided in Table 1. At baseline, randomization groups were well balanced, although the delayed switch group had a higher rate of current tobacco use (24% vs. 58%). The median age was 43 years, BMI 32 kg/m2, and 75% of subjects self-identified as Black or Hispanic. Sixty-two percent of subjects were on a PI at entry (vs. 38% NNRTI), and the most commonly reported NRTIs were tenofovir (78%) and emtricitabine (68%).
Table 1.
Baseline Demographic and Clinical Characteristicsa
| Immediate | Delayed | Overall | |
|---|---|---|---|
| Ethnicity | n=17 | n=20 | n=37 |
| African American | 53% | 65% | 59% |
| Hispanic | 23% | 10% | 16% |
| White | 18% | 25% | 22% |
| Asian | 6% | 0% | 3% |
| Age (years) | 41 (39, 47) | 46 (36, 51) | 43 (37, 49) |
| BMI (kg/m2) | 34.7 (28.8, 37.6) | 30.4 (27.7, 35.4) | 32.0 (28.0, 36.5) |
| Tobacco use (current)b | 24% | 60% | 43% |
| CD4 count (cells/µL) | 563 (447, 747) | 554 (354, 770) | 558 (422, 747) |
| Time on ART (years) | 5.1 (3.1, 7.1) | 2.7 (1.6, 6.3) | 3.7 (2.4, 7.1) |
| PI | n=11 (65%) | n=12 (60%) | n=23 (62%) |
| Atazanavir/ritonavir | 35% | 30% | 32% |
| Atazanavir | 6% | 15% | 11% |
| Fosamprenavir/ritonavir | 0% | 5% | 3% |
| Fosamprenavir | 0% | 5% | 3% |
| Lopinavir/ritonavir | 18% | 5% | 11% |
| Nelfinavir | 6% | 0% | 3% |
| NNRTI | n=6 (35%) | n=8 (40%) | n=14 (38%) |
| Efavirenz | 18% | 30% | 24% |
| Etravirine | 6% | 0% | 3% |
| Nevirapine | 12% | 10% | 11% |
| NRTI | n=17 (100%) | n=20 (100%) | n=37 (100%) |
| Abacavir | 18% | 25% | 22% |
| Lamivudine | 29% | 35% | 32% |
| Emtricitabine | 71% | 65% | 68% |
| Tenofovir | 82% | 75% | 78% |
| Waist circumference (cm) | 106.0 (102.0, 121.0) | 102.4 (99.2, 113.0) | 105.5 (99.5, 118.0) |
| Hip circumference (cm) | 117.5 (102.1, 127.0) | 106.5 (102.2, 124.4) | 115.5 (102.1, 127.0) |
| Waist:hip ratio | 0.96 (0.90, 0.99) | 0.97 (0.93, 1.02) | 0.96 (0.92, 1.00) |
| Glucose (mg/dL) | 84.0 (78.0, 93.0) | 88.5 (80.0, 97.5) | 87.0 (78.0, 94.0) |
| Total cholesterol (mg/dL) | 179.0 (162.0, 206.0) | 199.0 (164.5, 221.5) | 188.0 (162.0, 214.0) |
| Triglycerides (mg/dL) | 116.0 (85.0, 144.0) | 129.0 (101.0, 176.0) | 118.0 (92.0, 152.0) |
| LDL (mg/dL) | 113.0 (103.0, 123.0) | 116 (89.0, 138.1) | 115.8 (93.0, 128.0) |
| HDL (mg/dL) | 47.6 (40.2, 57.0) | 49.1 (39.0, 55.0) | 49.0 (40.0, 57.0) |
| hs-CRP (mg/dL) | 2.7 (0.6, 6.0) | 4.7 (0.8, 7.5) | 3.2 (0.6, 6.5) |
| Diabetesc | 0% | 0% | 0% |
| Hyperlipidemiac | 18% | 25% | 22% |
Percent or median with interquartile range. Mann-Whitney U or Fisher's exact tests used to test statistical significance for continuous and categorical variables, respectively.
p=0.05. Otherwise, no statistically significant association between-arm differences.
Defined as self-reported diagnosis or on-therapy at baseline.
BMI, body mass index; ART, antiretroviral therapy; PI, protease inhibitor; NNRTI, non-nucleoside reverse transcriptase inhibitor; NRTI, nucleoside reverse transcriptase inhibitor; LDL, low-density lipoprotein cholesterol; HDL, high-density lipoprotein cholesterol.
Baseline Biomarker Characteristics
At baseline, no significant differences in median sCD14, sCD163, I-FABP, IL-6, d-dimer, TNF-α, sTNF-RII, sVCAM-1, CTP or P1NP were observed between subjects randomized to the immediate vs. delayed switch arms (Table 2).
Table 2.
Median (IQR) Baseline Biomarker Distributions
| Immediate | Delayed | Overall | Between Group p value |
|
|---|---|---|---|---|
| N | 17 | 20 | 37 | |
| sCD14 (ng/mL) | 2175.7 (1940.1, 2403.9) | 2170.9 (1958.7, 2444.8) | 2175.7 (1948.1, 2432.6) | 0.62 |
| sCD163 (ng/mL) | 629.0 (405.1, 723.4) | 606.1 (514.7, 753.0) | 613.2 (480.3, 749.6) | 0.49 |
| I-FABP (pg/mL) | 1840.0 (1224.0, 2163.9) | 1755.7 (1288.7, 2245.7) | 1793.7 (1224.0, 2195.1) | 0.87 |
| IL-6 (pg/mL) | 3.8 (2.3, 6.1) | 3.8 (3.1, 6.9) | 3.8 (2.6, 6.6) | 0.81 |
| D dimer (µg/mL) | 0.3 (0.1, 0.3) | 0.2 (0.1, 0.4) | 0.3 (0.1, 0.4) | 0.68 |
| TNF-α (pg/mL) | 4.3 (3.6, 5.5) | 5.2 (4.1, 7.4) | 4.7 (3.7, 6.2) | 0.12 |
| sTNF-RII (pg/mL) | 2862.2 (2543.0, 3669.7) | 3149.4 (2739.5, 3432.7) | 3067.6 (2690.3, 3542.0) | 0.34 |
| sVCAM-1 (ng/mL) | 870.2 (644.8, 938.6) | 859.4 (751.8, 962.9) | 870.2 (686.9, 938.6) | 0.57 |
| CTP (µg/L) | 3.2 (3.1, 3.4) | 3.7 (2.8, 4.9) | 3.2 (2.9, 3.8) | 0.20 |
| P1NP (µg/L) | 48.6 (37.4, 72.0) | 55.6 (42.5, 83.6) | 53.1 (39.5, 75.8) | 0.28 |
Median baseline values shown with interquartile range (IQR). Wilcoxon rank sum test used for determination of statistical significance. Two-sided α=0.05. sCD14=soluble CD14; sCD163=soluble CD163; I-FABP=intestinal-type fatty acid binding protein; IL-6=interleukin-6; TNF-α=tumor necrosis factor-α; sTNF-RII=soluble tumor necrosis factor receptor II; sVCAM-1=soluble vascular cell adhesion molecule-1; CTP=C-telopeptide; P1NP=pro-collagen type 1 N-terminal pro-peptide.
Changes in Biomarkers Between Weeks 0 and 24
Changes in biomarkers for both randomization groups are presented in Table 3. After 24 weeks, a significant median decline in sCD14 was observed in RAL-treated subjects (−461.9 ng/mL, −21%, IQR (−704.0, −253.7), p<0.001) compared to subjects remaining on PI or NNRTI (−102.6 ng/mL, −5%, IQR (−277.4, 107.6), p=0.28; between group p<0.01). This decline in sCD14 occurred regardless of whether subjects switched off PI or NNRTI, and was accompanied by an increase in TNF-α (RAL: 0.3 pg/mL, 7%, IQR (−0.2, 0.6), p=0.05; PI/NNRTI: −0.1 pg/mL, −2%, IQR (−0.9, 0.3), p=0.28; between group p=0.05). Subjects experiencing sCD14 declines below the median drove the increase in TNF-α among RAL-treated subjects. An insignificant increase in sTNF-RII (16.5 pg/mL, 0.6%, IQR (−76.4, 236.1), p=0.55) that was statistically different than the change seen in PI-/NNRTI-treated subjects (−195.7 pg/mL, −6%, IQR (−333.6, −47.9), within group p<0.001, between group p<0.01) was also observed. sTNF-RII did not change significantly in any sCD14 subgroup. Changes in sCD14, TNF-α, and sTNF-RII are illustrated in Figure 1. No statistically significant within or between group changes in other biomarkers were observed between weeks 0 and 24.
Table 3.
Median (IQR) Changes in Biomarkers
| Week 0–24 Changes | Week 0–48 Changes | Week 24–48 Changes | Pooled 24-week Changes | ||||||
|---|---|---|---|---|---|---|---|---|---|
| Immediate | Delayed | Between Group p |
Immediate | Within Group p |
Delayed | Within Group p |
Immediate 0–24 weeks Delayed 24–48 weeks |
Within Group p |
|
| N | 17 | 20 | 17 | ||||||
| sCD14 (ng/mL) | −461.9 (−704.0, −253.7)* | −102.6 (−277.4, 107.6) | 0.003 | −494.1 (−764.8, −269.4) | <0.0001 | −217.6 (−498.8, 14.4) | 0.006 | −308.9 (−704.0, −97.0) | <0.0001 |
| sCD163 (ng/mL) | 29.4 (−71.6, 98.0) | −27.5 (−44.8, 36.8) | 0.34 | 3.0 (−84.2, 94.0) | 1.00 | 70.6 (−7.0, 165.7) | 0.05 | 49.8 (−26.7, 125.4) | 0.05 |
| I-FABP (pg/mL) | −150.1 (−380.4, 173.3) | 250.2 (−379.7, 948.9) | 0.16 | −93.5 (−347.9, 227.3) | 0.75 | 261.2 (−110.6, 1341.2) | 0.08 | 149.7 (−380.4, 885.9) | 0.37 |
| IL-6 (pg/mL) | 0.5 (−0.9, 1.3) | −0.5 (−2.0, 0.3) | 0.16 | −0.2 (−0.4, 0.7) | 0.67 | 0.0 (−0.6, 1.0) | 0.77 | 0.3 (−0.9, 1.1) | 0.48 |
| D dimer (µg/mL) | −0.1 (−0.2, 0.0) | 0.0 (−0.1, 0.1) | 0.29 | 0.0 (−0.1, 0.1) | 0.87 | 0.1 (−0.1, 0.2) | 0.31 | 0.0 (−0.1, 0.1) | 0.80 |
| TNF-α (pg/mL) | 0.3 (−0.2, 0.6)* | −0.1 (−0.9, 0.3) | 0.05 | 0.1 (−0.9, 0.9) | 0.81 | 0.2 (−0.1, 0.9) | 0.15 | 0.3 (−0.2, 0.8) | 0.01 |
| sTNF-RII (pg/mL) | 16.5 (−76.4, 236.1) | −195.7 (−333.6, −47.9)* | 0.005 | 12.8 (−415.8, 195.4) | 0. 46 | 73.9 (−197.8, 207.2) | 1.00 | 59.2 (−172.4, 218.4) | 0.66 |
| sVCAM-1 (ng/mL) | −1.5 (−170.2, 30.8) | −46.0 (−173.2, 76.9) | 0.99 | −2.7 (−169.9, 39.1) | 0.16 | −1.9 (−41.0, 61.1) | 1.00 | −1.8 (−95.0, 59.7) | 0.38 |
| CTP (µg/L) | 0.1 (−0.6, 0.8) | 0.1 (−0.3, 0.4) | 0.84 | −0.0 (−0.7, 0.6) | 0.91 | 0.3 (−0.5, 0.7) | 0.44 | 0.2 (−0.6, 0.7) | 0.47 |
| P1NP (µg/L) | 4.0 (−7.6, 12.9) | −4.0 (−15.1, 4.8) | 0.31 | −2.5 (−18,9, 1.8) | 0.08 | 0.0 (−23.8, 4.5) | 0.46 | 0.6 (−13.9, 9.4) | 0.90 |
Median within-person change scores shown with interquartile range. Wilcoxon rank sum test used for determination of statistical significance. Two-sided α=0.05. sCD14=soluble CD14; sCD163=soluble CD163; I-FABP=intestinal-type fatty acid binding protein; IL-6=interleukin-6; TNF-α=tumor necrosis factor-α; sTNF-RII=soluble tumor necrosis factor receptor II; sVCAM-1=soluble vascular cell adhesion molecule-1; CTP=C-telopeptide; P1NP=pro-collagen type 1 N-terminal pro-peptide.
Within group p<0.05.
Figure 1. 48-Week Changes in sCD14, TNF-α and sTNR-RII.
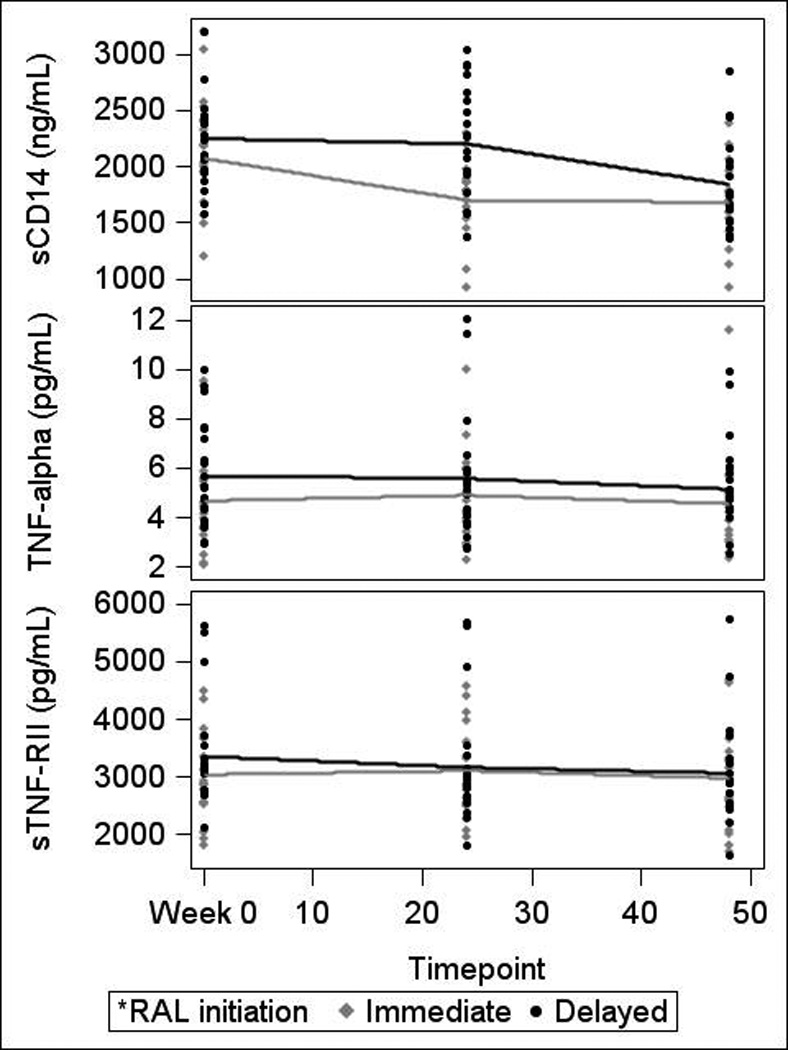
sCD14=soluble CD14; TNF-α=tumor necrosis factor-α; sTNF-RII=soluble tumor necrosis factor receptor II; RAL=raltegravir
Changes in Biomarkers Between Weeks 24 and 48
Changes in biomarkers for both randomization groups are presented in Table 3. After 48 weeks, subjects randomized to immediate switch maintained a reduction in sCD14 (total 48-week change −494.1 ng/mL, −23%, IQR (−764.8, −269.4), p<0.0001). Subjects randomized to delayed switch saw a significant decline in sCD14 following switch to RAL at week 24 (−217.6 ng/mL, −10%, IQR (−498.8, 14.35), p<0.01; Figure 2). Following switch to RAL, both groups achieved similar sCD14 declines (week 48 between group p value=0.48).
Figure 2. Individual Level Changes in sCD14 Over 48 Weeks.
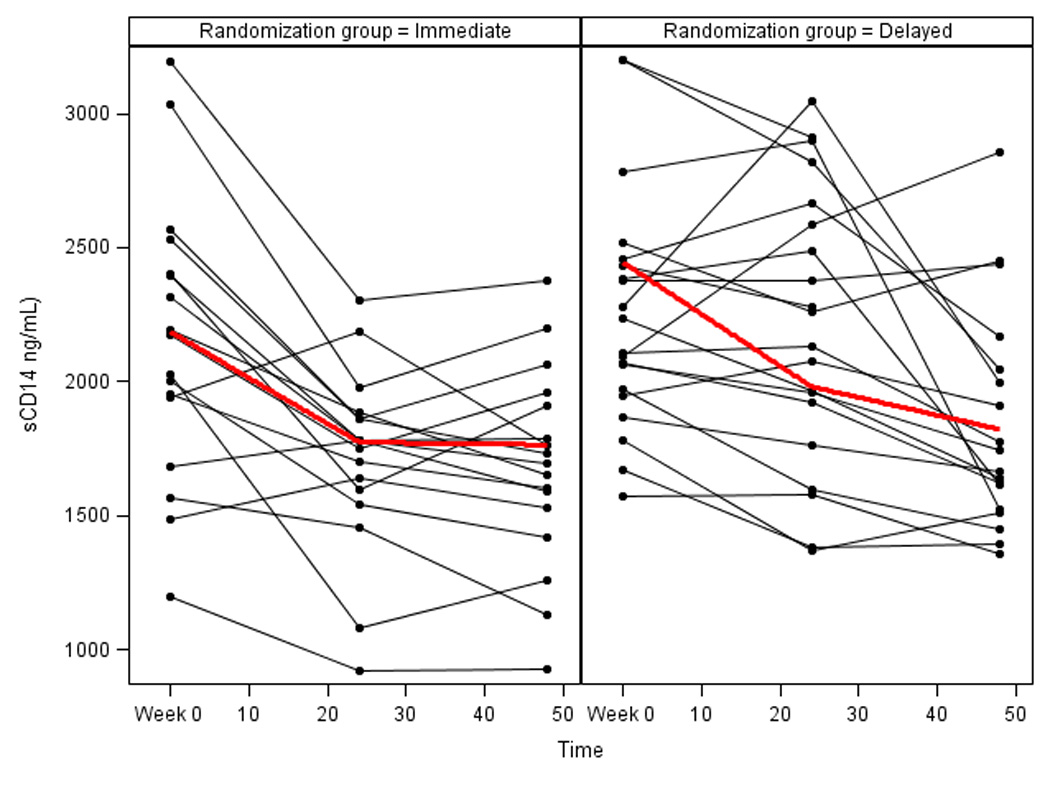
sCD14=soluble CD14
In the delayed switch group only, switch to RAL was also associated with an increase in sCD163 (70.6 ng/mL, 12%, IQR (−7.0, 165.7), p=0.05). No other statistically significant changes in biomarkers were observed in either randomization group after 48 weeks. Of note, upon switch to RAL, no significant increase in TNF-α or sTNF-RII was observed in subjects in the delayed switch arm. Additionally, at week 48, the small increases in TNF-α and sTNF-RII initially observed in immediate switch subjects no longer retained statistical significance.
Pooled Changes in Biomarkers for All Subjects Following Switch to RAL
When 24-week post-switch data from all subjects (weeks 0–24 for immediate switch, weeks 24–48 for delayed switch) was pooled to improve power, the median sCD14 decline remained significant (−308.9 ng/mL, −14%, IQR (−704.0, −97.0), p<0.0001). Pooled analysis also detected significant increases in sCD163 (previously observed in both groups but only significant in the delayed switch group; median 49.8 ng/mL, 8%, IQR (−26.7, 125.4), p=0.05) and TNF-α (previously observed in both groups but only significant in the immediate switch group; median 0.3 pg/mL, 6%, IQR (−0.15, 0.79), p=0.01). No other statistically significant changes in biomarkers were observed in the pooled analysis, including sTNF-RII.
Adjustment for Multiple Testing
After adjustment for multiple testing, significance for biomarker change scores was defined as p<0.001. While the decline in sCD14 in individual study arms approached but did not reach statistical significance (immediate switch weeks 0–24, p=0.003; delayed switch weeks 24–48, p=0.006), declines in sCD14 were significant for the 48-week change in the immediate switch group and in the pooled 24-week analysis (both p<0.0001).
Correlations Between Changes in Biomarkers and Clinical Parameters
At baseline, sCD14 correlated with sCD163 (r=0.40, p=0.01) and I-FABP (r=0.34, p=0.04), and sCD163 correlated strongly with sVCAM-1 (r=0.82, p<0.0001), TNF-α (r=0.68, p<0.0001), sTNF-RII (r=0.74, p<0.0001), and low-density lipoprotein cholesterol (LDL; r=−0.41, p=0.01). I-FABP correlated positively with sTNF-RII (r=0.38, p=0.02), visceral fat volume (r=0.50, p<0.01) and high-density lipoprotein cholesterol (HDL; r=0.43, <0.01), and negatively with current CD4+ T cell count (r=−0.36, p=0.03).
In the immediate switch group, 24-week changes in sCD14 correlated only with changes in hs-CRP (although no significant change in hs-CRP was observed (data previously published(18); r=0.55, p=0.03). Correlations between changes in sCD163 and visceral fat (r=0.56, p=0.05), I-FABP and d-dimer (r=−0.56, p=0.02) and TNF-α and CD4+ T cell count (r=−0.53, p=0.03) were also present. In the delayed switch group, significant correlations were observed between 24-week changes in sCD14 and d-dimer (r=0.48, p=0.03); TNF-α and sTNF-RII (r=0.59, p<0.01), CD4+ T cell count (r=−0.44, p=0.05), and sVCAM-1 (r=0.47, p=0.04); and sTNF-RII and sVCAM-1 (r=0.59, p<0.01).
In analysis of pooled 24-week changes following switch to RAL, changes in CTP correlated with changes in sCD163 (r=0.51, p=0.001) and waist circumference (r=−0.44, p=0.01), and changes in I-FABP correlated with changes in BMI (r=−0.35, p=0.04).
DISCUSSION
In this randomized trial of HIV-infected women with central adiposity, switch to RAL was associated with statistically significant within and between group declines in sCD14 compared to subjects remaining on PI or NNRTI. While RAL was associated with greater declines in sCD14 than NNRTI-based regimens in a small study of treatment-naïve subjects,(19) to our knowledge a decline in sCD14 in virologically-suppressed patients switching ART has not previously been described. This finding may have important clinical implications, as sCD14 has been associated with all-cause mortality in HIV infection.(7, 15, 16)
In the SMART study, a gradient effect of sCD14 quartile on mortality was observed, with an OR for mortality of 2.3 per increase in sCD14 IQR.(7) Setting the SMART overall mortality rate (1.55%) as the median mortality rate and using the per sCD14 IQR increase in OR for mortality (2.3) as a basis to calculate the OR for a one quartile change, it can be hypothesized that a one quartile increase in sCD14 might translate to a 52% increase in mortality among SMART subjects. The limitations of extrapolating this data to different patient populations are significant, and include the fact that an intervention to lower sCD14 may not have the same mortality benefit as initiating ART with a lower baseline sCD14 level; however, baseline sCD14 values in our study were similar to those in SMART, and, if the SMART data can be generalized to other patient populations, it is possible that the 21% decline in sCD14 we observed over 24 weeks in women switching to RAL might translate to an estimated 44% reduction in mortality. Or, for a similar mean follow-up time (16 months), approximately 200 subjects would need to switch to RAL to save one life.
Additionally, higher circulating levels of sCD14 and other markers of monocyte activation and/or microbial translocation have been associated with end-organ diseases including cardiovascular disease (sCD14,(20–22) sCD163(23) and lipopolysaccharide (LPS)(21, 24)), neurocognitive decline (sCD14,(25) sCD163(26) and LPS(27)), and non-alcoholic steatohepatitis,(11) suggesting that, if a true benefit of RAL on sCD14 exists, its long-term use could be associated with a smaller burden of comorbid disease than other antiretroviral agents.
Although the mechanism of sCD14 decline in subjects switching to RAL is unknown, one possibility is that increased RAL penetration into the gut (vs. PI/NNRTI) promotes local control of viral replication and inflammation and decreased microbial translocation. In a small study of HIV-uninfected men, Patterson et al reported rapid penetration of RAL into gastrointestinal tissue, with levels throughout the colon 160–650 fold greater than plasma levels. Additionally, RAL achieved higher levels in gastrointestinal tissue than other antiretroviral agents.(28)
A similar potential mechanism is reduced viremia and/or viral replication in areas other than the gut. However, prior RAL switch and intensification studies have not consistently demonstrated improved residual viremia or low-level viral replication (defined as decreased HIV-1 viral load via ultra-sensitive assay or increased 2-long-term repeat (2-LTR) circles) with RAL initiation.(29–34) Additionally, studies demonstrating increased 2-LTR circles with RAL intensification saw effects predominately in PI-treated subjects.(29, 30) While measurement of 2-LTR circles and HIV-1 viral load via ultra-sensitive assay were beyond the scope of this study, sCD14 decline following switch to RAL was not restricted to PI-treated subjects. RAL intensification has also demonstrated inconsistent improvements in T cell activation,(29, 30, 35, 36) and improved D dimer (29) and lipopolysaccharide(33) but not sCD14 levels.(33, 35, 36)
Finally, the observed decline in sCD14 might be attributable to RAL’s known, beneficial effects on lipid levels.(18, 37) For example, reduction in circulating lipid levels could lead to reduced hepatic inflammation and steatosis (leading to decreased sCD14 secretion from the liver), as has been observed with statin use.(38) Although we did not detect correlations between changes in monocyte activation markers and lipids or directly measure oxidized lipid levels in our study, oxidized LDL stimulates CD14 expression on circulating monocytes,(39) and oxidized HDL activates monocytes in vitro.(40) Thus, is reasonable to hypothesize that oxidized lipids may be a mediator of monocyte activation in HIV-infected patients.
It is important to note that, although we did not observe statistically significant changes in I-FABP or sCD163 following switch to RAL (vs. continued PI/NNRTI), we were not powered for these endpoints, and decreased microbial translocation and/or monocyte activation could contribute to the observed decline in sCD14 levels. Additionally, although I-FABP is a known marker of enterocyte damage,(41) its utility as a marker of microbial translocation in virologically-suppressed, HIV-infected patients has recently been challenged.(42). Similarly, the lack of statistically significant changes in markers of vascular function (sVCAM-1) and bone metabolism (CTP and P1NP) was likely heavily influenced by both our lack of power to observe these exploratory endpoints and the large observed physiologic variability. As such, these results should be interpreted as neutral rather than the lack of an effect of RAL on vascular function and/or bone turnover.
Although physiologic variability was large, a significant 24-week increase in TNF-α was observed in the immediate switch group. sTNF-RII also increased in the immediate switch group (although not significantly). Both increases were statistically different from the stable TNF-α and decreased sTNF-RII values observed in subjects remaining on PI or NNRTI; however, after 48 weeks the increase in TNF-α was no longer significant in the immediate switch group, and no significant changes in TNF-α or sTNF-RII were observed in delayed switch subjects following switch to RAL. The increase in sTNF-RII also was not significant in the pooled analysis. Additionally, the observed changes in TNF-α and sTNF-RII were small in magnitude compared to sCD14 (7% TNF-α, 0.6% sTNF-RII, −21% sCD14), are of unknown clinical significance and did not vary significantly by entry regimen. This latter finding is in contrast to the SPIRAL study, in which subjects switching from PI to RAL experienced significant declines in TNF-α.(43) Most importantly, only changes in sCD14 retained significance after adjustment for multiple testing. Further studies are needed to assess whether these findings can be replicated in larger cohorts, and to determine the mechanism of sCD14 decline in patients switching to RAL.
Finally, the study of sex differences in markers of immune activation is critically important, and documenting changes in biomarkers in HIV-infected women who are virologically suppressed is needed. For example, recent studies demonstrating associations between HIV infection and increased sCD14 and sCD163 were not designed to assess sex differences.(44–46) Complicating this is the observation that healthy HIV-infected women may have lower sCD14 and higher sCD163 levels than age-matched men.(45) The contribution of age to HIV infection and sex is also important: although sCD163 levels increase with age, Martin and colleagues recently reported sCD163 levels in HIV-infected women (87% on ART) that were similar to HIV-uninfected women 14.5 years older,(44) a finding previously described in HIV-infected men.(47) Thus, understanding the contribution of sex to immune activation is necessary in order to optimize care for women living with HIV.
Limitations
This study has several limitations. First, the sample size is small, biomarker measurements were exploratory in nature and physiologic variability was high. While the likelihood of types I and II error exist in this exploratory analysis, the magnitude of sCD14 improvement, its reproducibility across treatment arms and its significance after adjustment for multiple testing lead us to believe that the observed improvement in sCD14 represents a true finding. The fact that observed correlations between biomarkers (for example, positive correlations between baseline sCD14, sCD163 and I-FABP, and the negative correlation between change in sTNF-RII and CD4 count) were in keeping with physiologic expectations supports this conclusion.
Next, the high prevalence of generalized obesity in this cohort (median BMI 32 kg/m2) likely confounds any effect of RAL on biomarkers of inflammation. For example, sCD163 may be elevated in obese subjects,(48) and Koethe et al described the loss of incremental BMI effect on sCD14 in obese HIV-infected subjects.(49) Finally, we are unable to determine the mechanism of sCD14 decline in women switching to RAL, including whether the decrease arises from switch to RAL or switch away from PI or NNRTI. Thus, a larger study designed to provide mechanistic insight and powered to detect clinically significant effect sizes for changes in biomarkers is needed.
Conclusions
In this randomized trial of virologically-suppressed, HIV-infected women with central adiposity, switch to RAL from PI or NNRTI was associated with a statistically significant decline in sCD14. This is the first study to demonstrate significant changes in sCD14 following ART switch in subjects well controlled on ART, and may have important implications for mortality and/or the development of comorbidities in treated HIV-infected patients. Further studies are needed to assess whether this finding can be replicated in larger cohorts and to determine the mechanism of this decline.
ACKNOWLEDGEMENTS
This work was supported by: Merck and Co. Investigator-Initiated Studies Program to J.S. Currier; Merck Canada to S.L. Walmsley; career support from the Ontario HIV Treatment Network to S.L. Walmsley; and the National Institutes of Health [M01-RR000865, K24 AI56933 to J.S. Currier, P30-AG028748, and T32 MH080634].
The investigators would like to thank the study staff and subjects for their participation in this project, the staff at The Laboratory for Clinical Biochemistry Research (University of Vermont Department of Pathology, Colchester, VT 05446) for their assistance with inflammatory biomarker assay performance and data interpretation, and Dr. Heather McCreath, Dr. Chi-Hong Tseng and Ms. Diana Liao at the University of California, Los Angeles for their assistance with data analysis. We would also like to thank Drs. Michael Dube, Marshall Glesby, and Kathleen Squires for their service on the Data Safety Monitoring Board.
J.E. Lake has provided consulting services to Merck and Co. G.A. McComsey has served as a scientific advisor or speaker for Bristol Myers Squibb, GlaxoSmithKline, Abbott, Tibotec, Merck, and Gilead Sciences, has received research grants from Bristol Myers Squibb, GlaxoSmithKline, Abbott, Merck, and Gilead Sciences, and is currently serving as the DSMB Chair for a Pfizer-sponsored study. T. Hulgan has received a research grant from Merck and Co. C.A. Wanke has received grant funding from GlaxoSmithKline and Theratechnologies, and served as an event adjudicator for a Pfizer study. A. Mangili is currently the Medical Director for HIV/Endocrinology at EMD Serono, Inc., but performed this work independently of this position through her affiliation with Tufts University. S.L. Walmsley has provided consulting services to Merck and Co., and received a research grant from Merck Canada to help support this work. She has also served as an advisor and speaker to AbbVie, Tibotec, Bristol Myers Squibb, ViiV Healthcare, and Gilead Sciences. R. Tracy has served as a scientific advisor or speaker for AbbVie and Merck, and performed work supported by the grant from Merck to J.S. Currier for the conduct of this study. J.S. Currier received a research grant for the conduct of this study from the Merck and Co. Investigator-Initiated Studies Program.
Footnotes
These data were presented in part at the 20th Conference on Retroviruses and Opportunistic Infections (Atlanta, GA, USA, March 3–6, 2013).
CONFLICTS OF INTEREST
S.A. Stramotas has no conflicts of interest to report.
AUTHOR CONTRIBUTIONS
J.E. Lake was the primary author, served as Co-Principal Investigator for the protocol, aided in protocol revisions and contributed to study oversight and data analysis. G.A. McComsey developed the original study design and protocol with J.S. Currier, served as Co-Principal Investigator for the protocol and contributed to the analytic plan and manuscript preparation. T. Hulgan, C.A. Wanke, A. Mangili and S.L. Walmsley were Co-Investigators, enrolled participants and contributed to manuscript preparation and review. S.A. Stramotas assisted with data analysis and contributed to manuscript preparation. R. Tracy was responsible for biomarker assay oversight, provided scientific consultation and assisted with manuscript preparation. J.S. Currier developed the original study design and protocol with G.A. McComsey, was Co-Principal Investigator of the protocol and contributed to manuscript development.
REFERENCES
- 1.Baker JV, Neuhaus J, Duprez D, et al. Changes in inflammatory and coagulation biomarkers: a randomized comparison of immediate versus deferred antiretroviral therapy in patients with HIV infection. J Acquir Immune Defic Syndr. 2011 Jan 1;56(1):36–43. doi: 10.1097/QAI.0b013e3181f7f61a. [DOI] [PMC free article] [PubMed] [Google Scholar]
- 2.Brown TT, Tassiopoulos K, Bosch RJ, Shikuma C, McComsey GA. Association between systemic inflammation and incident diabetes in HIV-infected patients after initiation of antiretroviral therapy. Diabetes Care. 2010 Oct;33(10):2244–2249. doi: 10.2337/dc10-0633. [DOI] [PMC free article] [PubMed] [Google Scholar]
- 3.Hileman CO, Wohl DA, Tisch DJ, Debanne SM, McComsey GA. Short communication: initiation of an abacavir-containing regimen in HIV-infected adults is associated with a smaller decrease in inflammation and endothelial activation markers compared to non-abacavir-containing regimens. AIDS Res Hum Retroviruses. 2012 Dec;28(12):1561–1564. doi: 10.1089/aid.2012.0034. [DOI] [PMC free article] [PubMed] [Google Scholar]
- 4.Neuhaus J, Jacobs DR, Jr, Baker JV, et al. Markers of inflammation, coagulation, and renal function are elevated in adults with HIV infection. J Infect Dis. 2010 Jun 15;201(12):1788–1795. doi: 10.1086/652749. [DOI] [PMC free article] [PubMed] [Google Scholar]
- 5.McComsey GA, Kitch D, Daar ES, et al. Inflammation markers after randomization to abacavir/lamivudine or tenofovir/emtricitabine with efavirenz or atazanavir/ritonavir. AIDS. 2012 Jul 17;26(11):1371–1385. doi: 10.1097/QAD.0b013e328354f4fb. [DOI] [PMC free article] [PubMed] [Google Scholar]
- 6.Kuller LH, Tracy R, Belloso W, et al. Inflammatory and coagulation biomarkers and mortality in patients with HIV infection. PLoS Med. 2008 Oct 21;5(10):e203. doi: 10.1371/journal.pmed.0050203. [DOI] [PMC free article] [PubMed] [Google Scholar]
- 7.Sandler NG, Wand H, Roque A, Law M, Nason MC, Nixon DE, et al. Plasma levels of soluble CD14 independently predict mortality in HIV infection. J Infect Dis. 2011 Mar 15;203(6):780–790. doi: 10.1093/infdis/jiq118. [DOI] [PMC free article] [PubMed] [Google Scholar]
- 8.Boulware DR, Hullsiek KH, Puronen CE, et al. Higher levels of CRP, D-dimer, IL-6, and hyaluronic acid before initiation of antiretroviral therapy (ART) are associated with increased risk of AIDS or death. J Infect Dis. 2011 Jun 1;203(11):1637–1646. doi: 10.1093/infdis/jir134. [DOI] [PMC free article] [PubMed] [Google Scholar]
- 9.Ranoa DR, Kelley SL, Tapping RI. Human Lipopolysaccharide-binding Protein (LBP) and CD14 Independently Deliver Triacylated Lipoproteins to Toll-like Receptor 1 (TLR1) and TLR2 and Enhance Formation of the Ternary Signaling Complex. J Biol Chem. 2013 Apr 5;288(14):9729–9741. doi: 10.1074/jbc.M113.453266. [DOI] [PMC free article] [PubMed] [Google Scholar]
- 10.Kirkland TN, Viriyakosol S. Structure-function analysis of soluble and membrane-bound CD14. Prog Clin Biol Res. 1998;397:79–87. [PubMed] [Google Scholar]
- 11.Ogawa Y, Imajo K, Yoneda M, et al. Soluble CD14 Levels Reflect Liver Inflammation in Patients with Nonalcoholic Steatohepatitis. PLoS One. 2013;8(6):e65211. doi: 10.1371/journal.pone.0065211. [DOI] [PMC free article] [PubMed] [Google Scholar]
- 12.Mendez-Lagares G, Romero-Sanchez MC, Ruiz-Mateos E, et al. Long-Term Suppressive Combined Antiretroviral Treatment Does Not Normalize the Serum Level of Soluble CD14. J Infect Dis. 2013 Apr 15;207(8):1221–1225. doi: 10.1093/infdis/jit025. [DOI] [PubMed] [Google Scholar]
- 13.Wallet MA, Rodriguez CA, Yin L, et al. Microbial translocation induces persistent macrophage activation unrelated to HIV-1 levels or T-cell activation following therapy. AIDS. 2010 Jun 1;24(9):1281–1290. doi: 10.1097/QAD.0b013e328339e228. [DOI] [PMC free article] [PubMed] [Google Scholar]
- 14.Merlini E, Bai F, Bellistri GM, Tincati C, d'Arminio Monforte A, Marchetti G. Evidence for polymicrobic flora translocating in peripheral blood of HIV-infected patients with poor immune response to antiretroviral therapy. PLoS One. 2011;6(4):e18580. doi: 10.1371/journal.pone.0018580. [DOI] [PMC free article] [PubMed] [Google Scholar]
- 15.Thiebaut R, Charpentier C, Damond F, et al. Association of soluble CD14 and inflammatory biomarkers with HIV-2 disease progression. Clin Infect Dis. 2012 Nov 15;55(10):1417–1425. doi: 10.1093/cid/cis708. [DOI] [PubMed] [Google Scholar]
- 16.Justice AC, Freiberg MS, Tracy R, et al. Does an index composed of clinical data reflect effects of inflammation, coagulation, and monocyte activation on mortality among those aging with HIV? Clin Infect Dis. 2012 Apr;54(7):984–994. doi: 10.1093/cid/cir989. [DOI] [PMC free article] [PubMed] [Google Scholar]
- 17.Romero-Sanchez M, Gonzalez-Serna A, Pacheco YM, et al. Different biological significance of sCD14 and LPS in HIV-infection: importance of the immunovirology stage and association with HIV-disease progression markers. J Infect. 2012 Nov;65(5):431–438. doi: 10.1016/j.jinf.2012.06.008. [DOI] [PubMed] [Google Scholar]
- 18.Lake JE, McComsey GA, Hulgan TM, et al. A randomized trial of raltegravir replacement for protease inhibitor or non-nucleoside reverse transcriptase inhibitor in HIV-infected women with lipohypertrophy. AIDS Patient Care STDS. 2012 Sep;26(9):532–540. doi: 10.1089/apc.2012.0135. [DOI] [PMC free article] [PubMed] [Google Scholar]
- 19.Asmuth DM, Ma ZM, Mann S, et al. Gastrointestinal-associated lymphoid tissue immune reconstitution in a randomized clinical trial of raltegravir versus non-nucleoside reverse transcriptase inhibitor-based regimens. AIDS. 2012 Aug 24;26(13):1625–1634. doi: 10.1097/QAD.0b013e3283546595. [DOI] [PubMed] [Google Scholar]
- 20.Manner I, Baekken M, Kvale D, et al. Markers of microbial translocation predict hypertension in HIV-infected individuals. HIV Med. 2013 Jul;14(6):354–361. doi: 10.1111/hiv.12015. [DOI] [PubMed] [Google Scholar]
- 21.Kelesidis T, Kendall MA, Yang OO, Hodis HN, Currier JS. Biomarkers of microbial translocation and macrophage activation: association with progression of subclinical atherosclerosis in HIV-1 infection. J Infect Dis. 2012 Nov 15;206(10):1558–1567. doi: 10.1093/infdis/jis545. [DOI] [PMC free article] [PubMed] [Google Scholar]
- 22.Merlini E, Luzi K, Suardi E, et al. T-cell phenotypes, apoptosis and inflammation in HIV+patients on virologically effective cART with early atherosclerosis. PLoS One. 2012;7(9):e46073. doi: 10.1371/journal.pone.0046073. [DOI] [PMC free article] [PubMed] [Google Scholar]
- 23.Subramanian S, Tawakol A, Burdo TH, et al. Arterial inflammation in patients with HIV. JAMA. 2012 Jul 25;308(4):379–386. doi: 10.1001/jama.2012.6698. [DOI] [PMC free article] [PubMed] [Google Scholar]
- 24.Blodget E, Shen C, Aldrovandi G, et al. Relationship between microbial translocation and endothelial function in HIV infected patients. PLoS One. 2012;7(8):e42624. doi: 10.1371/journal.pone.0042624. [DOI] [PMC free article] [PubMed] [Google Scholar]
- 25.Lyons JL, Uno H, Ancuta P, et al. Plasma sCD14 is a biomarker associated with impaired neurocognitive test performance in attention and learning domains in HIV infection. J Acquir Immune Defic Syndr. 2011 Aug 15;57(5):371–379. doi: 10.1097/QAI.0b013e3182237e54. [DOI] [PMC free article] [PubMed] [Google Scholar]
- 26.Burdo TH, Weiffenbach A, Woods SP, Letendre S, Ellis RJ, Williams KC. Elevated sCD163 in plasma but not cerebrospinal fluid is a marker of neurocognitive impairment in HIV infection. AIDS. 2013 Jun 1;27(9):1387–1395. doi: 10.1097/QAD.0b013e32836010bd. [DOI] [PMC free article] [PubMed] [Google Scholar]
- 27.Ancuta P, Kamat A, Kunstman KJ, et al. Microbial translocation is associated with increased monocyte activation and dementia in AIDS patients. PLoS One. 2008;3(6):e2516. doi: 10.1371/journal.pone.0002516. [DOI] [PMC free article] [PubMed] [Google Scholar]
- 28.Patterson KB, Prince HA, Stevens T, et al. Differential penetration of raltegravir throughout gastrointestinal tissue: implications for eradication and cure. AIDS. 2013 Jun 1;27(9):1413–1419. doi: 10.1097/QAD.0b013e32835f2b49. 2013. [DOI] [PMC free article] [PubMed] [Google Scholar]
- 29.Hatano H, Strain MC, Scherzer R, et al. Increase in 2-long terminal repeat circles and decrease in D-dimer after raltegravir intensification in patients with treated HIV infection: a randomized, placebo-controlled trial. J Infect Dis. 2013 Nov 1;208(9):1436–1442. doi: 10.1093/infdis/jit453. [DOI] [PMC free article] [PubMed] [Google Scholar]
- 30.Buzon MJ, Massanella M, Llibre JM, et al. HIV-1 replication and immune dynamics are affected by raltegravir intensification of HAART-suppressed subjects. Nat Med. 2010 Apr;16(4):460–465. doi: 10.1038/nm.2111. [DOI] [PubMed] [Google Scholar]
- 31.McMahon D, Jones J, Wiegand A, et al. Short-course raltegravir intensification does not reduce persistent low-level viremia in patients with HIV-1 suppression during receipt of combination antiretroviral therapy. Clin Infect Dis. 2010 Mar 15;50(6):912–919. doi: 10.1086/650749. [DOI] [PMC free article] [PubMed] [Google Scholar]
- 32.Besson GJ, McMahon D, Maldarelli F, Mellors JW. Short-course raltegravir intensification does not increase 2 long terminal repeat episomal HIV-1 DNA in patients on effective antiretroviral therapy. Clin Infect Dis. 2012 Feb 1;54(3):451–453. doi: 10.1093/cid/cir721. [DOI] [PMC free article] [PubMed] [Google Scholar]
- 33.Vallejo A, Gutierrez C, Hernandez-Novoa B, et al. The effect of intensification with raltegravir on the HIV-1 reservoir of latently infected memory CD4 T cells in suppressed patients. Aids. 2012 Sep 24;26(15):1885–1894. doi: 10.1097/QAD.0b013e3283584521. [DOI] [PubMed] [Google Scholar]
- 34.Lam YM, McBride KL, Amin J, et al. Switching virally suppressed, treatment-experienced patients to a raltegravir-containing regimen does not alter levels of HIV-1 DNA. PLoS One. 2012;7(3):e31990. doi: 10.1371/journal.pone.0031990. [DOI] [PMC free article] [PubMed] [Google Scholar]
- 35.Byakwaga H, Kelly M, Purcell DF, et al. Intensification of antiretroviral therapy with raltegravir or addition of hyperimmune bovine colostrum in HIV-infected patients with suboptimal CD4+ T-cell response: a randomized controlled trial. J Infect Dis. 2011 Nov 15;204(10):1532–1540. doi: 10.1093/infdis/jir559. [DOI] [PubMed] [Google Scholar]
- 36.Massanella M, Negredo E, Puig J, et al. Raltegravir intensification shows differing effects on CD8 and CD4 T cells in HIV-infected HAART-suppressed individuals with poor CD4 T-cell recovery. Aids. 2012 Nov 28;26(18):2285–2293. doi: 10.1097/QAD.0b013e328359f20f. [DOI] [PubMed] [Google Scholar]
- 37.Eron JJ, Young B, Cooper DA, et al. Switch to a raltegravir-based regimen versus continuation of a lopinavir-ritonavir-based regimen in stable HIV-infected patients with suppressed viraemia (SWITCHMRK 1 and 2): two multicentre, double-blind, randomised controlled trials. Lancet. 2010 Jan 30;375(9712):396–407. doi: 10.1016/S0140-6736(09)62041-9. [DOI] [PubMed] [Google Scholar]
- 38.Nseir W, Mahamid M. Statins in nonalcoholic fatty liver disease and steatohepatitis: updated review. Curr Atheroscler Rep. 2013 Mar;15(3):305. doi: 10.1007/s11883-012-0305-5. [DOI] [PubMed] [Google Scholar]
- 39.Bruckmeier M, Kuehnl A, Culmes M, Pelisek J, Eckstein HH. Impact of oxLDL and LPS on C-type natriuretic peptide system is different between THP-1 cells and human peripheral blood monocytic cells. Cell Physiol Biochem. 2012;30(1):199–209. doi: 10.1159/000339044. [DOI] [PubMed] [Google Scholar]
- 40.Soumyarani VS, Jayakumari N. Oxidatively modified high density lipoprotein promotes inflammatory response in human monocytes-macrophages by enhanced production of ROS, TNF-alpha, MMP-9, and MMP-2. Mol Cell Biochem. 2012 Jul;366(1–2):277–285. doi: 10.1007/s11010-012-1306-y. [DOI] [PubMed] [Google Scholar]
- 41.Pelsers MM, Namiot Z, Kisielewski W, et al. Intestinal-type and liver-type fatty acid-binding protein in the intestine. Tissue distribution and clinical utility. Clin Biochem. 2003 Oct;36(7):529–535. doi: 10.1016/s0009-9120(03)00096-1. [DOI] [PubMed] [Google Scholar]
- 42.Vesterbacka J, Nowak P, Barqasho B, et al. Kinetics of microbial translocation markers in patients on efavirenz or lopinavir/r based antiretroviral therapy. PLoS One. 2013;8(1):e55038. doi: 10.1371/journal.pone.0055038. [DOI] [PMC free article] [PubMed] [Google Scholar]
- 43.Martinez E, D'Albuquerque PM, Llibre JM, et al. Changes in cardiovascular biomarkers in HIV-infected patients switching from ritonavir-boosted protease inhibitors to raltegravir. Aids. 2012 Nov 28;26(18):2315–2326. doi: 10.1097/QAD.0b013e328359f29c. [DOI] [PubMed] [Google Scholar]
- 44.Martin GE, Gouillou M, Hearps AC, et al. Age-associated changes in monocyte and innate immune activation markers occur more rapidly in HIV infected women. PLoS One. 2013;8(1):e55279. doi: 10.1371/journal.pone.0055279. [DOI] [PMC free article] [PubMed] [Google Scholar]
- 45.Hearps AC, Martin GE, Angelovich TA, et al. Aging is associated with chronic innate immune activation and dysregulation of monocyte phenotype and function. Aging Cell. 2012 Oct;11(5):867–875. doi: 10.1111/j.1474-9726.2012.00851.x. [DOI] [PubMed] [Google Scholar]
- 46.Mendez-Lagares G, Romero-Sanchez MC, Ruiz-Mateos E, et al. Long-Term Suppressive Combined Antiretroviral Treatment Does Not Normalize the Serum Level of Soluble CD14. J Infect Dis. 2013 Apr;207(8):1221–1225. doi: 10.1093/infdis/jit025. [DOI] [PubMed] [Google Scholar]
- 47.Hearps AC, Maisa A, Cheng WJ, et al. HIV infection induces age-related changes to monocytes and innate immune activation in young men that persist despite combination antiretroviral therapy. AIDS. 2012 Apr 24;26(7):843–853. doi: 10.1097/QAD.0b013e328351f756. [DOI] [PubMed] [Google Scholar]
- 48.Zanni MV, Burdo TH, Makimura H, Williams KC, Grinspoon SK. Relationship between monocyte/macrophage activation marker soluble CD163 and insulin resistance in obese and normal-weight subjects. Clin Endocrinol (Oxf) 2012 Sep;77(3):385–390. doi: 10.1111/j.1365-2265.2011.04284.x. [DOI] [PMC free article] [PubMed] [Google Scholar]
- 49.Koethe JR, Dee K, Bian A, et al. Circulating Interleukin-6, Soluble CD14, and Other Inflammation Biomarker Levels Differ Between Obese and Nonobese HIV-Infected Adults on Antiretroviral Therapy. AIDS Res Hum Retroviruses. 2013 Jul;29(7):1019–1025. doi: 10.1089/aid.2013.0016. [DOI] [PMC free article] [PubMed] [Google Scholar]