Abstract
Background
Voltage mapping is an important tool for characterizing proarrhythmic electrophysiological substrate, yet it is subject to geometric factors that influence bipolar amplitudes and thus compromise performance. The aim of this study was to characterize the impact of catheter orientation on the ability of bipolar amplitudes to accurately discriminate between healthy and diseased tissues.
Methods and Results
We constructed a three-dimensional, in-silico, bidomain model of cardiac tissue containing transmural lesions of varying diameter. A planar excitation wave was stimulated and electrograms were sampled with a realistic catheter model at multiple positions and orientations. We carried out validation studies in animal experiments of acute ablation lesions mapped with a clinical mapping system. Bipolar electrograms sampled at higher inclination angles of the catheter with respect to the tissue demonstrated improvements in both sensitivity and specificity of lesion detection. Removing low voltage electrograms with concurrent activation of both electrodes, suggesting false attenuation of the bipolar electrogram due to alignment with the excitation wavefront, had little effect on the accuracy of voltage mapping.
Conclusions
Our results demonstrate possible mechanisms for the impact of catheter orientation on voltage mapping accuracy. Moreover, results from our simulations suggest that mapping accuracy may be improved by selectively controlling the inclination of the catheter to record at higher angles with respect to the tissue.
Keywords: arrhythmia, computer-based model, electroanatomical mapping, voltage mapping, bipolar electrogram, catheter ablation
Introduction
Cardiac substrate mapping is a class of electroanatomical mapping in which proarrhythmic tissues are identified based on features of the local electrograms (EGMs). EGM features commonly interrogated for signs of pathology include signal amplitude, the power spectrum, and fractionation (“voltage”, “DF”, and “CFAE” mapping, respectively)1–3. A common thread among these mapping techniques is the frequent reliance on bipolar EGMs which are valued in clinical electrophysiology for their sensitivity to local electrical properties. However, various geometric factors, e.g., perpendicular alignment of the electrode pair relative to the direction of the advancing activation wave, may influence bipolar EGM morphology and thus impact the accuracy of substrate mapping.
In voltage based substrate mapping, the peak-to-peak amplitude of bipolar EGMs, typically from a single, representative activation sequence, is recorded and displayed on a geometric representation of the chamber being mapped. Multiple studies have demonstrated that diseased tissues, i.e., scarred or fibrotic, produce smaller bipolar amplitudes (BPAs) than are observed in healthy tissues1,4. However, studies using voltage mapping to localize lesions have reported both over-, and underestimation of lesion size5–8. The plausible sources of these errors in voltage mapping are manifold but one possibility is the variability in BPAs that arises due to geometric uncertainty in electrode placement and orientation. Recently, Otomo et al. explored the effect of transmural ablation lesions on electrograms recorded with a mapping catheter oriented either perpendicular or parallel to the cardiac wall at the ablation site9. Their findings clearly demonstrated that electrogram morphology changes due to the geometric positioning of the catheter. We have extended this line of inquiry using experiments and in silico studies, and to our knowledge, no previous study has systematically linked the effects of the geometric parameters on BPAs to the accuracy of voltage mapping based detection of myocardial injury or disease.
A thorough and precise study of the effects of geometric parameters including catheter size, orientation, placement, and electrode configuration on the localization of cardiac tissue lesions is not practical using purely experimental approaches. Even with large mammal models it is not currently feasible to capture and control all the relevant parameters with adequate accuracy. In contrast, an approach based on computational modeling and simulation provides complete control over all relevant parameters and the ability to mimic the conditions in the heart. The requirements of such an in silico study include the ability to create realistic models of the myocardium and electrodes, to solve the associated bioelectric spread of excitation and extra-cardiac potentials, and to display and analyze the results quantitatively. The numerical methods and software for such a modeling pipeline are now available10–12 and well enough refined to serve as a reliable platform for such a study.
The specific aims of our study were to identify and quantify the impact of some known but clinically uncontrolled geometric factors on cardiac substrate mapping. We used a myocardial slab in which we introduced lesions and then simulated the spread of activation through the tissue. We then introduced a geometrically realistic model of a clinical mapping and ablation catheter and simulated catheter placement at different sites and orientations relative to the tissue surface. By imposing a range of thresholds to distinguish between normal and subnormal bipolar voltage amplitudes, including accepted clinical thresholds, we predicted the sites of lesions, compared the results to the known locations, and then created receiver-operator-curves (ROC). Based on this metric of performance, we could then identify the critical sources of error and determine the resulting bounds on precision for this ubiquitous technique in clinical cardiac electrophysiology.
Methods
Computational Model
We executed a bidomain simulation of the spread of activation through an electrically isotropic slab model of atrial myocardium with the Cardiac Arrhythmia Research Package (CARP) software13. The model geometry was a 50×50×5 mm slab composed of isotropic hexahedral elements with 0.18 mm edge length. The slab was completely immersed in a bath that was 3 mm deep on all sides except for the mapping surface, where the bath was 10 mm deep. Within the myocardial slab, we incorporated cylindrically shaped, transmural lesions of 4, 6, 8, and 10 mm diameter. One edge of the geometry was stimulated to produce a planar wavefront, and, according to standard practice, we scaled conductivities to produce physiologically realistic conduction velocities (0.56 m/s). The Courtemanche-Ramirez-Nattel cell model of atrial myocyte kinetics14 simulated the excitation of normal myocardium whereas lesions were modeled as passive volume conductors.
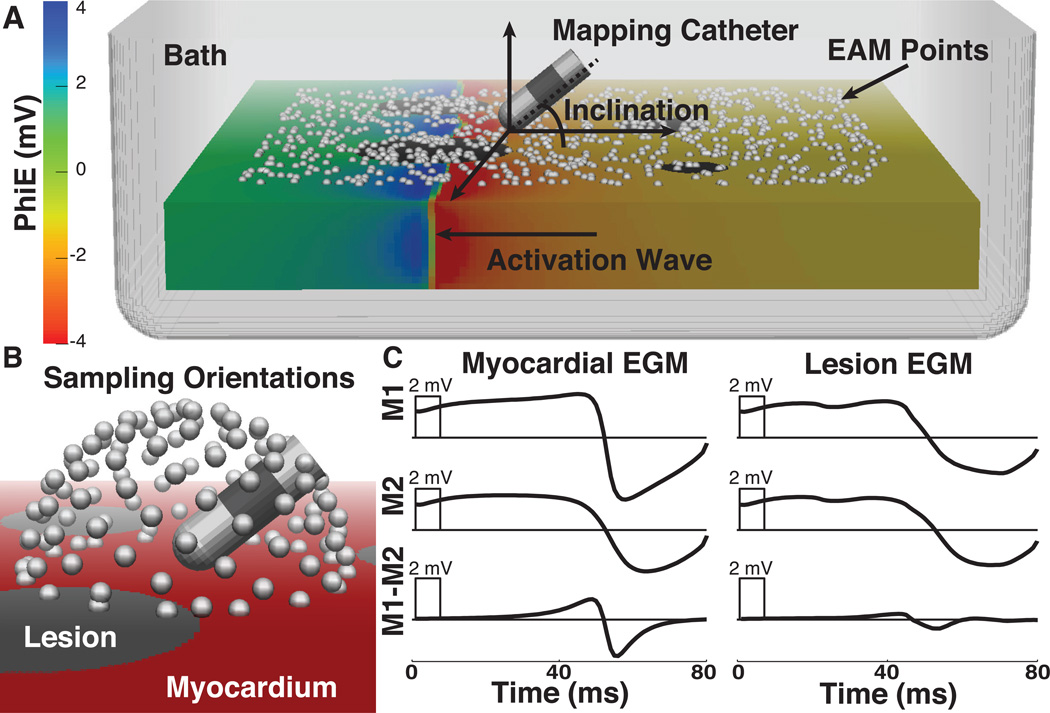
A realistic catheter geometry (8 F diameter, 4 mm long tip, 2 mm long distal ring electrode with 2 mm interelectrode spacing) was used to sample the electric potential on the simulated heart surface at 1 kHz sampling frequency. A random sampling of 1000 points on the surface of the tissue (738 on normal tissue, 190 on lesions, and 72 removed from analysis due to stimulus artifact in the EGMs), all at least 5 mm from the slab edge, determined the placement of the simulated catheter tip. The sampling of points was weighted such that the density of points on lesions was 3 times higher than that of normal tissues. With the catheter tip fixed at each of these 928 surface points (Figure 1A), we then tilted the catheter through 116 uniformly distributed orientations in three dimensions (Figure 1B). At each location and orientation of the catheter, we computed the extracellular potentials at the electrodes for the entire time series to reconstruct unipolar and bipolar EGMs (Figure 1C).
Figure 1.
In silico model of electroanatomical substrate mapping. A. 3-dimensional slab model with activation wave propagating from right to left and extracellular potentials displayed with color on the mesh. The white spheres show randomly selected points on the surface where the catheter tip was positioned for the recording of EGMs. The catheter, displayed at an inclination of ≈ 30 degrees, is representative of devices used clinically(8 F, 4 mm tip, 2 mm spacing). B. Illustration of the catheter positions used to sample electrograms. White spheres represent 116 transformations of the proximal electrode around the surface point. C. Representative electrograms acquired from same location in model before (L), and after simulated lesions were included in the model (R). EAM - electroanatomical map, EGMs - electrograms, PhiE - extracellular potential, M1 and M2 - unipolar signals from distal and proximal electrodes, respectively.
There were two parameters in this study that we assumed would affect performance. The first was the angle of the catheter shaft relative to the tissue, defined as the inclination angle. A value of zero corresponded to all electrodes of the catheter lying flat on the tissue surface and a value of 90 degrees to a full perpendicular catheter orientation (Figure 1A). We evaluated the sensitivity and specificity of lesion detection through the full range of catheter inclination angles. The second parameter of interest was the orientation of the bipolar electrodes relative to the activation wave front. However, curvature in the wave front caused by the lesions impeded consistent calculation of the angle between the bipolar electrode axis and the wavefront. To overcome this limitation we used the difference in activation times, annotated at the maximum negative slope of the distal and proximal unipolar EGMs15, as a marker of wave front arrival9, a metric we term ΔLAT, or absolute difference in local activation time expressed as:
ΔLAT(M1 − M2) = ΔLAT(M1) − LAT(M2)Δ,
where M1 and M2 correspond to the two unipolar electrode sites. Small values of ΔLAT indicate (near) simultaneous arrival of activation at both electrodes, i.e., that the wave front direction is approximately perpendicular to the axis of the catheter. Given the anticipated error under such conditions, we evaluated the sensitivity and specificity of lesion detection when EGMs with small ΔLAT were removed from analysis.
Animal Model
Simulations provide considerably more control over relevant parameters than experiments, but they also require validation. While the scope of validation by experiment was inherently limited in this study, we were able to generate data to support our approach from dedicated animal studies approved by the University of Utah Institutional Animal Care and Use Committee. The details of this experimentation were previously reported by Ranjan et al. and are revisited in detail in the Online Supplemental Material16. Briefly, voltage mapping of swine right atria was performed before and after the creation of point ablation lesions. Gross pathological examination and analysis of the spatial characteristics of low voltage regions facilitated estimation of the extent of injury surrounding lesions and calculation of sensitivities and specificities for voltage mapping.
Statistical Methods
All repeated measurements are expressed as mean ± standard deviation. Student’s T-test, accompanied by the Holm-Bonferroni method for multiple comparisons, was used to test for significance. Significance was achieved at values of p < 0.05.
Sensitivity and specificity are reported as true positive ratio (TPR) and false positive ratio (FPR = 1-specificity), respectively, as defined by a standard confusion matrix. Briefly, postablation points within the range of impact of each lesion were expected to show low voltage. Conversely, points sampled outside of the region impacted by ablation were anticipated to demonstrate normal bipolar amplitudes. A range of voltage thresholds for defining low voltage (0.25–3.0 mV) was tested to calculate receiver operating characteristic (ROC) curves for both models. We also used the Matthew’s correlation coefficient (MCC), a performance metric for summarizing a confusion matrix in a single value17–19. MCC values range from −1 to +1, with a value of +1 indicating perfect correlation, or prediction. In this study, MCC was used to assess the performance of substrate mapping through a range of voltages.
Results
Computational Model
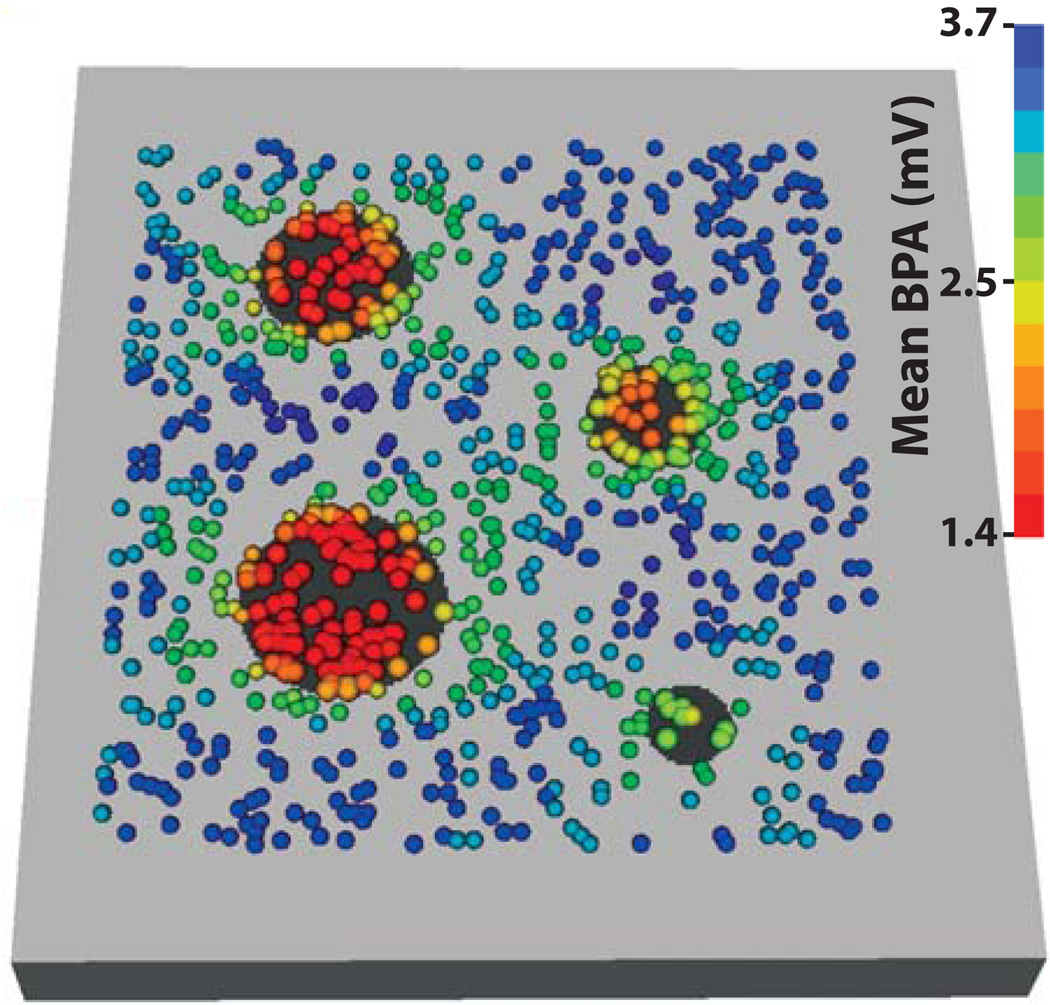
Figure 2 shows the mean bipolar amplitude, over the 116 recording orientations, at each mapping site from the lesion model. For all points, the mean bipolar amplitude for EGMs recorded on lesions, 2.00 ± 1.01 mV (n = 22,040), was significantly lower than BPAs from healthy tissue, 3.24 ± 0.91 mV (n = 85,608).
Figure 2.
Mean of 116 BPAs recorded at each mapping site. Bipolar amplitudes were recorded at 928 locations (colored spheres) on the lesion model (normal tissue is colored light gray and lesions are black). The mean of all bipolar amplitudes recorded at each of 928 sites (n = 116) determines sphere color.
Comparison of Voltage Mapping Accuracy in Computational and Experimental Models
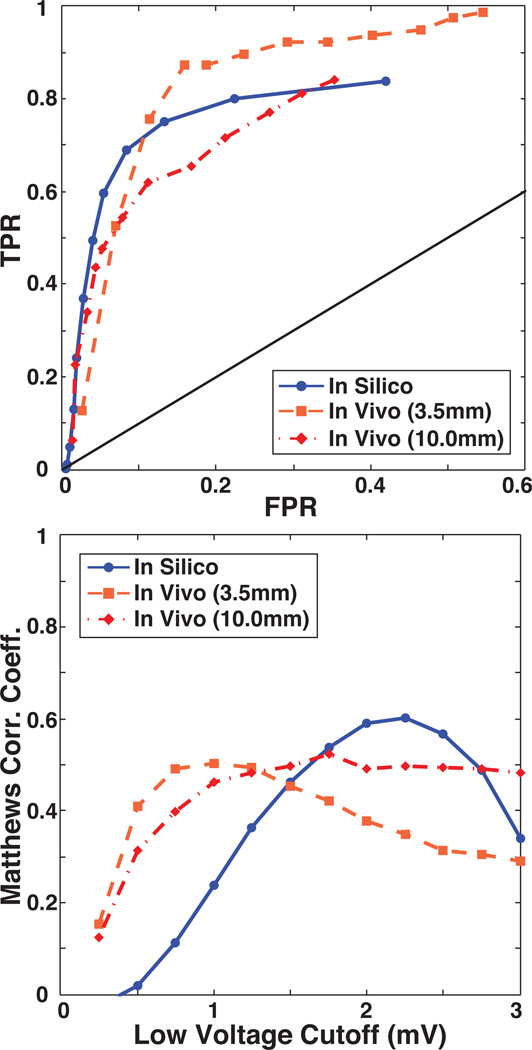
The fidelity of lesion detection with voltage based substrate mapping, for both the in silico and in vivo models, was assessed by computing sensitivity, specificity, and Matthews Correlation Coefficient (MCC) values over a range of physiologically realistic low voltage thresholds ranging from 0.25 to 3.0 mV in increments of 0.25 mV). ROC curves and plots of MCC as a function of low voltage threshold demonstrated a similar dependence of both models on threshold selection, an example of which is shown in Figure 3. As might be anticipated, varying the voltage threshold for lesion detection demonstrated tradeoffs in sensitivity and specificity of the ROC curves. For the in vivo measurements, limiting the expected extent of low voltage tissue to the 3.5 mm radius region of directly ablated myocardium resulted in relatively higher sensitivity and lower specificity compared to a more relaxed boundary that accounted for low voltages caused by injury responses surrounding lesion (10 mm radius). Results from the in silico model showed similar characteristics to the in vivo model, but with a generally improved specificity and higher voltages for lesions and normal tissues (Figure 3). The following sections expand on this overall characterization of substrate mapping accuracy. Specifically, we evaluated the results under variations in inclination angle of the catheter and ΔLAT of the EGMs
Figure 3.
Baseline evaluation of lesion detection accuracy. Top: Baseline TPR and FPR of lesion detection for the in vivo and in silico models were calculated at voltage cutoffs ranging from 0.25 to 3.0 mV. Bottom: MCC plotted as a function of the low voltage cutoff illustrates the performance of substrate mapping in each model at a given voltage. TPR = True Positive Ratio, FPR = False Positive Ratio, MCC = Matthews Correlation Coefficient.
Effect of Catheter Inclination Angle on Lesion Detection
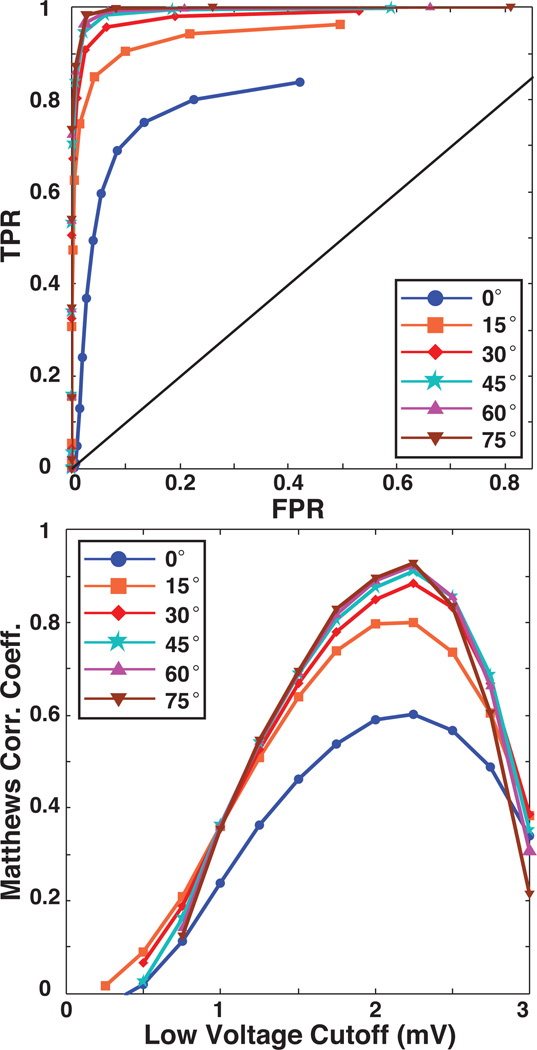
Figure 4 contains ROC curves in which bipolar electrogram recordings acquired at low inclination angles were progressively removed, in increments of 15 degrees, from the sensitivity analysis. As the figure shows, such removal of low inclination EGMs, i.e., those for which the proximal electrode is near the cardiac surface, dramatically improved the ROC performance and the peak MCC values. For example, removing all EGMs with an inclination of less than 30 degrees improved the TPR and FPR over baseline by 21.8% and 6.0%, respectively, and the peak MCC value from 0.60 to 0.91. Improvements beyond 30 degrees were only incremental.
Figure 4.
Effect of inclination angle on in silico voltage mapping accuracy. The upper panel contains ROC curves that demonstrate the sensitivity and specificity of voltage mapping as BPAs recorded at low inclination angles are removed by increments of 15 degrees. The lower panel contains plots of Matthews correlation coefficient which show the effect of progressively removing low inclination recordings on the performance of voltage mapping as a function of the low voltage threshold. The blue curves, marked with circles, indicate the baseline conditions shown in the previous figure.
Effect of Catheter Orientation with Respect to Activation Wave on Lesion Detection
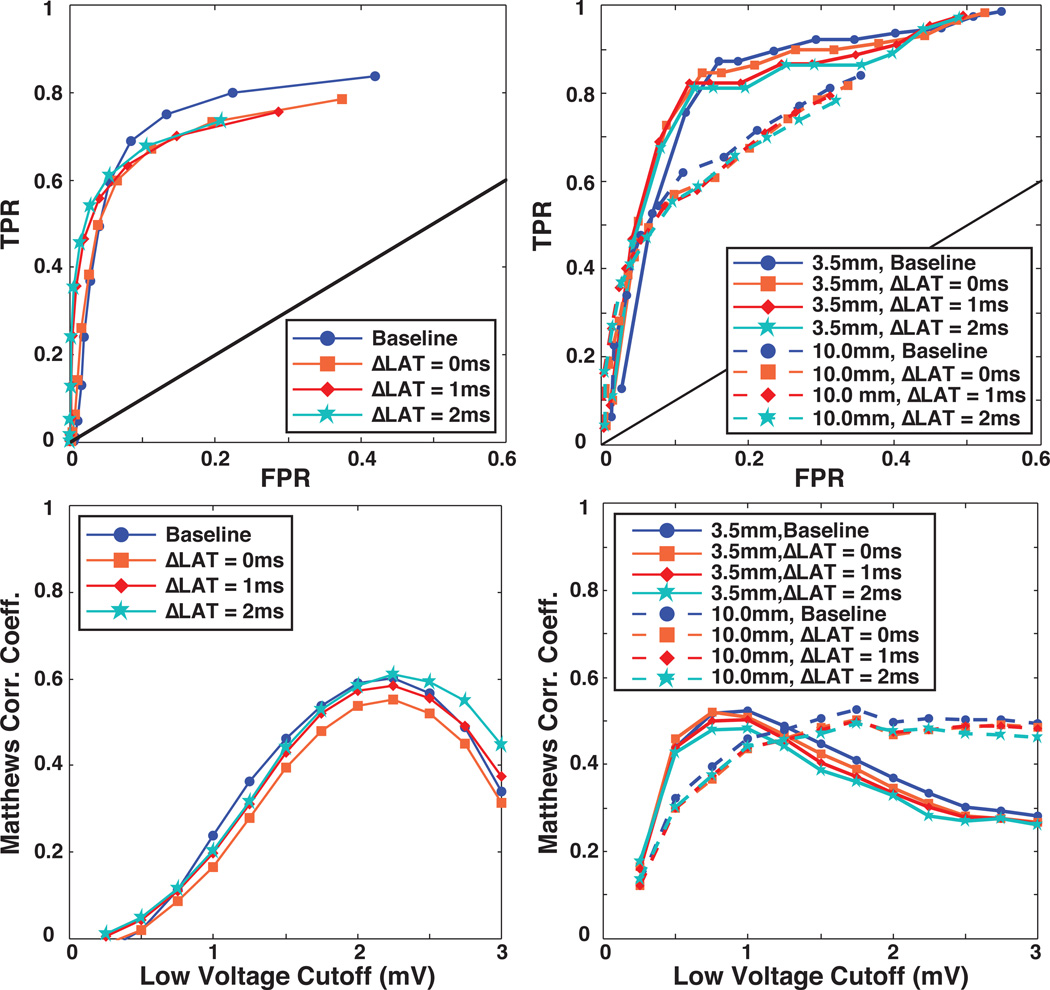
It is generally known that variations in alignment of the activation wave and the bipolar electrodes can alter the shape and amplitude of bipolar EGMs, reducing BPAs when the wavefront arrives at both electrodes simultaneously. To evaluate the effect of this parameter on the accuracy of lesion detection, we employed the same strategy as in the previous section by successively removing from consideration EGMs with small ΔLAT values (0, 1, and 2 ms). As described in the Methods section, ΔLAT is an indirect metric of alignment between activation wavefront and electrode axis. The fact that this metric is based on signal morphology also allows application to both simulated and measured EGMs and we included both in this evaluation.
Figure 5 shows ROC and MCC curves following removal of recordings with |ΔLAT| of ≤ 0, 1, and 2 ms compared to baseline results. For both the in silico and in vivo models, we detected little change in overall accuracy, as measured by the amplitude of the associated MCC, by removing low ΔLAT values. This finding was confirmed visually in Figure 5 by the observation that the ROC curves superimposed closely for all cases. Note that in the curves based on in vivo measurements, we applied separately the 3.5 mm and 10 mm assumptions for injury proximity to the lesion.
Figure 5.
Effect of simultaneous electrode activation on the accuracy of voltage mapping in silico (left column) and in vivo (right column). The top panels in both columns contain ROC curves from which EGMs with low ΔLAT values, indicating perpendicular alignment of the wavefront direction and the bipolar axis, were removed. The lower panels contain Matthews correlation coefficient as a function of low voltage threshold for the same EGMs
Discussion
Voltage mapping is a valuable clinical tool for the identification of arrhythmogenic myocardial tissue. However, the use of bipolar EGMs introduces geometric factors that may cause errors in the classification of diseased and healthy tissues. Previous studies have sought to determine optimal BPA voltage thresholds for identifying diseased tissue1,8, but were unable to consider the effect of these geometric factors on mapping accuracy. This study systematically explored the influence of electrode inclination angle and orientation on the ability of voltage mapping to detect changes in the myocardial substrate. Our findings elucidate possible mechanisms for improper classification of tissue type and suggest novel recording strategies that could improve voltage mapping accuracy.
The first factor whose role in lesion detection we investigated was the inclination angle of the catheter relative to the endocardial surface. Considering only BPAs recorded at inclinations above 30 degrees improved the quality of substrate classification by 51.7% (MCC of 0.6 to 0.91). At higher inclination angles, the bipolar electrode pair maintained common-mode rejection while reducing potentially confounding electric potentials sensed by the proximal electrode located near the cardiac surface. Our simulations suggest that ensuring an inclination angle of > 30 degrees could substantially improve lesion localization. Recent advances in catheter tracking and sensing, e.g., contact force measurement technology or real time MRI catheter tracking, are emerging technologies that could enable such control of catheter angle20–22.
The second geometric parameter we considered was the orientation of the catheter with respect to the activation wavefront. Perpendicular alignment of the electrode pair with the direction of the activation wave front may cause artifactual attenuation of the bipolar amplitudes resulting in healthy tissue being classified as scar23. While such errors would appear to be avoidable through directed electrode placement, robust determination of orientation of the catheter to the activation wave is not currently feasible in clinical cardiac mapping. We attempted to use signal processing to reduce the associated errors by identifying low voltage bipolar electrograms with near simultaneous activation in their respective unipolar signals and removing them from consideration9. Our strategy assumed that small ΔLAT electrograms would disproportionately produce false positive, low voltage recordings. However, in both the in silico and in vivo models, the removal of small ΔLAT electrograms had a mostly harmful effect on voltage mapping performance. Further examination of this finding revealed that small ΔLATs also frequently occurred when the catheter was at high inclination angles with respect to the tissue. Thus, true low voltage EGMs recorded at higher inclination angles were improperly removed, because of their small ΔLATs, causing a decrease in sensitivity that offset any gains in specificity. While false low voltages caused by wavefront-electrogram alignment tend to have small ΔLAT values, the reverse is not consistently true. However, these findings are specific to the electrode configuration and distribution of catheter orientations employed in this study. It is possible that other mapping devices, or distributions of catheter orientation, e.g., both bipolar electrodes always in tissue contact, may reveal utility for bipolar EGM discrimination based on the ΔLAT value.
Simulation allowed precise definition of the lesion boundaries in the model in a way that was not possible in our in vivo experimental studies (see Online Supplement). Gross pathological evaluation from the experiments did provide confirmation of lesion presence and size, however, BPA varies around the boundaries of lesions in ways that still inhibit precise post hoc determination. To deal with such variations, we assumed two regions around the lesions (radii of 3.5 mm and 10 mm) that contained low voltage EGMs and evaluated the performance of measured signals separately for these two cases. With these assumptions, we attempted to incorporate into the analysis the variable and unpredictable effects of acute factors, beyond necrosis and tissue death, that are known to impact the amplitude of bipolar electrograms, e.g., stunning and edema. As noted, performance under these two assumptions was different in expected ways and provided a realistic basis for comparison with—and validation of—the results from simulations.
Calculation of MCC in this study returned a metric of accuracy in the detection of lesions as a function of threshold voltage. Through the various permutations of parameters, we found that the best BPA threshold remained relatively stable varying from 2.0 to 2.25 mV. This consistency supports the notion that establishing a carefully chosen voltage threshold is both feasible and useful to classify tissue type in clinical practice. However, because these findings were based on porcine and computational models, any extension of these values to clinical mapping studies is limited. Rather, we focused on evaluating factors that affect the performance of any low-voltage threshold as a discriminator of tissue type.
Finally, the 3D slab geometry we used is a simplified computational model that does not incorporate such factors as variation in wall thickness, or curvature of cardiac tissue. As such, a future step will be to incorporate more realistic geometric and tissue features into such a model. Even with such a simple model, we have illustrated in a novel way the impacts of realistic constraints of bipolar electrogram based cardiac mapping and validated some of those results with experiments. Extending the study to a more realistic, three-dimensional geometric model is straightforward so that this study can also serve as a feasibility test and motivator for additional complexity.
Conclusion
This study explored the utility of computational models for evaluating complex clinical scenarios that cannot be replicated in experiments. The specific case for this study was evaluating geometric parameters for their role in inducing uncertainty in cardiac mapping. The in vivo measurements provided qualitative validation of part of the simulations, instilling confidence that other simulation results were also valid. Our findings suggest that for parameters that are too difficult to control in experiments, e.g., inclination angle, simulation provides a tractable and powerful means to lend insight into the interactions of these factors. Furthermore, the results of this study support our initial hypothesis that different catheter orientations substantially impact the accuracy of diagnostic recordings, and suggest that controlling for optimal orientation would greatly improve the characterization of diseased myocardial substrates. Future confirmation of these findings could lead to improvements in catheter design and mapping technique. Such improvements in substrate characterization could extend the utility of voltage mapping to a variety of substrate based arrhythmogenic cardiomyopathies.
Supplementary Material
Acknowledgements
The authors thank Christopher Gloschat for technical assistance.
This project was supported by grants from the National Center for Research Resources (5P41RR012553-15) and the National Institute of General Medical Sciences (8 P41 GM103545-15) from the National Institutes of Health.
Dr. Marrouche reports participation on research grants/other research support and serving as a consultant/advisory board member of eCardio and Estech; honoraria relevant to this topic from Biotronik, Boston Scientific & Boehringer Ingelheim; stock ownership in UMS, Cardiac Designs, Arapeen Medical, Marrek and Sentro Med.
Footnotes
Other authors: No disclosures.
References
- 1.Marchlinski FE, Callans DJ, Gottlieb CD, Zado E. Linear ablation lesions for control of unmappable ventricular tachycardia in patients with ischemic and nonischemic cardiomyopathy. Circulation. 2000;101:1288–1296. doi: 10.1161/01.cir.101.11.1288. [DOI] [PubMed] [Google Scholar]
- 2.Nademanee K, McKenzie J, Kosar E, Schwab M, Sunsaneewitayakul B, Vasavakul T, Khunnawat C, Ngarmukos T. A new approach for catheter ablation of atrial fibrillation: mapping of the electrophysiologic substrate. J Am Coll Cardiol. 2004;43:2044–2053. doi: 10.1016/j.jacc.2003.12.054. [DOI] [PubMed] [Google Scholar]
- 3.Sanders P, Berenfeld O, Hocini M, Jaïs P, Vaidyanathan R, Hsu L-F, Garrigue S, Takahashi Y, Rotter M, Sacher F, Scavée C, Ploutz-Snyder R, Jalife J, Haïssaguerre M. Spectral analysis identifies sites of high-frequency activity maintaining atrial fibrillation in humans. Circulation. 2005;112:789–797. doi: 10.1161/CIRCULATIONAHA.104.517011. [DOI] [PubMed] [Google Scholar]
- 4.Oakes RS, Badger TJ, Kholmovski EG, Akoum N, Burgon NS, Fish EN, Blauer J, Rao SN, DiBella EVR, Segerson NM, Daccarett M, Windfelder J, McGann CJ, Parker D, MacLeod RS, Marrouche NF. Detection and quantification of left atrial structural remodeling with delayed-enhancement magnetic resonance imaging in patients with atrial fibrillation. Circulation. 2009;119:1758–1767. doi: 10.1161/CIRCULATIONAHA.108.811877. [DOI] [PMC free article] [PubMed] [Google Scholar]
- 5.Codreanu A, Odille F, Aliot E, Marie P-Y, Magnin-Poull I, Andronache M, Mandry D, Djaballah W, Régent D, Felblinger J, de Chillou C. Electroanatomic Characterization of Post-Infarct Scars. J Am Coll Cardio. 2008;52:839–842. doi: 10.1016/j.jacc.2008.05.038. [DOI] [PubMed] [Google Scholar]
- 6.Wijnmaalen AP, van der Geest RJ, van Huls van Taxis CFB, Siebelink H-MJ, Kroft LJM, Bax JJ, Reiber JHC, Schalij MJ, Zeppenfeld K. Head-to-head comparison of contrast-enhanced magnetic resonance imaging and electroanatomical voltage mapping to assess post-infarct scar characteristics in patients with ventricular tachycardias: real-time image integration and reversed registration. Eur Heart J. 2011;32:104–114. doi: 10.1093/eurheartj/ehq345. [DOI] [PubMed] [Google Scholar]
- 7.Perez-David E, Arenal Á, Rubio-Guivernau JL, del Castillo R, Atea L, Arbelo E, Caballero E, Celorrio V, Datino T, Gonzalez-Torrecilla E, Atienza F, Ledesma-Carbayo MJ, Bermejo J, Medina A, Fernández-Avilés F. Noninvasive Identification of Ventricular Tachycardia-Related Conducting Channels Using Contrast-Enhanced Magnetic Resonance Imaging in Patients With Chronic Myocardial Infarction. J Am Coll Cardiol. 2011;57:11–11. doi: 10.1016/j.jacc.2010.07.043. [DOI] [PubMed] [Google Scholar]
- 8.Spears DA, Suszko AM, Dalvi R, Crean AM, Ivanov J, Nanthakumar K, Downar E, Chauhan VS. Relationship of bipolar and unipolar electrogram voltage to scar transmurality and composition derived by magnetic resonance imaging in patients with nonischemic cardiomyopathy undergoing VT ablation. Heart Rhythm. 2012;9:1837–1846. doi: 10.1016/j.hrthm.2012.07.022. [DOI] [PubMed] [Google Scholar]
- 9.Otomo K, Uno K, Fujiwara H, Isobe M, Iesaka Y. Local unipolar and bipolar electrogram criteria for evaluating the transmurality of atrial ablation lesions at different catheter orientations relative to the endocardial surface. Heart Rhythm. 2010;7:1291–1300. doi: 10.1016/j.hrthm.2010.06.014. [DOI] [PubMed] [Google Scholar]
- 10.MacLeod RS, Stinstra JG, Lew S, Whitaker RT, Swenson DJ, Cole MJ, Krüger J, Brooks DH, Johnson CR. Subject-specific, multiscale simulation of electrophysiology: a software pipeline for image-based models and application examples. Phil Trans R Soc A. 2009;367:2293–2310. doi: 10.1098/rsta.2008.0314. [DOI] [PMC free article] [PubMed] [Google Scholar]
- 11.Relan J, Pop M, Delingette H, Wright GA, Ayache N, Sermesant M. Personalization of a Cardiac Electrophysiology Model Using Optical Mapping and MRI for Prediction of Changes With Pacing. IEEE Trans Biomed Eng. 2011;58:3339–3349. doi: 10.1109/TBME.2011.2107513. [DOI] [PubMed] [Google Scholar]
- 12.Camara O, Sermesant M, Lamata P, Wang L, Pop M, Relan J, De Craene M, Delingette H, Liu H, Niederer S, Pashaei A, Plank G, Romero D, Sebastian R, Wong KCL, Zhang H, Ayache N, Frangi AF, Shi P, Smith NP, Wright GA. Inter-model consistency and complementarity: Learning from ex-vivo imaging and electrophysiological data towards an integrated understanding of cardiac physiology. Prog Biophys Mol Bio. 2011;107:122–133. doi: 10.1016/j.pbiomolbio.2011.07.007. [DOI] [PubMed] [Google Scholar]
- 13.Vigmond EJ, Hughes M, Plank G, Leon LJ. Computational tools for modeling electrical activity in cardiac tissue. J Electrocardiol. 2003;36:69–74. doi: 10.1016/j.jelectrocard.2003.09.017. [DOI] [PubMed] [Google Scholar]
- 14.Courtemanche M, Ramirez RJ, Nattel S. Ionic targets for drug therapy and atrial fibrillation-induced electrical remodeling: insights from a mathematical model. Cardiovasc Res. 1999;42:477–489. doi: 10.1016/s0008-6363(99)00034-6. [DOI] [PubMed] [Google Scholar]
- 15.Spach MS, Dolber PC. Relating extracellular potentials and their derivatives to anisotropic propagation at a microscopic level in human cardiac muscle. Evidence for electrical uncoupling of side-to-side fiber connections with increasing age. Circ Res. 1986;58:356–371. doi: 10.1161/01.res.58.3.356. [DOI] [PubMed] [Google Scholar]
- 16.Ranjan R, Kholmovski EG, Blauer J, Vijayakumar S, Volland NA, Salama ME, Parker DL, MacLeod R, Marrouche NF. Identification and Acute Targeting of Gaps in Atrial Ablation Lesion Sets Using a Real-Time Magnetic Resonance Imaging System. Circ Arrhythm Electrophysiol. 2012;5:1130–1135. doi: 10.1161/CIRCEP.112.973164. [DOI] [PMC free article] [PubMed] [Google Scholar]
- 17.Matthews BW. Comparison of the predicted and observed secondary structure of T4 phage lysozyme. Biochim Biophys Acta. 1975;405:442–451. doi: 10.1016/0005-2795(75)90109-9. [DOI] [PubMed] [Google Scholar]
- 18.Baldi P, Brunak S, Chauvin Y, Andersen CAF, Nielsen H. Assesing the accuracy of predition algorithms for classification: an overview. Bioinformatics. 2000;16:412–424. doi: 10.1093/bioinformatics/16.5.412. [DOI] [PubMed] [Google Scholar]
- 19.Jurman G, Riccadonna S, Furlanello C. A Comparison of MCC and CEN Error Measures in Multi-Class Prediction. PLoS ONE. 2012;7:e41882–e41886. doi: 10.1371/journal.pone.0041882. [DOI] [PMC free article] [PubMed] [Google Scholar]
- 20.Yokoyama K, Nakagawa H, Shah DC, Lambert H, Leo G, Aeby N, Ikeda A, Pitha JV, Sharma T, Lazzara R, Jackman WM. Novel contact force sensor incorporated in irrigated radiofrequency ablation catheter predicts lesion size and incidence of steam pop and thrombus. Circ Arrhythm Electrophysiol. 2008;1:354–362. doi: 10.1161/CIRCEP.108.803650. [DOI] [PubMed] [Google Scholar]
- 21.Guttman MA, Ozturk C, Raval AN, Raman VK, Dick AJ, DeSilva R, Karmarkar P, Lederman RJ, McVeigh ER. Interventional cardiovascular procedures guided by real-time MR imaging: an interactive interface using multiple slices, adaptive projection modes and live 3D renderings. J Magn Reson Imaging. 2007;26:1429–1435. doi: 10.1002/jmri.21199. [DOI] [PMC free article] [PubMed] [Google Scholar]
- 22.Vergara GR, Vijayakumar S, Kholmovski EG, Blauer J, Guttman MA, Gloschat C, Payne G, Vij K, Akoum NW, Daccarett M, McGann CJ, MacLeod RS, Marrouche NF. Real-time magnetic resonance imaging-guided radiofrequency atrial ablation and visualization of lesion formation at 3 Tesla. Heart Rhythm. 2011;8:295–303. doi: 10.1016/j.hrthm.2010.10.032. [DOI] [PMC free article] [PubMed] [Google Scholar]
- 23.Brunckhorst CB, Delacretaz E, Soejima K, Maisel WH, Friedman PL, Stevenson WG. Impact of changing activation sequence on bipolar electrogram amplitude for voltage mapping of left ventricular infarcts causing ventricular tachycardia. J Interv Card Electrophysiol. 2005;12:137–141. doi: 10.1007/s10840-005-6549-z. [DOI] [PubMed] [Google Scholar]
Associated Data
This section collects any data citations, data availability statements, or supplementary materials included in this article.


