

Abstract
Transcranial direct current stimulation (tDCS) is a noninvasive brain stimulation technique used both experimentally and therapeutically to modulate regional brain function. However, few studies have directly measured the aftereffects of tDCS on brain activity or examined changes in task‐related brain activity consequent to prefrontal tDCS. To investigate the neural effects of tDCS, we collected fMRI data from 22 human subjects, both at rest and while performing the Balloon Analog Risk Task (BART), before and after true or sham transcranial direct current stimulation. TDCS decreased resting blood perfusion in orbitofrontal cortex and the right caudate and increased task‐related activity in the right dorsolateral prefrontal cortex (DLPFC) and anterior cingulate cortex (ACC) in response to losses but not wins or increasing risk. Network analysis showed that whole‐brain connectivity of the right ACC correlated positively with the number of pumps subjects were willing to make on the BART, and that tDCS reduced connectivity between the right ACC and the rest of the brain. Whole‐brain connectivity of the right DLPFC also correlated negatively with pumps on the BART, as prior literature would suggest. Our results suggest that tDCS can alter activation and connectivity in regions distal to the electrodes. Hum Brain Mapp 35:3673–3686, 2014. © 2014 Wiley Periodicals, Inc.
Keywords: Balloon Analog Risk Task, fMRI, network analysis, resting‐state connectivity, tDCS
INTRODUCTION
Transcranial direct current stimulation (tDCS) is a technique for noninvasive brain stimulation whose use has rapidly increased in recent years, with 176 articles published in 2011 (up from 75 in 2010, 66 in 2009, and 67 in 2008). Its safety, low cost, and ease of application make tDCS preferable to transcranial magnetic stimulation (TMS) in some contexts—notably prefrontal stimulation, where the TMS pulse may activate facial muscles, making subject retention difficult and sham stimulation impossible. However, because tDCS relies on an electrical current running between an anode and a cathode, it can be difficult to ascribe any observed behavioral effects of tDCS to specific stimulation sites.
In this study, we sought to improve our understanding of the effects of tDCS on the brain by imaging subjects during a task and at rest, both before and after real or sham tDCS to the prefrontal cortex. We analyzed task‐related BOLD activity as well as resting‐state relative cerebral blood flow (rCBF) computed from arterial spin labeling (ASL) perfusion fMRI, and used graph‐theoretic techniques to interrogate the effects of tDCS on resting network connectivity. We selected the Balloon Analog Risk Task (BART) [Lejuez et al., 2002] for two main reasons. First, a version of the BART adapted for fMRI produces extremely robust activation in prefrontal and subcortical reward systems, including the dorsolateral prefrontal cortex (DLPFC) bilaterally [Fukunaga et al., 2012; Rao et al., 2008, 2010; Schonberg et al., 2012], consistent with a rich vein of work implicating the DLPFC in decision‐making and risk processing more generally [Kim and Shadlen, 1999; Rao et al., 2008; Rangel et al., 2008; Venkatraman et al., 2009, inter alia for reviews, see Brand et al., 2006; Wallis and Miller, 2003; Trepel et al., 2005]. This reliable activation profile makes it a good candidate for examining tDCS‐related neuromodulation. Second, tDCS applied to the DLPFC bilaterally has been reported to reduce risk‐seeking on the BART [Fecteau et al., 2007a], consistent with results from lesion and brain stimulation studies using different tasks [Clark et al., 2003; Fecteau et al., 2007b; Fellows and Farah, 2005; Knoch et al., 2006; Manes et al., 2002]. Thus, we had prior reasons to believe that bifrontal tDCS would affect the DLPFC activity elicited by the BART. We followed Fecteau et al. [2007a,b] in applying anodal (excitatory) stimulation to the right DLPFC and cathodal (inhibitory) to the left. A decrease in number of pumps on the BART consequent to excitation of right DLPFC would be quite consistent with the inverse pattern (increased risk tolerance after damage or TMS to right DLPFC) observed in prior work. However, we allowed that we might observe other patterns of activation, as Fecteau et al. (2007a) observed qualitatively similar effects on risk tolerance regardless of the position of the anode—suggesting that these prima facie opposite montages might lead to similar brain changes, perhaps in regions distal to the stimulation sites.
This research offers three main contributions. First, few studies have examined the neurocognitive changes consequent to prefrontal tDCS. Of the few studies that combine tDCS and neuroimaging, most examine the effects of tDCS over motor cortex [Antal et al., 2011, 2012; Baudewig et al., 2001; Jang et al., 2009; Kwon et al., 2008; Lang et al., 2005; Nair et al., 2011; Polanía et al., 2011a, 2011b, 2011c; Zheng et al., 2011], or the effects of prefrontal tDCS on resting‐state activity [Keeser et al., 2011; Merzagora et al., 2010; Peña‐Gómez et al., 2012]. Prefrontal tDCS and fMRI have been used together to study picture naming [Holland et al., 2011] and verbal fluency [Pereira et al., 2012], but never decision under risk. Second, our graph‐theoretic approach allowed us to relate whole‐brain connectivity to behavior and assess its susceptibility to tDCS, revealing alterations in information flow not easily detected by activation fMRI. Finally, the fMRI BART task allowed us to distinguish neural responses to risk, wins, and losses, whereas the behavioral variables furnished by the BART cannot separate subjects' responses to those facets of the paradigm.
MATERIALS AND METHODS
Subjects
Twenty‐two subjects (nine females, ages 19–35) participated in the experiment. Eleven (three females, ages 19–31) underwent sham tDCS and the rest (six females, ages 19–35) true tDCS, as described below. All participants had normal or corrected‐to‐normal vision, were right handed and had no history of neurological or psychiatric disorders. Participants were informed of the experimental procedures and written consent was obtained from all participants according to the University of Pennsylvania Institutional Review Board. All research was performed in compliance with the Declaration of Helsinki. Each participant was compensated $40 for participating in the study.
Overview of Experiment
See Figure 1a for a schematic of the experimental design. Each subject was randomly assigned to receive true or sham tDCS and scanned immediately before and immediately after stimulation. Subjects were scanned with both conventional blood oxygen level‐dependent (BOLD) fMRI and pseudo‐continuous ASL perfusion fMRI [Chen et al., 2011; Dai et al., 2008]. The first scanning session consisted of an anatomical scan, during which the subject practiced the BART for approximately 6 min, followed by a resting ASL scan (84 volumes acquired over 6 min), a BOLD scan during which the subject performed the BART (400 volumes acquired over 11 min), and another resting ASL scan (84 volumes, 6 min). The subject was then removed from the scanner for tDCS, which took place in the control room directly outside the scanner, and replaced in the scanner as soon as the tDCS procedure was complete. The second scanning session was identical to the first except without the anatomical and concomitant training. The delay between the end of tDCS and the beginning of the third ASL scan was approximately 3 to 5 min.
Figure 1.
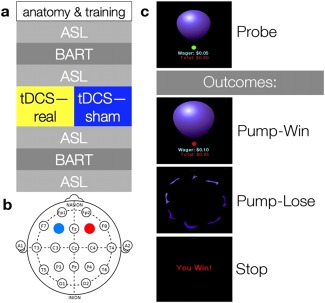
Overview of experimental structure. (a) Order of the experiment. (b) Stimulation sites mapped on the International 10–20 system. The anode is colored red, the cathode blue. (c) Schematic of the BART. Each time subjects are confronted with a balloon, they have two options: Pump or stop. Pumping can lead to either an addition to or the loss of the money accumulated on that trial; stopping adds the money accumulated on that trial to a persistent bank. [Color figure can be viewed in the online issue, which is available at http://wileyonlinelibrary.com.]
BART Protocol
We adapted the BART protocol used by Rao et al. [2008]. Like the classic BART, this protocol presents subjects with a succession of “balloons,” each of which can be “pumped” several times to add value to a temporary bank. Subjects may choose to redeem the balloon at any point to add the value of the temporary bank to a persistent bank; however, each pump increases the risk that the balloon will “pop,” in which case the value accumulated for that balloon is lost. A BART run is naturally divided into balloons, each of which starts from the initial presentation of an uninflated balloons and progresses through a series of pumps culminating in either a win, when the participant elects to add the value of the temporary bank to the persistent bank, or a loss, when the balloon pops after one too many pumps, subtracting its value from the persistent bank. In our study, the “money” gained and lost was entirely virtual; participants were paid a flat rate of $40. Use of virtual rewards is common in studies of decision under risk [Delgado et al., 2008; Fecteau et al., 2007b; Fishbein et al., 2005; Gonzalez et al., 2005; Paulus et al., 2003; Rao et al., 2008, 2010; Rogers et al., 1999].
Participants were informed of these features of the task and directed to maximize their virtual reward. They were told that the balloon could explode at any size and that larger balloons were associated with both greater risk of explosion and greater virtual reward. On each pump, they were presented with a realistic image of a balloon in the center of the screen, which increased in size with each pump, as well as with information on the balloon's current value and the money in their persistent bank; they were not explicitly informed of the maximum number of inflations (12) or the explosion probabilities. Pump timing was controlled by a small circular cue that was either red or green; participants could press a button to continue or discontinue inflation only when the color of the cue was green. Subjects pumped with the right thumb and redeemed balloons with the left. After a pump, the cue immediately turned red for an interval of random duration between 1.5 and 2.5 s, after which the cue turned green again to invite the next decision. After a win or loss, there was a jittered 2 to 4 s interval before the presentation of a new balloon. As described above, the number of balloons in a run was not fixed; rather, the duration of the run was fixed, and the number of balloons completed was determined in part by chance and in part by participants' appetite for risk. In any given scanning session, subjects completed between 19 and 59 balloons; sham and stimulated subjects did not differ on response speed (see Results). Figure 1c schematizes the design of a single trial of the BART.
Our protocol differs from the classic BART in four main ways. First, we use a picture of a balloon rather than the schematic circle used in the classic BART, for added realism. Second, while the classic BART allows a balloon to be pumped up to 120 times before popping, ours allows a maximum of 12 pumps; this modification allows subjects to complete a reasonable number of balloons given the delay between pumps, which is introduced to make imaging of separate components of the BART task feasible [Rao et al., 2008] and not present in the classic BART. Third, our BART subtracts the value of a popped balloon from the persistent bank, whereas the persistent bank is inviolate in the classic BART; this modification increases the risk attendant on pursuing large rewards. In these three respects our BART is identical to that used by Rao et al. [2008]. However, in our case the wager increased exponentially (from $0.05 at the first pump, doubling each time to $204.80 at the final pump before explosion was assured). Rao et al. [2008] used a wager schedule that increased more than linearly, but less than exponentially, whereas the wager schedule in the classic BART is linear ($0.05 per pump). We introduced this change to the wager schedule in the hopes of more strongly engaging the prefrontal and limbic systems known to respond to active BART performance, as prior work has demonstrated that those systems respond in proportion to the magnitude of a possible reward [Fukunaga et al., 2012; Rao et al., 2008, 2010; Schonberg et al, 2012].
tDCS Protocol
The tDCS protocol was modeled after Fecteau et al. [2007a], with the anode over right DLPFC and the cathode over its left counterpart (Fig. 1b). DLPFC was localized with locations F3 (left) and F4 (right) on an EEG cap laid out according to the International 10‐20 System. True stimulation lasted 15 minutes at 1.5 milliamps (mA), with an additional 30‐s ramp‐up time at the beginning of stimulation and a 30‐s ramp‐down at the end. Sham stimulation involved the same ramp‐up and ramp‐down periods with only 15 s of stimulation in between, after which subjects sat with the electrodes affixed for the remainder of the 15 m. Subjects were not told whether they had undergone true or sham stimulation. TDCS was conducted with a Magstim Eldith stimulator (Carmarthenshire, UK) and 5 × 5 cm rubber electrodes inside saline‐soaked sponges, which were affixed to the scalp with rubber straps.
Subjects were removed from the scanner for tDCS; after tDCS, the tDCS apparatus was removed from the participant's head and the participant was immediately replaced in the scanner. This necessitated an important deviation from the procedure used by Fecteau et al. [2007a], who administered tDCS during the BART, rather than before. The 3‐ to 5‐min delay between the end of tDCS and the beginning of the third ASL scan, plus the 6‐min duration of the third ASL scan, meant that 9–11 minutes elapsed between the end of tDCS and the beginning of the second BART session. 15 minutes of tDCS has been demonstrated to produce changes in cortical excitability of at least an hour's duration [Nitsche and Paulus, 2001; Nitsche et al., 2003], although these studies were done in motor cortex and have not, to our knowledge, been replicated in the dorsolateral prefrontal cortex.
Image Acquisition
Imaging was conducted on a Siemens 3T Trio whole‐body scanner (Siemens AG, Erlangen, Germany), using an 8‐channel array coil. At the beginning of the first scanning session, high‐resolution T1‐weighted anatomical images were obtained using an MPRAGE sequence (TR = 1,620 ms, TI = 950 ms, TE = 3 ms, flip angle = 15°, 160 contiguous slices of 1.0 mm thickness, in‐plane resolution 1 mm × 1 mm) while the subject performed training trials of the BART. Conventional BOLD images were acquired using a standard echo‐planar imaging sequence (TR = 1,500 ms, TE = 30 ms, flip angle = 90°, 25 interleaved axial slices with 5 mm thickness, in‐plane resolution 3.44 mm × 3.44 mm), identical to Rao et al. [2008]. ASL images were acquired using a pseudo‐continuous ASL sequence based on gradient‐echo echoplanar imaging [Chen et al., 2011; Dai et al., 2008; Wu et al., 2007] with the following parameters: TR = 4 s, TE = 17 ms, flip angle = 90°, FOV = 22 cm, matrix = 64 × 64, labeling time = 1.5 s, postlabeling delay = 1.2 s, 18 axial slices with 6 mm thickness and 1.2 mm gap, in‐plane resolution 3.44 mm × 3.44 mm.
Analysis of Behavioral Results
We entered several behavioral variables into a two‐factor mixed ANOVA with factors Group (between subjects; true vs. sham tDCS, coded V [“verum”] vs. S below) and time (within subjects, before vs. after tDCS, coded T1 vs. T2 below). The dependent variables were total number of balloons, total number of wins, percentage wins, mean pumps per balloon, mean pumps per winning balloon [“adjusted pumps” in Fecteau et al., 2007a], and total earnings. Our statistic of interest was the group × time interaction, which would reveal whether tDCS affected the change in a variable's value over time.
Image Analysis
We used AFNI [Cox, 1996] to motion‐correct and spatially normalize the resting ASL and task‐related BOLD functional images, and to skull‐strip and spatially normalize the anatomical images. Functional and anatomical images were normalized to the Colin brain template in Talairach space at 2 × 2 × 2‐mm resolution. After normalization, functional images were blurred with an 8‐mm full‐width at half max Gaussian kernel.
We extracted the BOLD contrast from the resting ASL images by regressing out a binary covariate that alternated with each TR; this regressor coded the presence or absence of the labeling pulse in the tagged ASL scans. The residuals of this regression yield BOLD contrast. We refer to these images as “ABC” (ASL with BOLD contrast) to distinguish them from the cerebral blood flow (CBF) images computed from the ASL scans, as well as from the task‐related BOLD scans.
Difference images for the quantification of CBF from the ASL data were generated by simple subtraction from the raw ASL scans [Aguirre et al., 2002]; CBF was calculated by the method of Wang et al. [2003]. For each of the four ASL scans administered to each subject, images with a global mean CBF more than three standard deviations away from that scan's mean were censored and a mean CBF image was calculated from the remaining images. We then calculated relative CBF (rCBF) by dividing each voxel's mean CBF by all intracranial voxels' mean CBF to control for global scan‐to‐scan variation. The FMRIB Automated Segmentation Tool (FAST) [Zhang et al., 2001] was used to segment the skull‐stripped anatomical into grey matter, white matter, and cerebrospinal fluid (CSF); voxels were designated as white matter or CSF if the FAST output indicated 100% confidence in that designation.
Following Rao et al. [2008], we used multiple regression on the task‐related BOLD images to measure each subject's reactivity to risk, losses, and wins. Binary regressors encoding losses and wins and a parametric regressor encoding risk were convolved with a canonical double gamma hemodynamic response function and entered into a general linear model (GLM); risk was quantified by the amount of money subjects stood to win or lose (ranging from $0.05 at the first pump to $204.80 at the final possible pump), mean‐centered over each BART run. Every decision (to pump or to cash out) was thus represented in one of the three regressors: Non‐losing pumps in risk, losing pumps in losses, and cash‐outs in wins. Motion estimates, linear through fifth‐degree polynomial terms (following the recommendation issued by AFNI), and mean signal intensity from white matter and CSF were entered as covariates of no interest. Following Rao et al. [2008], “activation” for risk, losses, or wins simply refers to the coefficient of the corresponding regressor (not, e.g., a contrast with the others).
At the group level, we first conducted whole‐brain t‐tests against zero for risk, loss, and win conditions (collapsing across both Group and Time) in order to assess how well we replicated the results of Rao et al. [2008]. To examine the effects of tDCS, we conducted whole brain analyses as well as ROI analyses for the seven regions identified in Rao et al. [2008] as responsive to active rather than passive risk: bilateral dorsolateral PFC, bilateral striatum, bilateral insula, and one region of anterior cingulate cortex (see Table 1 for coordinates of central voxels). We were particularly interested in these regions because their activation survives a contrast against the passive BART, which is equivalent in a sensorimotor sense but involves no decision under risk [Rao et al., 2008]. For any given ROI and regressor, we took the average coefficients for that regressor within a 4‐voxel‐radius sphere (257 voxels) around the peak reported in Rao et al. [2008] and entered them into a two‐factor mixed ANOVA identical to that applied to the behavioral variables. Mean resting rCBF in each ROI was entered into another such ANOVA.
Table 1.
ROI locations
| ROI | x | y | z |
|---|---|---|---|
| Right ACC | 12 | 18 | 38 |
| Right striatum | 12 | 4 | 4 |
| Left striatum | −8 | 0 | 4 |
| Right insula | 36 | 16 | 0 |
| Left insula | −28 | 18 | 6 |
| Right DLPFC | 32 | 46 | 26 |
| Left DLPFC | −32 | 46 | 22 |
ROIs were defined as spheres with a 4‐voxel (8 mm) radius around the peaks of clusters reported in Rao et al. [2008] as more active in response to actively chosen versus passive risk.
Identical ANOVAs were also run for each of these four conditions (risk, loss, win, resting rCBF) on a whole‐brain basis. To determine the reliability of the clusters we observed, we ran 10,000 simulations using AFNI's 3dClustSim tool, which calculates the minimum cluster size for statistical significance given an intracranial volume, a smoothing kernel, and a statistical threshold. Setting our statistical threshold to P < 0.005 determined that a cluster of 151 voxels would emerge from noise with P < 0.05.
Finally, we examined resting‐state functional connectivity with a graph‐theoretic approach, described in detail below. For this analysis, we concatenated the two pre‐stimulation resting ABC scans (normalized and blurred as described above) into a single time course with 168 volumes, and likewise with the post‐stimulation resting ABC scans. We divided the brain into 66 ROIs using the AFNI Talairach atlas and used ANTs [Avants et al., 2010] to extract the time course from the grey matter in each ROI. ROI time courses were bandpass filtered to retain frequencies between 0.02 and 0.1 Hz, and the correlation between each pair of ROI time courses was computed to generate a 66 × 66 correlation matrix. Each subject's data gave rise to two such matrices, one pre‐ and one poststimulation.
Graph Analysis
We transformed correlation matrices into adjacency matrices by applying a minimum correlation threshold, with an edge defined between two regions if the correlation between their filtered time courses was at least equal to that threshold. We then examined six centrality metrics (betweenness, closeness, coreness, degree, efficiency, and eigenvector centrality) in the ROIs corresponding to the BART network (bilateral middle frontal gyrus, insula, and putamen; right cingulate gyrus). The higher a region's node centrality, the stronger its connectivity to the rest of the brain [Bonacich, 1972, 2007]. We also examined four graph‐wide metrics (efficiency, clustering coefficient, characteristic path length, and small‐worldness). These metrics measure efficiency of information transmission and community structure. Betweenness, closeness, coreness, degree, and eigenvector centrality were calculated with the R package igraph [Csardi and Nepusz, 2006]; the other graph metrics were calculated with the R package brainwaver [Achard et al., 2006]. In each case, we submitted the resulting graph metric or node centrality metric to the same ANOVA described above. These analyses were repeated for correlation thresholds ranging from 0 to 0.7, in increments of 0.01. For similar approaches, see Supekar et al. [2008], Liu et al. [2008], and Liang et al. [2012].
As a follow‐up analysis, we quantified the relationship between the ROIs' whole‐brain connectivity and risk‐seeking by calculating the correlation coefficient between MAP and eigenvector centrality in each ROI at each correlation threshold.
Results
Replication—fMRI
We replicated the results of Rao et al. [2008] in some detail (Fig. 2). We treat the three conditions—risk, wins, and losses—separately below.
Figure 2.
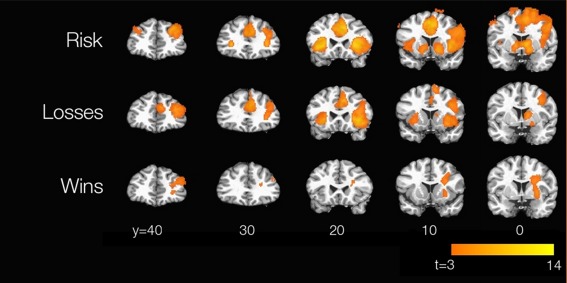
Replication of Rao et al. [2008]. Brain maps were thresholded at P < 0.005 with a minimum cluster size of 151 voxels. t scores quantifying subjects' responses to parametric risk, losses, and wins are displayed. [Color figure can be viewed in the online issue, which is available at http://wileyonlinelibrary.com.]
Our subjects strongly replicate the observations of Rao et al. [2008] for activity in response to active risk (i.e., risk chosen, rather than merely observed, by the subject). Striatum, anterior cingulate, anterior insula, and bilateral DLPFC are strongly active in both experiments. Likewise, we too see activations in regions that responded to risk regardless of whether it was active or passive, notably inferotemporal and posterior parietal cortices bilaterally (not shown). Our results also replicate the qualitative finding of Rao et al. [2008] that activity in right DLPFC was stronger and more widespread than activity in its left‐lateralized counterpart; indeed, at more stringent statistical thresholds, left DLPFC response to parametric risk drops out entirely.
Rao et al. [2008] do not report activations for active losses or active wins on their own, but only in comparison with the counterpart passive condition. Thus, it is not surprising that we find activations for, e.g., active losses, that they do not find for active vs. passive loss; however, it might be surprising if we fail to find activation that survived that more stringent contrast in their results. Our loss activations are nearly a superset of theirs, including the ACC as well as right‐sided activity in DLPFC, insula, and caudate; however, we do not find loss‐related activity in the left caudate, as they do. For wins, we find right DLPFC activation similar to theirs, but not ACC activation. To see whether these effects might have been extinguished by tDCS, we repeated the analysis in sham subjects only, but in neither case did the sham subjects show the expected activation (data not shown). However, our results capture the main features of those documented by Rao et al. [2008], namely the strong involvement of PFC, insula, and striatum in processing active risk, and the consistent role of right DLPFC in processing risk, losses, and wins.
Analysis of Behavior
No behavioral variable showed a main effect of group or a group × time interaction. Several variables showed main effects of Time: At T2, subjects in both groups earned more and pumped more, both overall and on winning balloons, consistent with Fecteau et al. [2007a]. They also completed fewer balloons at T2 [inapplicable in Fecteau et al., 2007a, where subjects completed a fixed number of balloons]. They won fewer times numerically at T2, but not as a proportion of total balloons. Analyses breaking down the results within T1 and T2 periods yielded much the same conclusions; subjects earned more, pumped more per winning balloon, and won fewer times as a percentage of balloons over time in any given BART run, but no interaction with Group was observed. Although the mean number of adjusted pumps (MAP) increased over time, it was nonetheless stable across subjects, with intraclass correlation coefficients of r = 0.83 (P = 0.002) in the stimulated group and r = 0.90 (P = 0.0002) in the sham group; these two correlations did not differ on a test for the difference between independent correlations, as implemented in the R package psych [P = 0.57; Cohen and Cohen, 1983].
Results From Task‐Related Activation
Figure 3 presents a graphical summary of ROI positions and results from the ROI analysis. In these seven ROIs, we observed significant interactions only for losses, and only in right DLPFC and ACC (F (1,20) = 5.04 and 5.51 respectively, P = 0.036 and 0.029). The groups differ in ACC activation at T1 (t (20) = −2.15, P = 0.04) but not T2 (t (20) = 0.61, P = 0.55), suggesting that the observed interaction at this site is due to prestimulation differences. Right DLPFC shows the opposite pattern, with subjects indistinguishable at T1 (t (20) = −0.91, P = 0.38) but different at T2 (t (20) = 2.58, P = 0.02).
Figure 3.
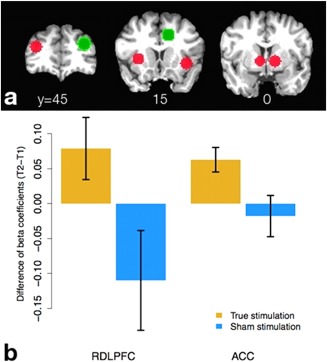
Results of ROI analysis. (a) ROIs examined. Green ROIs represent the right DLPFC and ACC ROIs in which we found a significant group × time interaction; red ROIs were examined but showed no such effect. (b) Graphs of differences in activation (T2−T1) for losses in right DLPFC and ACC ROIs. Blue bars denote sham subjects, yellow bars stimulated subjects. [Color figure can be viewed in the online issue, which is available at http://wileyonlinelibrary.com.]
Results from the whole‐brain analysis are summarized in Table 2. It should be clear that the statistics presented there are biased in that they are computed over regions selected to show differences—that is, since the ROIs were defined as contiguous sets of voxels showing a group × time interaction, the fact that the simple effect of Group varies over Time is only to be expected, and any effect size estimates originating from ROIs so defined would be inflated [Kriegeskorte et al., 2009; Vul et al., 2009]. However, as the ROI analysis shows, there can be meaningful differences between activation profiles that exhibit the same sign on the contrast term; the cluster statistics are used to communicate a qualitative sense of these differences, particularly important in those cases where the interaction is driven by pre‐stimulation differences only. The P values for simple effects are computed as in the ROI analysis above, i.e. derived from a t‐test on the 11 truly stimulated (V) and 11 sham (S) subjects at a given time point.
Table 2.
Clusters from group × time interaction contrast
| Region | x | y | z | Cluster size | More active group at T1 | More active group at T2 |
|---|---|---|---|---|---|---|
| (VT2–VT1) > (ST2–ST1) | ||||||
| Loss | ||||||
| Right DLPFC | 31 | 37 | 24 | 223 | S (P = 0.0003) | V (P = 0.01) |
| Right IPL | 49 | −43 | 40 | 199 | S (P = 0.02) | V (P = 0.02) |
| Win | ||||||
| Left MOG | −37 | −75 | 0 | 165 | − (P = 0.49) | − (P = 0.09) |
| (ST2–ST1) > (VT2–VT1) | ||||||
| Loss | ||||||
| Left cuneus | −7 | −77 | 20 | 559 | V (P = 0.03) | − (P = 0.14) |
| Right lingual gyrus | 15 | −63 | −2 | 412 | V (P = 0.05) | − (P = 0.30) |
| Win | ||||||
| Left SPL | −33 | −45 | 58 | 238 | V (P = 0.003) | S (P = 0.03) |
| Resting rCBF | ||||||
| Right caudate | 15 | 21 | 12 | 843 | − (P = 0.53) | S (P = 0.0002) |
| Left STG | −55 | −17 | 12 | 485 | − (P = 0.09) | − (P = 0.07) |
| Left MTG | −53 | −63 | 2 | 425 | − (P = 0.20) | S (P = 0.02) |
| Medial OFC | −3 | 53 | −12 | 311 | V (P = 0.03) | S (P = 0.03) |
| Right OFC | 19 | 69 | 10 | 245 | V (P = 0.005) | − (P = 0.57) |
| Right OFC | 29 | 27 | −8 | 230 | − (P = 0.17) | S (P = 0.005) |
| Left OFC | −47 | 39 | −2 | 201 | − (P = 0.12) | S (P = 0.03) |
Cluster locations, peaks and sizes for the group × time interaction, task‐related BOLD effects. The code for the top group of activations can be read as “The difference between post‐ and prestimulation activity is greater in stimulated than sham subjects,” and the reverse for the second. All clusters were thresholded at P < 0.005 with a minimum cluster size of 151 voxels. Peaks are reported in Talairach coordinates. “More active group at T1/T2” signifies which group is more active, quantified by the simple effect of Group at the given Time; V denotes stimulated subjects, S denotes sham.
The principal result of interest from the whole‐brain analysis of task‐related activation is the replication of our ROI result in DLPFC (Table 2, Fig. 4). Various other regions in the occipital, temporal, and parietal cortices also show tDCS‐related changes in task‐related activation. Those regions are not near the stimulation sites and, because they do not survive a contrast between the active and passive versions of the BART [Rao et al., 2008], we have no evidence that they play a role in decision under risk over and above their sensorimotor functions; we thus have not visualized them and do not analyze them further.
Figure 4.
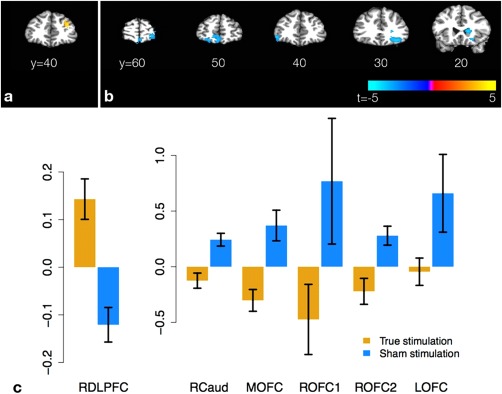
Selected results from whole‐brain analyses of task‐related activation and resting perfusion. The t score of the contrast for the group × time interaction is displayed, with hot colors signifying (VT2−VT1) > (ST2−ST1) and cool colors the opposite. Clusters are thresholded at P < 0.005 with a minimum cluster size of 151 voxels. (a) Interaction contrast for task‐related activation in response to losses for right DLPFC; (b) interaction contrast for resting rCBF in caudate and OFC. (c) Graphs of differences in activation or rCBF (T2−T1) in displayed clusters. Blue bars denote sham subjects, yellow bars stimulated subjects. [Color figure can be viewed in the online issue, which is available at http://wileyonlinelibrary.com.]
Results From Resting ASL Data
None of the seven ROIs taken from Rao et al. [2008] showed a significant Group × Time interaction in resting rCBF. In the whole‐brain analysis, we observed suppression of resting rCBF by tDCS in the right caudate and medial and right OFC (Fig. 4). The latter regions are widely known to be intimately involved in reward processing. We also found similar interactions in left superior and middle temporal gyri.
Results From Network Analysis of Resting‐State BOLD Data Derived From ASL
In the network analysis, eigenvector centrality of the right cingulate gyrus [corresponding to the right ACC ROI from Rao et al., 2008] showed a significant group × time interaction over a number of correlation thresholds, with truly stimulated subjects showing relative disconnection of this region post‐stimulation (Fig. 5). Eigenvector centrality differs from the other centrality metrics in that it is raised not only by the number of connected nodes, but also the connectivity of those nodes; nodes with high eigenvector centrality are usually connected to other highly central nodes [Bonacich, 1972, 2007]. Whole‐brain connectivity in the same region was positively correlated with risk‐seeking as quantified by MAP over a wide range of thresholds as well (green dots in Fig. 5).
Figure 5.
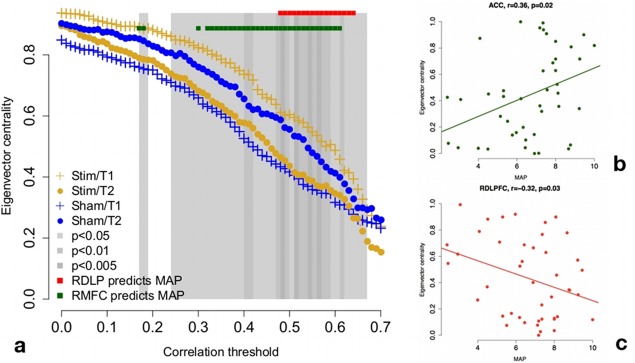
Results of graph‐theoretic analyses. (a) Whole‐brain connectivity for right ACC at correlation thresholds from 0 to 0.7 (x‐axis). Dots quantify group mean eigenvector centrality within time point; error bars are omitted for ease of reading. There is a significant group × time interaction across a wide range of thresholds, with truly stimulated subjects showing relative disconnection of right ACC from the rest of the brain at T2. Whole‐brain connectivity of right ACC is positively correlated with risk‐seeking at a wide range of correlation thresholds (green dots). Whole‐brain connectivity of right DLPFC is negatively correlated with risk‐seeking at a relatively narrow range of correlation thresholds (red dots), approximately overlapping the range in which the group × time interaction is most reliable. (b) Correlation between whole‐brain ACC connectivity and MAP at a correlation threshold of 0.55. (c) Correlation between whole‐brain RDLPFC connectivity and MAP at a correlation threshold of 0.55. [Color figure can be viewed in the online issue, which is available at http://wileyonlinelibrary.com.]
Eigenvector centrality of the right middle frontal gyrus (corresponding to right DLPFC) was negatively correlated with risk‐seeking at correlation thresholds between approximately 0.5 and 0.6 (red dots in Fig. 5). Interestingly, this overlaps well with the range of thresholds at which the disconnection effect of the right cingulate by tDCS is strongest.
Figure 5 does reveal that the group × time interaction is a crossover—there appear to be group differences at both T1 and T2, in the opposite direction. We have no a priori reason to expect group differences in node centrality of the ACC at T1, and it may be that the treatment effect (as quantified by the group × time interaction) was inflated by this chance difference in a small sample. However, the positive correlation between ACC centrality and risk tolerance (Fig. 5b) is consistent with a treatment effect disconnecting ACC, particularly since other studies have shown that the tDCS treatment reduces risk tolerance [Fecteau, 2007a, 2007b].
DISCUSSION
Summary of Principal Findings
We replicated most of the hemodynamic signatures of active participation in the BART reported by Rao et al. [2008], notably the responsiveness of right DLPFC to losses, wins, and increasing risk. Our fMRI results indicate an effect of bifrontal tDCS on task‐related brain activity and resting connectivity. In our ROI analysis, we saw that tDCS amplified the brain's response to losses in right DLPFC and ACC. Our whole‐brain analysis recapitulated this result in right DLPFC but not right ACC. The whole‐brain analysis also uncovered tDCS‐related decreases in resting rCBF in the OFC and right caudate, as well as various effects on resting and task‐related BOLD in posterior cortices. Finally, network analyses revealed that whole‐brain connectivity was positively correlated with MAP in right ACC and negatively correlated with MAP in right DLPFC, and that tDCS reduced connectivity between the right ACC and the rest of the brain. Thus, it appears that prefrontal tDCS can affect both activity and resting connectivity in brain regions outside the stimulated sites—including regions known to be implicated in valuation and choice.
However, although we observed tDCS‐related changes in task‐related brain activation, resting perfusion, and functional connectivity, we did not observe an effect of tDCS on BART performance, as was previously reported by Fecteau et al. [2007a]. Subjects undergoing true bifrontal tDCS were not distinguishable from those undergoing sham tDCS on any behavioral metric tested. We suspect that this null result is due to differences in task parameters. We replicate the results of Rao et al. [2008] in evoking robust prefrontal and limbic activation in response to risk, losses, and wins (Fig. 2), suggesting that our version of the BART successfully engages the same brain systems that theirs did. However, the adaptation of the paradigm for imaging results in a relative paucity of behavioral data that may reduce our sensitivity to individual differences in risk tolerance relative to the classic version [Lejuez et al., 2002], which Fecteau et al. [2007a] demonstrated to be sensitive to bifrontal tDCS. Notably, as a fraction of the range of possible pumps, the approximately 10‐pump effect observed in Fecteau et al. [2007a] is equivalent to one pump in our study; our effects might thus be more vulnerable to noise. Additionally, the nonlinearity of the reward schedule may have pushed subjects to concentrate in a certain part of the 12‐pump range irrespective of tDCS.
DLPFC Findings
Our tDCS protocol has been reported to increase risk aversion [Fecteau et al., 2007a], although we did not observe this effect. However, we did observe that loss‐related DLPFC activity during the BART was sensitive to tDCS, and that resting connectivity of DLPFC was negatively correlated with MAP, although that association was unaltered by tDCS. We discuss these two effects in turn.
In our BART protocol, loss‐related and risk‐related activity differs only in terms of outcome; the choice (to pump the balloon rather than to collect winnings) is identical in both cases. Thus, our observation of a tDCS effect for losses but not risk implies a greater reactivity in response to the outcome rather than the choice. In the literature on DLPFC and decision under risk, DLPFC is variously described as supporting working memory for the decision task [Clark et al., 2003; Fellows and Farah, 2005; Manes et al., 2002], sending sensory and mnemonic information to OFC [Camus et al., 2009; Knoch et al., 2006; but see Fecteau et al., 2007a], and integrating reward information with sensory and decision‐related information [Kim and Shadlen, 1999; Rao et al., 2008; Tanaka et al., 2004; Taylor et al., 2004; Wallis and Miller, 2003; Weber and Huettel, 2008]. Thus, our observations may be of some interest for understanding the neurobiology of value‐based decision making.
Although it is unmodulated by tDCS, the negative correlation between MAP and resting whole‐brain connectivity in the right DLPFC is also consistent with the previously cited lesion and stimulation work; the more central the right DLPFC is in the network produced by inter‐regional correlations at rest, the fewer pumps our subjects are willing to make (Fig. 5c).
ACC Findings
The ACCs relationship to decision making has also been extensively studied, with multiple theories about its functional role on offer. Different accounts of ACC function hold that ACC generates a conflict signal that flags the need for more cognitive control [Botvinick et al., 2004; Carter and van Veen, 2007] and, alternatively, that ACC evaluates action outcomes and encodes action‐reward associations [Rushworth et al., 2007, 2011]. Along the latter lines, animals with ACC lesions are less inclined than controls to sustain responses known to be rewarding, and are much more inclined than controls to choose a small reward requiring little effort in preference to a large reward requiring more effort [Kennerley et al., 2006; Walton et al., 2003, 2002, 2006, 2007]. Likewise, ACC activity tracks reward magnitude discounted by effort [Croxson et al., 2009]. Thus, the observed effects of tDCS on the ACC's reactivity to losses and its centrality in the network of inter‐regional resting correlations might be of some interest for understanding the neurobiology of value‐based decision making.
OFC and Striatal Findings
The reduction of resting perfusion in OFC and caudate may also be relevant in interpreting the behavioral results from brain stimulation studies of DLPFC. OFC may integrate value information computed in amygdala and ventral striatum with working memory representations supported by lateral PFC [McDannald et al., 2011; Schoenbaum and Esber, 2010; Schoenbaum et al., 2006; Takahashi et al., 2011], and the caudate is critical for integrating sensory and value information and acquiring action‐outcome associations [Hassani et al., 2001; Kawagoe et al., 1998, 2004; Yin et al., 2005]. Our results emphasize the importance of frontal‐frontal and frontal‐striatal connections for understanding the DLPFCs involvement in value‐based decision making.
Although we saw no modulation of task‐related activity in OFC and caudate, tDCS might have reduced the absolute level of activity in those regions without reducing the activity's covariation with task variables. Additionally, OFC activation can be difficult to detect in BOLD data due to the static susceptibility gradients in this region, whereas the ASL sequence utilizes a shorter echo time and the CBF calculation does not depend on susceptibility contrast [Detre et al., 2012]. Thus, tDCS effects on OFC may have been detectable in CBF quantified from ASL data, but not in the BOLD scans. Interestingly, Schonberg et al. [2012] observe that OFC activity is negatively correlated with risk and losses in the BART, and infer that OFC may code the decreasing marginal expected value of each successive pump. We observe those same negative correlations, as well as a similar one for wins, in task‐related BOLD (data not shown), although they are unmodulated by tDCS.
Other Effects and Future Work
These conjectures on the functional effects of tDCS on reward‐related neuroanatomy do not explain the effects we observe in posterior cortices. It is notable that these effects overlap or abut sites characterized in Rao et al. [2008] as responsive to risk but indifferent to whether the risk was chosen or merely viewed. Given this indifference, and the fact that risk has a reliable sensory correlate in our task (namely the size of the balloon), these sites most likely handle sensory aspects of the BART rather than valuation and choice; their modulation by tDCS is likely due to alterations in top‐down input from reward‐related regions.
Future work should address the physiology of the DLPFC‐ACC and DLPFC‐OFC interactions underlying these brain dynamics, as well as the details of the relationship between whole‐brain ACC and DLPFC connectivity and risk aversion. In light of our results, it would be particularly interesting to distinguish between accounts of tDCS‐induced risk aversion that appeal to increased uncertainty about outcomes (suggested by the drop in resting rCBF in OFC) versus increased aversion to cognitive effort (suggested by the association between risk‐seeking and whole‐brain connectivity in ACC).
Connection to Theories of Decision Under Risk
Like the work of Rao et al. [2008, 2010], our work was not intended to arbitrate among competing theories of decision under risk (e.g., expected utility theory vs. prospect theory); indeed, these theories apply principally to contexts in which the risk is known, whereas in our task the explosion probabilities were unknown and had to be learned. Rather, our study's main goal was to suggest neural mechanisms for the already documented effect of bifrontal tDCS on risky choice. Accordingly, our measure of risk tolerance elides several theoretically distinct definitions of risk; the value of the balloon, the variance of the reward, and the probability of a loss are all extremely strongly correlated (r = 0.81–0.99, all P < 0.003). Future work should attempt to elucidate which particular representation of risk is altered by tDCS.
Graph Centrality Measures
Eigenvector centrality was the only measure of brain connectivity that was affected by tDCS across a large range of correlation thresholds. It is also arguably a better measure of a brain region's influence on overall brain activity than measures such as betweenness, closeness, and degree, as these metrics are insensitive to the connectivity of a node's neighbors—e.g., a node with n neighbors has the same degree regardless of whether its neighbors are themselves strongly or weakly connected. In contrast, a node's eigenvector centrality is higher when its neighbors are themselves strongly connected [Bonacich, 1972, 2007]. Future studies on methods for network analysis should evaluate this centrality measure more thoroughly.
Limitations
Because the design required continuous inflations and featured very brief intervals separating stimulus, response and outcome, it was not possible to make fine dissociations between the stages of processing a given pump—for example, stimulus valuation, action selection, and outcome evaluation [Rangel et al., 2008]. In particular, it is impossible to separate decision‐related activity from outcome‐related activity in the BOLD time course. However, other design features of the experiment go some distance toward compensating for this problem. In the case of a win, the outcome is certain: There is no information about the outcome that is not already known at the moment of decision, and thus no point in dissociating the two. In the case of losses versus nonlosing pumps, the outcome does furnish new information, but the decision and corresponding action are the same; the only difference between a loss and a nonlosing pump is outcome, and thus differences in activation are informative about differences in outcome.
However, the chronometry of these different aspects of decision‐making and outcome evaluation is still of great theoretical interest. Future studies might employ a longer ISI and delayed feedback to facilitate parsing of these stages of the task.
Another limitation of our study is the use of a single bifrontal montage (anode over right DLPFC, cathode over left) when the results of Fecteau et al. [2007] indicate that similar behavioral effects were achieved with the same montage when the polarities of the electrodes were switched. This curious pattern makes it all the more important to understand the role of sites distal to the electrodes; perhaps these seemingly opposite montages have opposite effects on the stimulated cortices, but common effects on distal sites to which the stimulated cortices are strongly connected. Our work would seem to implicate ACC, OFC, and striatum as candidate sites for such common effects. However, without observing the effects of the opposite montage, this prospect remains speculative.
CONCLUSION
Our findings provide evidence that bilateral tDCS to DLPFC alters brain function in several ways that may underlie the increased risk aversion consequent to bifrontal tDCS that have been observed in behavioral studies. Bifrontal tDCS appears to selectively amplify the representation of losses in right DLPFC and ACC, disconnect right ACC from the rest of the brain via connections from right DLPFC, and reduce resting rCBF in OFC and the right caudate, again likely via connections from right DLPFC. Prior literature suggests that the disconnection of ACC may reduce the impetus to maintain rewarding responses and exert cognitive effort in pursuit of greater rewards, and that hypoactivity in OFC and the right caudate may impair subjects' ability to update associations between value and sensory or mnemonic information. However, direct relationships between behavior and tDCS‐related changes in brain activity must be observed before these possibilities can be confirmed. Our results also underscore the important point that tDCS may alter brain activity, not only in the stimulation sites, but also in connected, task‐relevant regions of the brain.
ACKNOWLEDGMENTS
The authors thank Branch Coslett, Roy Hamilton, and David Wolk for assistance with tDCS; Brian Avants for assistance with ANTs; Marc Korczykowski, Tanya Kurtz, Jacqueline Meeks, Patricia O'Donnell, and Joan Sparano for assistance with scanning; and three anonymous reviewers for their thoughtful criticism and suggestions. David Wolk and the Thompson‐Schill lab provided useful discussion and guidance. Samuel Messing is currently employed at Google.
REFERENCES
- Achard S, Salvador R, Whitcher B, Suckling J, Bullmore E (2006): A resilient, low‐frequency, small‐world human brain functional network with highly connected association cortical hubs. J Neurosci 26:63–72. [DOI] [PMC free article] [PubMed] [Google Scholar]
- Aguirre GK, Detre JA, Zarahn E, Alsop DC (2002): Experimental design and the relative sensitivity of BOLD and perfusion fMRI. Neuroimage 15:488–500. [DOI] [PubMed] [Google Scholar]
- Antal A, Polanía R, Schmidt‐Samoa C, Dechent P, Paulus W (2011): Transcranial direct current stimulation over the primary motor cortex during fMRI. Neuroimage 55:590–596. [DOI] [PubMed] [Google Scholar]
- Antal A, Kovács G, Chaieb L, Cziraki C, Paulus W, Greenlee MW (2012): Cathodal stimulation of human MT+ leads to elevated fMRI signal: A tDCS‐fMRI study. Restor Neurol Neurosci 30:255–263. [DOI] [PubMed] [Google Scholar]
- Avants BB, Tustison NJ, Song G, Cook PA, Klein A, Gee JC (2010): A reproducible evaluation of ANTs similarity metric performance in brain image registration. Neuroimage 54:2033–2044. [DOI] [PMC free article] [PubMed] [Google Scholar]
- Baudewig J, Nitsche MA, Paulus W, Frahm J (2001): Regional modulation of BOLD MRI responses to human sensorimotor activation by transcranial direct current stimulation. Magn Reson Med 45:196–201. [DOI] [PubMed] [Google Scholar]
- Bonacich P (1972): Factoring and weighting approaches to clique identification. J Math Sociol 2:113–120. [Google Scholar]
- Bonacich P (2007): Some unique properties of eigenvector centrality. Soc Netw 29:555–564. [Google Scholar]
- Botvinick MM, Cohen JD, Carter CS (2004): Conflict monitoring and anterior cingulate cortex: An update. Trends Cogn Sci 8:539–546. [DOI] [PubMed] [Google Scholar]
- Brand M, Labudda K, Markowitsch HJ (2006): Neuropsychological correlates of decision‐making in ambiguous and risky situations. Neural Netw 19:1266–1276. [DOI] [PubMed] [Google Scholar]
- Camus M, Halelamien N, Plassmann H, Shimojo S, O'Doherty J, Camerer C, Rangel A (2009): Repetitive transcranial magnetic stimulation over the right dorsolateral prefrontal cortex decreases valuations during food choices. Eur J Neurosci 30:1980–1988. [DOI] [PubMed] [Google Scholar]
- Carter CS, van Veen V (2007): Anterior cingulate and conflict detection: An update of theory and data. Cogn Affect Behav Neurosci 7:367–379. [DOI] [PubMed] [Google Scholar]
- Chen Y, Wang DJ, Detre JA (2011): Test‐retest reliability of arterial spin labeling with common labeling strategies. J Magn Reson Imaging 33:940–949. [DOI] [PMC free article] [PubMed] [Google Scholar]
- Clark L, Manes F, Antoun N, Sahakian BJ, Robbins TW (2003): The contributions of lesion laterality and lesion volume to decision‐making impairment following frontal lobe damage. Neuropsychologia 41:1474–1483. [DOI] [PubMed] [Google Scholar]
- Cohen J, Cohen P (1983): Applied Multiple Regression/Correlation Analysis for the Behavioral Sciences. Hillsdale, NJ: Erlbaum. [Google Scholar]
- Cox RW (1996): AFNI: Software for analysis and visualization of functional magnetic resonance neuroimages. Comput Biomed Res 29:162–173. [DOI] [PubMed] [Google Scholar]
- Croxson PL, Walton ME, OReilly JX, Behrens TEJ, Rushworth MFS (2009): Effort‐based cost‐benefit valuation and the human brain. J Neurosci 29:4531–4541. [DOI] [PMC free article] [PubMed] [Google Scholar]
- Csardi G, Nepusz T (2006): The igraph software package for complex network research. Int J Complex Syst 1695, 1–9. [Google Scholar]
- Dai W, Garcia D, de Bazelaire C, Alsop DC (2008): Continuous flow‐driven inversion for arterial spin labeling using pulsed radio frequency and gradient fields. Magn Reson Med 60:1488–1497. [DOI] [PMC free article] [PubMed] [Google Scholar]
- Delgado MR, Schotter A, Ozbay EY, Phelps EA (2008): Understanding overbidding: using the neural circuitry of reward to design economic auctions. Science 321:1849–1852. [DOI] [PMC free article] [PubMed] [Google Scholar]
- Detre JA, Alsop DC (1999): Perfusion magnetic resonance imaging with continuous arterial spin labeling: methods and clinical applications in the central nervous system. Eur J Radiol 30:115–124. [DOI] [PubMed] [Google Scholar]
- Detre JA, Rao H, Wang DJJ, Chen YF, Wang Z (2012): Applications of arterial spin labeled MRI in the brain. J Magn Reson Imaging 35:1026–1037. [DOI] [PMC free article] [PubMed] [Google Scholar]
- Egan MF, Goldberg TE, Kolachana BS, Callicott JH, Mazzanti CM, Straub RE, Goldman D, Weinberger DR (2001): Effect of COMT Val108/158 Met genotype on frontal lobe function and risk for schizophrenia. Proc Natl Acad Sci USA 98:6917–6922. [DOI] [PMC free article] [PubMed] [Google Scholar]
- Fecteau S, Pascual‐Leone A, Zald DH, Liguori P, Théoret H, Boggio PS, Fregni F (2007a): Activation of prefrontal cortex by transcranial direct current stimulation reduces appetite for risk during ambiguous decision making. J Neurosci 27:6212–6218. [DOI] [PMC free article] [PubMed] [Google Scholar]
- Fecteau S, Knoch D, Fregni F, Sultani N, Boggio P, Pascual‐Leone A (2007b): Diminishing risk‐taking behavior by modulating activity in the prefrontal cortex: A direct current stimulation study. J Neurosci 27:12500–12505. [DOI] [PMC free article] [PubMed] [Google Scholar]
- Fellows LK, Farah MJ (2005): Different underlying impairments in decision‐making following ventromedial and dorsolateral frontal lobe damage in humans. Cereb Cortex 15:58–63. [DOI] [PubMed] [Google Scholar]
- Fishbein DH, Eldreth DL, Hyde C, Matochik JA, London ED, Contoreggi C, Kurian V, Kimes AS, Breeden A, Grant S (2005): Risky decision making and the anterior cingulate cortex in abstinent drug abusers and nonusers. Cognit Brain Res 23:119–136. [DOI] [PubMed] [Google Scholar]
- Fukunaga R, Brown JW, Bogg T (2012): Decision making in the Balloon Analogue Risk Task (BART): Anterior cingulate cortex signals loss aversion but not the infrequency of risky choices. Cogn Affect Behav Neurosci 12:479–490. [DOI] [PMC free article] [PubMed] [Google Scholar]
- Gläscher J, Adolphs R, Damasio H, Bechara A, Rudrauf D, Calamia M, Paul LK, Tranel D (2012): Lesion mapping of cognitive control and value‐based decision making in the prefrontal cortex. Proc Natl Acad Sci USA 109:14681–14686. [DOI] [PMC free article] [PubMed] [Google Scholar]
- Gonzalez C, Dana J, Koshino H, Just M (2005): The framing effect and risky decisions: Examining cognitive functions with fMRI. J Econ Psychol 26:1–20. [Google Scholar]
- Hassani OK, Cromwell HC, Schultz W (2001): Influence of expectation of different rewards on behavior‐related neuronal activity in the striatum. J Neurophysiol 85:2477–2489. [DOI] [PubMed] [Google Scholar]
- Holland R, Leff AP, Josephs O, Galea JM, Desikan M, Price CJ, Rothwell JC, Crinion J (2011): Speech facilitation by left inferior frontal cortex stimulation. Curr Biol 21:1403‐1407. [DOI] [PMC free article] [PubMed] [Google Scholar]
- Jang SH, Ahn SH, Byun WM, Kim CS, Lee MY, Kwon YH (2009): The effect of transcranial direct current stimulation on the cortical activation by motor task in the human brain: An fMRI study. Neurosci Lett 460:117. [DOI] [PubMed] [Google Scholar]
- Kawagoe R, Takikawa Y, Hikosaka O (1998): Expectation of reward modulates cognitive signals in the basal ganglia. Nat Neurosci 1:411–416. [DOI] [PubMed] [Google Scholar]
- Kawagoe R, Takikawa Y, Hikosaka O (2004): Reward‐predicting activity of dopamine and caudate neurons–A possible mechanism of motivational control of saccadic eye movement. J Neurophysiol 91:1013–1024. [DOI] [PubMed] [Google Scholar]
- Keeser D, Meindl T, Bor J, Palm U, Pogarell O, Mulert C, Brunelin J, Moller HJ, Reiser M, Padberg F (2011): Prefrontal transcranial direct current stimulation changes connectivity of resting‐state networks during fMRI. J Neurosci 31:15284–15293. [DOI] [PMC free article] [PubMed] [Google Scholar]
- Kennerley SW, Walton ME, Behrens TEJ, Buckley MJ, Rushworth MFS (2006): Optimal decision making and the anterior cingulate cortex. Nat Neurosci 9:940–947. [DOI] [PubMed] [Google Scholar]
- Kim JN, Shadlen MN (1999): Neural correlates of a decision in the dorsolateral prefrontal cortex of a macaque. Nat Neurosci 2:176–185. [DOI] [PubMed] [Google Scholar]
- Knoch D, Gianotti LRR, Pascual‐Leone A, Treyer V, Regard M, Hohmann M, Brugger P (2006): Disruption of right prefrontal cortex by low‐frequency repetitive transcranial magnetic stimulation induces risk‐taking behavior. J Neurosci 26:6469–6472. [DOI] [PMC free article] [PubMed] [Google Scholar]
- Kriegeskorte N, Simmons WK, Bellgowan PS, Baker CI (2009): Circular analysis in systems neuroscience: the dangers of double dipping. Nat Neurosci 12:535–540. [DOI] [PMC free article] [PubMed] [Google Scholar]
- Kwon YH, Ko MH, Ahn SH, Kim YH, Song JC, Lee CH, Chang MC, Jang SH (2008): Primary motor cortex activation by transcranial direct current stimulation in the human brain. Neurosci Lett 435:56–59. [DOI] [PubMed] [Google Scholar]
- Lang N, Siebner HR, Ward NS, Lee L, Nitsche MA, Paulus W, Rothwell JC, Lemon RN, Frackowiak RS (2005): How does transcranial DC stimulation of the primary motor cortex alter regional neuronal activity in the human brain? Eur J Neurosci 22:495–504. [DOI] [PMC free article] [PubMed] [Google Scholar]
- Lejuez CW, Read JP, Kahler CW, Richards JB, Ramsey SE, Stuart GL, Strong DR, Brown RA (2002): Evaluation of a behavioral measure of risk taking: the Balloon Analogue Risk Task (BART). J Exp Psychol 8:75–84. [DOI] [PubMed] [Google Scholar]
- Liang X, Wang J, Yan C, Shu N, Xu K, Gong G, He Y (2012): Effects of different correlation metrics and preprocessing factors on small‐world brain functional networks: A resting‐state functional MRI study. PLoS One 7:e32766. [DOI] [PMC free article] [PubMed] [Google Scholar]
- Liu Y, Liang M, Zhou Y, He Y, Hao Y, Song M, Yu C, Liu H, Liu Z, Jiang T (2008): Disrupted small‐world networks in schizophrenia. Brain 131:945–961. [DOI] [PubMed] [Google Scholar]
- Manes F, Sahakian B, Clark L, Rogers R, Antoun N, Aitken M, Robbins T (2002): Decision‐making processes following damage to the prefrontal cortex. Brain 125:624–639. [DOI] [PubMed] [Google Scholar]
- Marco‐Pallarés J, Nager W, Krämer UM, Cunillera T, Càmara E, Cucurell D, Schüle R, Schöls L, Rodriguez‐Fornells A, Münte TF (2010): Neurophysiological markers of novelty processing are modulated by COMT and DRD4 genotypes. Neuroimage 53:962–969. [DOI] [PubMed] [Google Scholar]
- McDannald MA, Lucantonio F, Burke KA, Niv Y, Schoenbaum G (2011): Ventral striatum and orbitofrontal cortex are both required for model‐based, but not model‐free, reinforcement learning. J Neurosci 31:2700–2705. [DOI] [PMC free article] [PubMed] [Google Scholar]
- Merzagora AC, Foffani G, Panyavin I, Mordillo‐Mateos L, Aguilar J, Onaral B, Oliviero A (2010): Prefrontal hemodynamic changes produced by anodal direct current stimulation. Neuroimage 49:2304–2310. [DOI] [PubMed] [Google Scholar]
- Nair DG, Renga V, Lindenberg R, Zhu L, Schlaug G (2011): Optimizing recovery potential through simultaneous occupational therapy and non‐invasive brain‐stimulation using tDCS. Restor Neurol Neurosci 29:411–420. [DOI] [PMC free article] [PubMed] [Google Scholar]
- Nitsche MA, Paulus W (2001): Sustained excitability elevations induced by transcranial DC motor cortex stimulation in humans. Neurology 57:1899–1901. [DOI] [PubMed] [Google Scholar]
- Nitsche MA, Nitsche MS, Klein CC, Tergau F, Rothwell JC, Paulus W (2003): Level of action of cathodal DC polarisation induced inhibition of the human motor cortex. Clin Neurophysiol 114:600–604. [DOI] [PubMed] [Google Scholar]
- Paulus MP, Rogalsky C, Simmons A, Feinstein JS, Stein MB (2003): Increased activation in the right insula during risk‐taking decision making is related to harm avoidance and neuroticism. Neuroimage 19:1439–1448. [DOI] [PubMed] [Google Scholar]
- Peña‐Gómez C, Sala‐Lonch R, Junqué C, Clemente IC, Vidal D, Bargalló N, Falcón C, Valls‐Solé J, Pascual‐Leone A, Bartrés‐Faz D (2012): Modulation of large‐scale brain networks by transcranial direct current stimulation evidenced by resting‐state functional MRI. Brain Stimul 5:252–263. [DOI] [PMC free article] [PubMed] [Google Scholar]
- Pereira JB, Junqué C, Bartrés‐Faz D, Martí MJ, Sala‐Llonch R, Compta Y, Falcón C, Vendrell P, Pascual‐Leone A, Valls‐Solé J, Tolosa E (2012): Modulation of verbal fluency networks by transcranial direct current stimulation (tDCS) in Parkinson's disease. Brain Stimul 6:16–24. [DOI] [PubMed] [Google Scholar]
- Polanía R, Paulus W, Antal A, Nitsche MA (2011a): Introducing graph theory to track for neuroplastic alterations in the resting human brain: A transcranial direct current stimulation study. Neuroimage 54:2287–2296. [DOI] [PubMed] [Google Scholar]
- Polanía R, Nitsche MA, Paulus W (2011b): Modulating functional connectivity patterns and topological functional organization of the human brain with transcranial direct current stimulation. Hum Brain Mapp 32:1236–1249. [DOI] [PMC free article] [PubMed] [Google Scholar]
- Polanía R, Paulus W, Nitsche MA (2011c): Modulating cortico‐striatal and thalamo‐cortical functional connectivity with transcranial direct current stimulation. Hum Brain Mapp 33:2499‐2508. [DOI] [PMC free article] [PubMed] [Google Scholar]
- Rangel A, Camerer C, Montague PR (2008): A framework for studying the neurobiology of value‐based decision making. Nat Rev Neurosci 9:545–556. [DOI] [PMC free article] [PubMed] [Google Scholar]
- Rao H, Korczykowski M, Pluta J, Hoang A, Detre JA (2008): Neural correlates of voluntary and involuntary risk taking in the human brain: An fMRI study of the Balloon Analog Risk Task (BART). Neuroimage 42:902–910. [DOI] [PMC free article] [PubMed] [Google Scholar]
- Rao H, Mamikonyan E, Detre JA, Siderowf AD, Stern MB, Potenza MN, Weintraub D (2010): Decreased ventral striatal activity with impulse control disorders in Parkinson's disease. Mov Disord 25:1660–1669. [DOI] [PMC free article] [PubMed] [Google Scholar]
- Rogers RD, Owen AM, Middleton HC, Williams EJ, Pickard JD, Sahakian BJ, Robbins TW (1999): Choosing between small, likely rewards and large, unlikely rewards activates inferior and orbital prefrontal cortex. J Neurosci 19:9029–9038. [DOI] [PMC free article] [PubMed] [Google Scholar]
- Rushworth MFS, Buckley MJ, Behrens TEJ, Walton ME, Bannerman DM (2007): Functional organization of the medial frontal cortex. Curr Opin Neurobiol 17:220–227. [DOI] [PubMed] [Google Scholar]
- Rushworth MFS, Noonan MP, Boorman ED, Walton ME, Behrens TE (2011): Frontal cortex and reward‐guided learning and decision making. Neuron 70:1054–1069. [DOI] [PubMed] [Google Scholar]
- Schoenbaum G, Esber GR (2010): How do you (estimate you will) like them apples? Integration as a defining trait of orbitofrontal function. Curr Opin Neurobiol 20:205–211. [DOI] [PMC free article] [PubMed] [Google Scholar]
- Schoenbaum G, Roesch MR, Stalnaker TA (2006): Orbitofrontal cortex, decision‐making and drug addiction. Trends Neurosci 29:116–124. [DOI] [PMC free article] [PubMed] [Google Scholar]
- Schonberg T, Fox CR, Mumford JA, Congdon E, Trepel C, Poldrack RA (2012): Decreasing ventromedial prefrontal cortex activity during sequential risk‐taking: An fMRI investigation of the balloon analog risk task. Front Neurosci 6:80. [DOI] [PMC free article] [PubMed] [Google Scholar]
- Supekar K, Menon V, Rubin D, Musen M, Greicius MD (2008): Network analysis of intrinsic functional brain connectivity in Alzheimer's disease. PLoS Comput Biol 4:e1000100. [DOI] [PMC free article] [PubMed] [Google Scholar]
- Takahashi YK, Roesch MR, Wilson RC, Toreson K, O'Donnell P, Niv Y, Schoenbaum G (2011): Expectancy‐related changes in firing of dopamine neurons depend on orbitofrontal cortex. Nat Neurosci 14:1590–1597. [DOI] [PMC free article] [PubMed] [Google Scholar]
- Tanaka SC, Doya K, Okada G, Ueda K, Okamoto Y, Yamawaki S (2004): Prediction of immediate and future rewards differentially recruits cortico‐basal ganglia loops. Nat Neurosci 7:887–893. [DOI] [PubMed] [Google Scholar]
- Taylor SF, Welsh RC, Wager TD, Phan KL, Fitzgerald KD, Gehring WJ (2004): A functional neuroimaging study of motivation and executive function. Neuroimage 21:1045–1054. [DOI] [PubMed] [Google Scholar]
- Trepel C, Fox CR, Poldrack RA (2005): Prospect theory on the brain? Toward a cognitive neuroscience of decision under risk. Cogn Brain Res 23:34–50. [DOI] [PubMed] [Google Scholar]
- Venkatraman V, Payne JW, Bettman JR, Luce MF, Huettel SA (2009): Separate neural mechanisms underlie choices and strategic preferences in risky decision making. Neuron 62:593–600. [DOI] [PMC free article] [PubMed] [Google Scholar]
- Vul E, Harris C, Winkielman P, Pashler H (2009): Puzzlingly high correlations in fMRI studies of emotion, personality, and social cognition. Perspect Psychol Sci 4:274–290. [DOI] [PubMed] [Google Scholar]
- Wallis JD, Miller EK (2003): Neuronal activity in primate dorsolateral and orbital prefrontal cortex during performance of a reward preference task. Eur J Neurosci 18:2069–2081. [DOI] [PubMed] [Google Scholar]
- Walton ME, Bannerman DM, Alterescu K, Rushworth MF (2003): Functional specialization within medial frontal cortex of the anterior cingulate for evaluating effort‐based decisions. J Neurosci 23:6475–6479. [DOI] [PMC free article] [PubMed] [Google Scholar]
- Walton ME, Bannerman DM, Rushworth MF (2002): The role of rat medial frontal cortex in effort‐based decision making. J Neurosci 22:10996–11003. [DOI] [PMC free article] [PubMed] [Google Scholar]
- Walton ME, Croxson PL, Behrens TE, Kennerley SW, Rushworth MF (2007): Adaptive decision making and value in the anterior cingulate cortex. Neuroimage 36(Suppl 2):T142–T154. [DOI] [PMC free article] [PubMed] [Google Scholar]
- Walton ME, Kennerley SW, Bannerman DM, Phillips PEM, Rushworth MF (2006): Behavioral and neural analyses of effort‐related decision making. Neural Netw 19:1302–1314. [DOI] [PMC free article] [PubMed] [Google Scholar]
- Wang J, Alsop DC, Song HK, Maldjian JA, Tang K, Salvucci AE, Detre JA (2003): Arterial transit time imaging with flow encoding arterial spin tagging (FEAST). Magn Reson Med 50:599–607. [DOI] [PubMed] [Google Scholar]
- Weber BJ, Huettel SA (2008): The neural substrates of probabilistic and intertemporal decision making. Brain Res 1234:104–15. [DOI] [PMC free article] [PubMed] [Google Scholar]
- Wu WC, Fernandez‐Seara M, Detre JA, Wehrli FW, Wang J (2007): A theoretical and experimental investigation of the tagging efficiency of pseudocontinuous arterial spin labeling. Magn Reson Med 58:1020–1027. [DOI] [PubMed] [Google Scholar]
- Yin HH, Ostlund SB, Knowlton BJ, Balleine BW (2005): The role of the dorsomedial striatum in instrumental conditioning. Eur J Neurosci 22:513–523. [DOI] [PubMed] [Google Scholar]
- Zhang Y, Brady M, Smith S (2001): Segmentation of brain MR images through a hidden Markov random field model and the expectation maximization algorithm. IEEE Trans Med Imaging 20:45–57. [DOI] [PubMed] [Google Scholar]
- Zheng X, Alsop DC, Schlaug G (2011): Effects of transcranial direct current stimulation (tDCS) on human regional cerebral blood flow. Neuroimage 58:26–33. [DOI] [PMC free article] [PubMed] [Google Scholar]