

Abstract
Despite known deficits in postural control in patients with schizophrenia, this domain has not been investigated in youth at ultra high‐risk (UHR) for psychosis. This is particularly relevant as postural control implicates dysfunction in the cerebellum‐a region implicated in cognitive dysmetria conceptions of schizophrenia but poorly understood in the prodrome. Here, we extended our understanding of movement abnormalities in UHR individuals to include postural control, and have linked these deficits to both symptom severity and cerebello‐cortical network connectivity. UHR and healthy control participants completed an instrumentally based balance task to quantify postural control along with a resting state brain imaging scan to investigate cerebellar networks. We also quantified positive and negative symptom severity with structured clinical interviews. The UHR group showed overall increased postural sway and decreased cerebello‐cortical resting state connectivity, relative to controls. The decreased cerebello‐cortical connectivity was seen across multiple networks. Postural sway was also correlated with cerebellar connectivity in this population and uniquely positively correlated with the severity of negative symptoms. Finally, symptom severity was also associated with cerebellar connectivity. Together, our results point to a potential deficit in sensory integration as an underlying contributor to the increased postural sway, and provide evidence of cerebellar abnormalities in UHR individuals. These results extend our understanding of the motor abnormalities of UHR individuals beyond striatum‐based dyskinesias to include postural control and sensory integration deficits, and implicate the cerebellum as a distinct neural substrate preceding the onset of psychosis. Taken together, our results extend the cognitive dysmetria framework to UHR populations. Hum Brain Mapp 35:4064–4078, 2014. © 2014 Wiley Periodicals, Inc.
Keywords: postural control, ultra high‐risk, cerebellum, psychosis, resting state connectivity, symptom severity
INTRODUCTION
The prodromal period prior to the onset of schizophrenia is often marked by declines in cognitive function, as well as attenuated psychotic symptoms [Cornblatt et al., 2002, 2003; Simon et al., 2007; White et al., 2006; Yung et al., 2004]. The psychotic symptoms, also referred to as positive symptoms, include hallucinations and delusions [Andreasen and Olsen, 1982; Liddle, 1987], and in UHR individuals, they often manifest as seeing shadows or hearing sounds when they do not exist. In addition to positive psychotic symptoms, UHR individuals and patients with schizophrenia also suffer from negative symptoms. This symptom domain includes blunted affect, psychomotor slowing, anhedonia, alogia, and withdrawal from friends and family [Andreasen and Olsen, 1982; Liddle, 1987]. Furthermore, UHR individuals also exhibit brain abnormalities when compared to healthy controls [Dazzan et al., 2012; Jung et al., 2012, 2011]. Individuals that display cognitive declines and attenuated psychotic symptoms are considered to be at ultra high‐risk (UHR) for psychosis. Investigating UHR populations before conversion to psychosis is useful for targeting treatment and interventions, in hopes of improving outcomes. Further, because UHR samples are associated with fewer of the third variable confounds seen in schizophrenia (i.e., neurotoxicity, medications, and substance abuse/dependence), investigating brain and behavior variables in this group stands to provide integral information about the pathogenesis of schizophrenia. Two promising domains of investigation in UHR populations are motor abnormalities and cerebellar network connectivity.
Movement abnormalities are also seen in UHR populations [Walker et al., 1999] and are associated with negative symptom severity in schizotypal personality disorder [Neumann and Walker, 2003]. These movement abnormalities primarily include dyskinesias, which are involuntary movements of the face, and upper and lower limbs [Mittal and Walker, 2007; Mittal et al., 2008, 2007; Walker et al., 1999]. However, deficits in force control have also been demonstrated [greater variability; Neumann and Walker, 2003]. More recently, longitudinal studies have also provided important insights into movement abnormalities in UHR groups [Mittal and Walker, 2007; Mittal et al., 2008, 2007]. Facial and upper body dyskinesias (involuntary movements) were correlated with both baseline positive and negative symptom severity and symptom severity 1 year later [Mittal and Walker, 2007]. Most notably however is the fact that those that converted to psychosis exhibited significantly more movement abnormalities than at‐risk individuals that did not convert [Mittal and Walker, 2007]. This has led to speculation that movement abnormalities may be indicative of underlying brain differences that may eventually lead to psychosis [Mittal et al., 2007]. Importantly, in the work of Mittal and colleagues [Mittal and Walker, 2007; Mittal et al., 2008, 2007], the authors controlled for the use of antipsychotic medications in their analyses, indicating that these movement abnormalities are a feature of the disease state, rather than being a side‐effect of antipsychotics.
Although dyskinesias have been well documented in UHR populations, postural control has not been investigated. Postural control refers to the maintenance of upright standing posture, through the use of proprioceptive cues as well as visual and vestibular information [cf. Marvel et al., 2004]. Postural control deficits have been demonstrated in schizophrenia [Deshmukh et al., 2002; Kent et al., 2012; Marvel et al., 2004; Sullivan et al., 2004], are also associated with symptom severity [Kent et al., 2012]. They may be indicative of sensorimotor integration deficits and cerebellar dysfunction. Deficits in sensorimotor integration and the implication of the cerebellum in postural control dysfunction are complementary to the notion of cognitive dysmetria [Andreasen et al., 1996, 1998]. Cognitive dysmetria has been described as “poor mental coordination” [cf. Andreasen et al., 1998], and is associated with a cortical‐thalamo‐cerebellar network. Indeed, the cerebellum and prefrontal cortex are also implicated in postural control [Bernard and Seidler, 2013; Deshmukh et al., 2002; Morton and Bastian, 2004; Ouchi et al., 1999], further linking these two domains. Postural sway deficits in UHR populations may therefore be indicative of symptom severity and cerebellar dysfunction, and be intimately tied to the pathogenesis of schizophrenia.
The cerebellum is an important neural node in the cognitive dysmetria framework [Andreasen et al., 1998]. However, as noted by Andreasen and Pierson [2008] taking a network approach to understanding the neural underpinnings of schizophrenia is particularly important. Resting state functional connectivity magnetic resonance imaging (fcMRI) investigates correlations in the brain signal between different regions at rest. Areas that are typically engaged together during task performance are correlated at rest [Biswal et al., 1995, 2010]. In schizophrenia patients and their first‐degree relatives, there is evidence suggesting that there are differences in cerebellar functional connectivity with the cortex [Collin et al., 2011; Liu et al., 2011; Repovš and Barch, 2012; Repovs et al., 2011], and connectivity differences have been linked to symptom severity and cognitive function [Repovš and Barch, 2012; Repovs et al., 2011]. In all cases, connectivity was decreased in the patient group. Indeed, recent work has demonstrated that there are distinct networks of the individual cerebellar lobules [Bernard et al., 2012]. These networks are broadly segregated into those that are more associated with motor regions of the brain, and those associated with non‐motor, cognitive, and association regions [Bernard et al., 2012; Krienen and Buckner, 2009; O'Reilly et al., 2010], although the networks are distinct at the lobular level [Bernard et al., 2012]. Although they did not investigate cerebellar resting state connectivity on a lobular level, Collin et al. [2011] did investigate resting state connectivity of multiple subregions within the cerebellum. They found that connectivity in the right anterior cerebellum and anterior cerebellar vermis was significantly decreased in patients with schizophrenia, relative to healthy controls. Specifically, connectivity between the cerebellum and premotor, inferior frontal, medial temporal, and thalamic regions was decreased in the patient group [Collin et al., 2011]. Given the cerebello‐cortical disconnection seen in schizophrenia, an investigation of all cerebellar networks in UHR individuals is warranted, and may provide important insights into symptomatology and pathophysiology in this population.
In this study, we examined postural sway and resting state cerebellar networks in UHR individuals and healthy controls. We also investigated relationships between symptomatology and both postural sway and cerebello‐cortical connectivity. We hypothesized that UHR participants would show postural sway deficits and decreased cerebello‐cortical connectivity when compared to controls. Given that prior work in schizophrenia and first‐degree relatives has demonstrated decreased connectivity between the cerebellum and networks of the parietal and frontal cortices [Repovš and Barch, 2012; Repovs et al., 2011] we expected to see decreased connectivity across all the cerebellar networks. We further hypothesized that postural sway and cerebello‐cortical connectivity would be correlated with negative and positive symptom severity, given that other movement abnormalities are associated with both symptom domains [Mittal and Walker, 2007; Mittal et al., 2008, 2007]. That is, abnormal connectivity would be associated with increased sway, and worse symptoms. Indeed, cerebellar morphology has been linked to negative symptom severity and outcomes in schizophrenia [Wassink et al., 1999]. Postural sway provides an indirect measure of cerebellar function, and cerebellar connectivity assesses this more directly.
METHOD
Participants
Participants were recruited at the University of Colorado Boulder's Adolescent Development and Preventative Treatment (ADAPT) research program. Our sample included 29 adolescent and young adult controls (16–21 years, mean age = 18.61 ± 1.73 years, 11 male) and 34 UHR individuals (16–21 years, mean age = 18.71 ± 1.85 years, 22 male). Exclusion criteria for both groups included history of head injury, the presence of a neurological disorder, life‐time substance dependence (as assessed by the Structured Clinical Interview for Axis‐I DSM‐IV Disorders; SCID) [First et al., 1995] and the presence of any contraindication to the magnetic resonance imaging environment (e.g., current pregnancy or metal in the body). For UHR participants, we also excluded those with an Axis I psychotic disorder (e.g., schizophrenia). In control subjects, the presence of an Axis I disorder or a psychotic disorder in first‐degree relatives was an exclusion criterion. All study procedures were approved by the University of Colorado Institutional Review Board.
We were unable to analyze postural sway data from three control participants, and two UHR participants due to technological problems that resulted in the corruption of the data files. The resulting samples included 26 control and 32 UHR participants. Complete demographic information for the final sample is presented in Table 1. The inclusion criteria for the final sample of UHR individuals are consistent with those previously used in the UHR literature [Mittal and Walker, 2007; Mittal et al., 2008, 2007].
Table 1.
Demographic characteristics of the sample
| Demographic characteristics | ||
|---|---|---|
| High risk | Controls | |
| Total | 32 | 26 |
| Males | 20 | 11 |
| Females | 12 | 15 |
| Age (years) | 18.59 (1.85) | 18.81 (1.62) |
| Alcohol use | 1.78 (1.77) | 0.96 (1.18) |
| BMIa | 21.94 (3.69) | 24.37 (5.20) |
| Educational attainment (years) | 12.66 (1.77) | 12.69 (1.71) |
| Parental education (years) | ||
| Paternala | 16.94 (2.50) | 15.54 (2.55) |
| Maternal | 15.93 (2.27) | 16.50 (2.70) |
| SIPS | ||
| Positiveb | 11.72 (4.73) | 0.62 (1.44) |
| Negativeb | 11.19 (6.83) | 0.54 (0.948) |
| Schizotypal personality Disorder | n = 6 | n = 0 |
| First‐degree relative: axis I or schizophrenia | n = 6 | n = 0 |
| Current antipsychotics | n = 3 | n = 0 |
| Past antipsychotics | n = 5 | n = 0 |
For alcohol consumption, the average frequency of use is reported (scored from 0 to 5; 0 = never; 1 = once or twice per month; 2 = three or four times per month; 3 = once or twice per week; 4 = three or four times per week; 5 = almost daily). Significant differences between the two groups are indicated. There were no significant group differences in age, alcohol use, maternal educational attainment, nor participant educational attainment (all Ps > 0.15). For both SIPS domains, UHR participants were rated significantly higher (P < 0.001).
P < 0.05.
P < 0.001.
Symptoms and Alcohol
The structured interview for prodromal syndromes (SIPS) [Miller et al., 1999] was administered to all participants to diagnose a prodromal syndrome. The SIPS measures distinct categories of prodromal symptom domains including positive and negative dimensions. The SIPS is scored from 0 to 6, for each symptom. Typically, scores on individual items assessing positive symptoms are between 3 and 5 for UHR individuals. These scores are indicative of moderate to severe, but not psychotic levels of symptoms. A mean score for each symptom category is used to indicate the respective dimensions of symptomatology. All UHR participants in this study met the criteria for a prodromal or high‐risk syndrome. This was defined by moderate levels of positive symptoms, and/or a decline in global functioning in association with the presence of schizotypal personality disorder, and/or a family history of schizophrenia [Miller et al., 1999]. All interviewers had inter‐rater reliabilities that exceeded the minimum study criterion of Kappa ≥ 80. Mean scores are presented in Table 1.
To rule out the presence of a psychotic disorder and assess for the substance dependence exclusion criterion, the SCID [First et al., 1995] was administered. This measure has excellent inter‐rater reliability in adolescent populations [Martin et al., 2000], and has been used previously in work focusing on adolescents with schizophrenia spectrum disorders [Howes et al., 2009]. Alcohol consumption was coded using the following choices: never, once or twice per month, three or four times per month, once or twice per week, three or four times per week, or almost daily. These ratings were then numerically coded from 0 (never) to 5 (almost daily) for use in our statistical analyses.
Balance Assessment
All participants stood on an Advanced Mechanical Technology Incorporated (AMTI) Accusway (Watertown, MA) force platform. The participants were asked to stand as still as possible while keeping their arms comfortably by their sides. We manipulated both visual input (eyes open versus eyes closed) and base (feet together versus feet shoulder width apart), resulting in four conditions, run in the following order: eyes open, open base (EOOB), eyes closed, open base (ECOB), eyes open, closed base (EOCB), eyes closed, closed base (ECCB). During each condition we recorded center of pressure (COP) for 2 min. In the eyes open conditions participants were asked to focus their gaze on a fixed point on the wall directly across from them. Proprioceptive information is decreased when the base is closed (feet together), while the eyes closed condition deprives participants of visual feedback. Prior to the balance assessment, all participants completed a food and alcohol diary of everything consumed after 6 PM the evening prior to testing up until the start of the testing session. Participants that reported an episode of binge drinking were asked to return at a later date after abstaining from alcohol. To control for differences in body composition, and by proxy, physical fitness, we recorded the height and weight of each participant and calculated their body mass index (BMI).
To isolate the low‐frequency postural sway process in the recorded data, we applied a 9th order Butterworth filter with a 20 Hz cutoff frequency. COP and the 95% confidence interval of COP area were measured using principle component analysis [Oliveira et al., 1996]. The use of an ellipse that encompasses 95% of all the data points along the x and y axes is a standard measure of the magnitude of postural sway [Kent et al., 2012; Odenrick and Sandstedt, 1984; Prieto et al., 1992]. For example, COP plots please see Figure 1A.
Figure 1.

Center of pressure plots and group differences in sway area. (A) Example sway area plot for a UHR (left) and a control (right) participant. The x‐axis indicates movement in the medio‐lateral direction whereas the y‐axis indicates movement in the anterior‐posterior direction. COP is measured in cm, and the intersection of the two axes indicates 0 cm in either direction. Both participants are plotted on the same scale. (B) Sway area for UHR and control participants across the four balance conditions. UHR participants showed significantly worse postural control (greater sway). Error bars indicate the standard error of the mean.
fcMRI Scanning Procedure
Two UHR participants were excluded from fcMRI scanning due to contraindications. Furthermore, the individuals with outlier data points on the COP analysis were excluded from the neuroimaging analysis due to the constraints of the fcMRI analysis software, and so that they would not drive our analyses and correlations. Resting state analysis was thus conducted on 27 UHR participants and 25 controls. Structural images were acquired with a T1‐weighted 3D magnetization prepared rapid gradient multi‐echo sequence (MPRAGE; sagittal plane; repetition time [TR] = 2,530 ms; echo times [TE] = 1.64 ms, 3.5 ms, 5.36 ms, 7.22 ms, 9.08 ms; GRAPPA parallel imaging factor of 2; 1 mm3 isomorphic voxels, 192 interleaved slices; FOV = 256 mm; flip angle = 7°). A 5 min 34 s functional resting state blood‐oxygen‐level‐dependent scan was acquired with a T2*‐weighted echo‐planar functional protocol (number of volumes = 165; TR = 2,000 ms; TE = 29 ms; matrix size = 64 × 64 × 33; FA = 75°; 3.8 × 3.8 × 3.5 mm3 voxels; 33 slices; FOV = 240 mm). During the resting state scan, participants were instructed to relax and close their eyes. A turbo spin echo proton density (PD)/T2‐weighted acquisition (TSE; axial oblique aligned with anterior commissure–posterior commissure line; TR = 3,720 ms; TE = 89 ms; GRAPPA parallel imaging factor of 2; FOV = 240 mm; flip angle: 120°; 0.9 × 0.9 mm2 voxels; 77 interleaved 1.5 mm slices) was acquired to check for incidental pathology. The fcMRI scan was kept relatively short to minimize anxiety and the possibility of within‐scan movement. This fcMRI scan duration has been shown to yield equivalent power as longer scans [Van Dijk et al., 2010].
Statistical Analysis
We investigated group differences in demographics, substance use, and symptom domains using independent samples t‐tests. For all postural sway analyses, outliers were defined a priori as any points above three standard deviations of the group mean. Across all conditions, we removed five outlier data points (four from the UHR and one control, individual data points only). Three data points were removed from unique participants, whereas the remaining two points were removed one UHR participant. There were no obvious differences between this participant and the rest of the UHR sample. The degrees of freedom in our analyses are presented accordingly. A 4 × 2 (condition × group) repeated mixed‐model ANOVA was used to investigate group differences in postural sway. To address the potential confounding effects of alcohol use on postural sway and to examine relationships between positive and negative symptom severity and postural sway, we used Pearson product‐moment correlation across the four conditions. Because three UHR individuals were taking antipsychotic medications, we repeated our 4 × 2 ANOVA and the correlation analyses with symptom severity while excluding these participants.
fcMRI Data Preprocessing and Analysis
Data were preprocessed in FSL (v. 5; http://fsl.fmrib.ox.ac.uk/fsl), which involved motion correction, brain extraction, high‐pass filtering (100 s), and spatial smoothing (6 mm FWHM). Functional images were aligned to the MNI 2‐mm brain template with a two‐step procedure. First, the resting state scan was aligned to the high‐resolution MPRAGE using a linear boundary‐based registration method, which relies on white matter boundaries [Greve and Fischl, 2009; Jenkinson and Smith, 2001; Jenkinson et al., 2002]. Second, the MPRAGE was nonlinearly aligned to the template [Andersson et al., 2010], and the two registrations were then combined to align the functional resting state scan to the template. The Artifact Rejection Toolbox (ART; http://www.nitrc.org/projects/artifact_detect/) was used to detect outliers based on mean signal (>3 SD away from the mean) and motion (>1 mm composite measure of translation and rotation).
fcMRI analysis was performed in the Conn toolbox v. 1.3m [Whitfield‐Gabrieli and Nieto‐Castanon, 2012]. The data were band‐pass filtered from 0.008 to 0.09 Hz. Lobular seed regions‐of‐interest (ROIs) within the right cerebellum and cerebellar vermis (total of 17 lobules; right lobules I‐IV, V, VI, Crus I, Crus II, VIIb, VIIIa, VIIIb, IX, X and vermis lobules VI, Crus II, VIIb, VIIIa, VIIIb, IX, X) were defined based on the SUIT atlas [Diedrichsen, 2006; Diedrichsen et al., 2009] as described by Bernard et al. [2012, 2013] (Fig. 2). The mean time‐series, averaged across all voxels within each lobular ROI, was used as a predictor regressor. Anatomical images were segmented into gray matter, white matter, and CSF with SPM8 (http://www.fil.ion.ucl.ac.uk/spm) to create masks for signal extraction. The Conn toolbox uses principal component analysis to extract five temporal components from the segmented CSF and white matter, which were entered as confound regressors in the subject‐level GLM. This approach corrects for confounds of motion and physiological noise without regressing out global signal. We used state of the art methods to account for subject motion, as well as outliers, as suggested by Power et al. [2012]. Accordingly, the GLM also included confound regressors for subject motion (six parameters for translation and rotation) and frame‐wise outliers identified with the ART toolbox.
Figure 2.
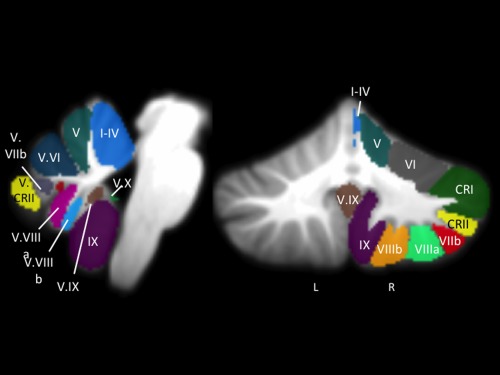
fcMRI cerebellar seed regions. Lobular seed regions (lobules I–VI, Crus I and II, Lobules VIIb‐X, Vermis VI, Vermis Crus II, and Vermis VIIb‐X) of the right cerebellum and vermis from the SUIT atlas, overlaid onto a template cerebellum (left: sagittal view; right: coronal view). For our analyses, we used the average timecourse for the whole ROI. Lobular naming was based on the roman numeral convention used by Schmahmann et al. [1999]. Only roman numerals are used here, with several abbreviations as follows: CRI = Crus I; CRII = Crus II; V. = Vermis. Images are presented using anatomical conventions so that the right hemisphere is presented on the right. L: left; R: right, presented with the right coronal view also provide image orientation information.
First, we conducted a between‐group analysis to investigate group differences in cortico‐cerebellar resting state networks. Next, we conducted within‐group symptom and COP correlation analyses in the UHR individuals only. In both sets of analyses, connectivity between the seed ROI in the cerebellum was calculated with all other voxels in the brain. Data in tables and statistical maps were first thresholded at the voxel‐level at P uncorr < 0.001 and then corrected at the cluster‐level to a false‐discovery rate (FDR) of P < 0.05 [Chumbley and Friston, 2009]. Finally, we also computed group‐level connectivity maps for each seed region that were thresholded at the voxel‐level at P uncorr < 0.0001, with a comparable cluster correction (FDR P < 0.05) for comparison with extant data on cerebellar lobular resting state networks [Bernard et al., 2012].
RESULTS
The results of analyses of demographic factors, substance use, and symptom severity are presented in Table 1.
COP Difference
Our 4 × 2, group × sway condition ANOVA revealed a significant main effect of group (F (1,51) = 4.52, P < 0.05, η 2 p = 0.08), and a main effect of balance condition (F (3,153) = 46.08, P < 0.001, η 2 p = 0.476). However, there was no group by balance condition interaction (F (3,153) = 1.29, P > 0.2, η 2 p = 0.02). UHR participants have impaired postural capabilities, but across both groups the ECCB condition was the most challenging (Fig. 1B). The results remained the same when excluding participants taking antipsychotic medication; n = 3 UHR; main effect of group: (F (1.49) = 4.65, P < 0.05, η 2 p = 0.09); main effect of balance condition: (F (3.147) = 44.80, P < 0.001, η 2 p = 0.48); group by condition interaction: (F (3.147) = 1.53, P > 0.2, η 2 p = 0.03).
Because alcohol use may confound postural sway [Deshmukh et al., 2002; Sullivan et al., 2004], we investigated the potential confounding influence of alcohol use in the UHR participants. There were no significant correlations between the frequency of alcohol consumption and sway area (for all conditions, all Ps > 0.15). BMI was significantly higher in the control group (t (53) = −2.02, P < 0.05; Table 1). If anything, the higher BMI in the control group may mask further differences between the two groups. However, the average BMI for each group was within the healthy range (less than 25).
Postural Sway and Symptom Severity
We investigated the relationships between positive and negative symptom ratings from the SIPS, and COP in the UHR participants. The relationships were specific to the negative symptoms. There were significant correlations (with Bonferroni correction, P < 0.0125) between sway area and negative symptoms on the ECCB and EOCB conditions (ECCB: r (31) = 0.52, P < 0.005; EOCB: r (31) = 0.47, P = 0.007; Fig. 3) and trends with ECOB and EOOB (ECOB: r (31) = 0.34, P < 0.07; EOOB: r (31) = 0.34, P < 0.07). These relationships remain significant after the removal of participants taking antipsychotic medications (ECCB: r (28) = 0.48, P = 0.009; EOCB: r (28) = 0.50, P = 0.005). There were no significant correlations between positive symptoms and performance on any of the sway conditions (for all conditions r (31) < 0.09, P > 0.6).
Figure 3.
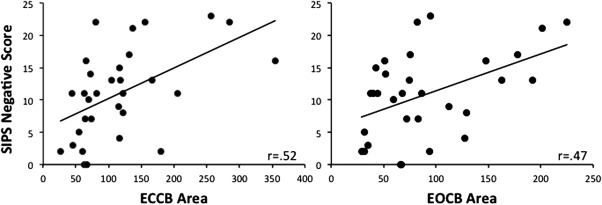
Postural sway and severity of negative symptoms. Postural sway on the ECCB condition (left, r (31) = 0.52, P < 0.005) and the EOCB condition (right, r (31) = 0.47, P < 0.01) were significantly correlated with negative symptoms as evaluated with the SIPS. Individuals with the greatest degree of postural sway have the worst symptoms.
Group Differences in Cerebello‐Cortical Connectivity
There were no group differences in total movement displacement (mean movement: UHR: 0.26 mm; controls: 0.27 mm; t (50) = −0.14, P > 0.8), nor were there any differences in the total number of movement and signal outliers as assessed using the ART toolbox (mean outliers: UHR: 5.3; controls: 5.4; t (50) = −0.1, P > 0.9). Group resting state maps confirmed that those in our sample are generally consistent with the existing literature on lobular cerebellar networks [Bernard et al., 2012] (Supporting Information Tables S1 and S2). Group comparisons indicated that UHR individuals have decreased connectivity with respect to controls (Fig. 4; for a complete list of group differences, please see Table 2). Networks showing decreased connectivity in the UHR individuals include posterior lobules VIIb and X, and the vermis Crus II and X, which are associated with prefrontal and parietal cortical regions in healthy adults [Bernard et al., 2012], although anterior lobules I–IV were also impacted. Across these networks, connectivity was particularly decreased with parietal and prefrontal regions, particularly the dorsal premotor cortex. There were no seeds showing greater connectivity in the UHR group than the controls.
Figure 4.
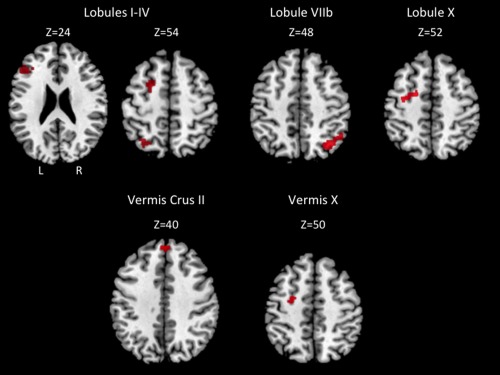
Areas exhibiting greater connectivity in controls relative to UHR individuals. Axial slices are presented. Images are presented using anatomical conventions so that the right hemisphere is presented on the right. L: left; R: right, on the top left slice also provide image orientation information.
Table 2.
MNI coordinates of regions showing greater cerebello‐cortical connectivity in control participants relative to UHR participants
| Seed | Region | BA | Cluster size | MNI coordinates | t‐Value | ||
|---|---|---|---|---|---|---|---|
| x | y | z | |||||
| Lobules I–IV | Superior parietal lobule | 7 | 343 | −30 | −62 | 52 | 5.78 |
| Crus II | −38 | −54 | −40 | 3.75 | |||
| Middle frontal gyrus | 6 | 157 | −24 | 2 | 60 | 4.64 | |
| Middle frontal gyrus | 46 | 205 | −50 | 30 | 20 | 4.43 | |
| Middle frontal gyrus | 46 | −42 | 28 | 24 | 3.98 | ||
| Middle Frontal Gyrus | 9 | −34 | 34 | 24 | 3.47 | ||
| Lobule VIIb | Superior parietal lobule | 7 | 318 | 34 | −64 | 48 | 4.6 |
| Inferior parietal lobule | 40 | 50 | −54 | 44 | 4.53 | ||
| Superior parietal lobule | 7 | 28 | −62 | 54 | 4.47 | ||
| Lobule X | Middle frontal gyrus | 6 | 217 | −32 | 8 | 54 | 4.26 |
| Dorsal premotor cortex | 6 | −20 | −4 | 52 | 4.16 | ||
| Middle frontal gyrus | 6 | −24 | 0 | 58 | 3.93 | ||
| Vermis Crus II | Superior frontal gyrus | 8 | 200 | 4 | 46 | 44 | 4.41 |
| Superior frontal gyrus | 9 | 2 | 50 | 30 | 4.28 | ||
| Vermis X | Dorsal premotor cortex | 6 | 163 | −24 | −8 | 46 | 4.07 |
| Middle frontal gyrus | 6 | 24 | 0 | 60 | 3.95 | ||
Negative and positive x‐values indicate locations in the left and right hemispheres, respectively. Regions in bold font are indicative of the peak voxel in a particular cluster.
Cerebello‐Cortical Connectivity, Symptom Severity, and Postural Control
Within the UHR group we investigated correlations between symptom severity, postural control, and network connectivity. With respect to symptom severity, Crus II connectivity was associated with negative symptoms, whereas connectivity of vermis X was associated with positive symptoms (Table 3 lists all regions of correlation; Supporting Information Fig. S1). In both cases stronger connectivity was associated with higher symptom scores. Regardless, this is indicative of altered cerebello‐cortical interactions that have a negative impact on symptomatology in UHR individuals.
Table 3.
Correlations between resting state cerebellar networks and positive and negative symptoms severity in UHR individuals
| Seed | Region | BA | Cluster size | MNI coordinates | t‐Value | ||
|---|---|---|---|---|---|---|---|
| x | y | z | |||||
| Negative symptoms | |||||||
| Crus II | Angular gyrus | 39 | 166 | 40 | −58 | 30 | 4.5 |
| Superior temporal gyrus | 39 | 52 | −60 | 26 | 4.03 | ||
| Positive symptoms | |||||||
| Vermis X | Orbitofrontal cortex | 11 | 190 | 0 | 24 | −30 | 6.9 |
| Orbitofrontal cortex | 11 | 0 | 34 | −26 | 4.96 | ||
| Orbitofrontal cortex | 11 | −4 | 38 | −18 | 3.56 | ||
| Middle frontal gyrus | 8 | 215 | −10 | 54 | 46 | 5.48 | |
| Superior frontal gyrus | 8 | −12 | 52 | 38 | 5.21 | ||
Negative and positive x‐values indicate regions in the left and right hemispheres, respectively. Regions in bold font are indicative of the peak voxel in a particular cluster.
Finally, there were numerous correlations between cerebellar connectivity and postural sway across all conditions except EOCB (for all regions of correlation across all conditions, see Table 4; Supporting Information Fig. S2). Most interestingly, cerebello‐cortical connectivity of lobule V, which is associated with motor networks [Bernard et al., 2012], was negatively correlated with sway on the ECCB condition. Those with less connectivity in this network had larger sway area. Interestingly, increased sway was also associated with increased connectivity across multiple conditions, although often with cerebellar networks more associated with cognitive function. This evidence for cognitive interference in postural control is consistent with previous work [Bernard and Seidler, 2013] and is indicative of potential cognitive dysmetria in UHR individuals.
Table 4.
Correlations between resting state cerebellar networks and postural sway in UHR individuals
| Seed | Region | BA | Cluster size | MNI coordinates | t‐Value | ||
|---|---|---|---|---|---|---|---|
| x | y | z | |||||
| ECCB | |||||||
| Lobule V b | Pre‐genual cingulate | 24 | 190 | 6 | 26 | −2 | 5.37 |
| Pre‐genual cingulate | 24 | 0 | 38 | −4 | 5.35 | ||
| Lobule VIIb | Inferior parietal lobule | 40 | 311 | −58 | −30 | 24 | 7.47 |
| Somatosensory cortex | 2 | −66 | −22 | 22 | 4.88 | ||
| Somatosensory cortex | 40 | 165 | 58 | −28 | 20 | 5.33 | |
| Inferior frontal gyrus | 45 | 142 | 54 | 24 | 8 | 4.51 | |
| Middle frontal gyrus | 11 | 112 | 42 | 46 | −8 | 4.38 | |
| Inferior frontal gyrus | 11 | 54 | 38 | −12 | 4.04 | ||
| Lobule VIIIa | Supramarginal gyrus | 40 | 197 | −58 | −50 | 32 | 5.01 |
| Inferior parietal lobule | 40 | −52 | −46 | 38 | 4.92 | ||
| Inferior | 40 | −34 | −52 | 36 | 3.47 | ||
| Lobule VIIIb | Precuneus | 7 | 155 | −22 | −52 | 34 | 4.85 |
| Precuneus | 7 | −14 | −58 | 48 | 4.6 | ||
| Precuneus | 7 | −16 | −58 | 34 | 3.76 | ||
| Thalamus | — | 182 | −6 | −10 | 2 | 4.58 | |
| Substantia nigra | — | −8 | −10 | −8 | 3.7 | ||
| Thalamus (Pulvinar) | — | −12 | −22 | 6 | 4.32 | ||
| Vermis IX | Vermis VI | — | 166 | 4 | −62 | −28 | 5.6 |
| Lobule V | — | 10 | −58 | −24 | 4.3 | ||
| Lobule VI | — | −16 | −62 | −26 | 3.77 | ||
| Vermis X | Vermis VI | — | 352 | 2 | −62 | −26 | 4.94 |
| Lobule V | — | 10 | −56 | −22 | 4.94 | ||
| Lobules I–IV | — | −2 | −56 | −18 | 4.58 | ||
| Vermis X b | Inferior frontal gyrus | 47 | 214 | −30 | 20 | −24 | 6.88 |
| Middle temporal gyrus | 21 | −52 | 14 | −32 | 4.99 | ||
| Inferior frontal gyrus | 27 | 239 | 40 | 16 | −14 | 5.65 | |
| Superior temporal gyrus | 38 | 48 | 4 | −10 | 5.24 | ||
| Inferior frontal gyrus | 47 | 30 | 18 | −22 | 4.8 | ||
| ECOB | |||||||
| Lobule VIIb | Dorsal pre‐motor cortex | 6 | 152 | −54 | 4 | 46 | 5.37 |
| Dorsal lateral pre‐frontal Cortex | 9 | −54 | 20 | 36 | 4.79 | ||
| Pre‐motor cortex | 6 | −56 | 8 | 38 | 4.36 | ||
| Inferior temporal gyrus | 20 | 142 | 56 | −32 | −18 | 5.04 | |
| Middle temporal gyrus | 21 | 70 | −24 | −14 | 4.62 | ||
| Superior temporal gyrus | 42 | 64 | −28 | 10 | 4.35 | ||
| Lobule VIIIa | Pre‐motor cortex | 6 | 126 | −36 | 2 | 34 | 5.78 |
| Dorsal lateral pre‐frontal cortex | 9 | 148 | −52 | 20 | 36 | 5.34 | |
| Dorsal pre‐motor cortex | 6 | −54 | 8 | 46 | 5 | ||
| Pre‐motor cortex | 9 | −56 | 12 | 36 | 4.86 | ||
| Inferior parietal lobule | 40 | 118 | −58 | −34 | 26 | 5.06 | |
| Supramarginal gyrus | 40 | −58 | −44 | 26 | 3.77 | ||
| Inferior parietal lobule | 40 | 128 | −34 | −50 | 40 | 4.36 | |
| Precuneus | 7 | −28 | −46 | 46 | 4.13 | ||
| EOOB | |||||||
| Crus I | Dorsal lateral pre‐frontal cortex | 9 | 174 | −56 | 16 | 32 | 4.93 |
| Dorsal lateral pre‐frontal cortex | 9 | −46 | 16 | 34 | 4.35 | ||
| Dorsal lateral pre‐frontal cortex | 9 | −42 | 8 | 30 | 4.64 | ||
| Lobule VIIb | Inferior parietal lobule | 40 | 417 | −34 | −44 | 46 | 5.27 |
| Inferior parietal lobule | 40 | −42 | −36 | 46 | 5.22 | ||
| Inferior parietal lobule | 40 | −44 | −54 | 60 | 4.48 | ||
| Superior temporal gyrus | 22 | 128 | −54 | −60 | 16 | 5.08 | |
| Middle frontal gyrus | 9 | 315 | −58 | 10 | 34 | 4.98 | |
| Middle frontal gyrus | 9 | −42 | 16 | 32 | 4.85 | ||
| Middle temporal gyrus | 21 | −52 | 6 | −30 | 4.18 | ||
| Lobule VIIIa | Inferior parietal lobule | 40 | 211 | −32 | −44 | 40 | 5.61 |
| Inferior parietal lobule | 40 | −40 | −48 | 46 | 5.06 | ||
| Vermis VI | Superior parietal lobule | 7 | 481 | −10 | −68 | 58 | 6.99 |
| Precuneus | 7 | 12 | −64 | 66 | 5.22 | ||
| Precuneus | 7 | −2 | −80 | 48 | 4.79 | ||
| Subcallosal gyrus | 34 | 172 | −18 | 6 | −14 | 5.44 | |
| Amygdala | — | −32 | 0 | −14 | 4.53 | ||
| Uncus | 34 | −14 | −8 | −20 | 3.93 | ||
| Parahippocampal gyrus | 36 | 197 | 34 | −30 | −22 | 5.39 | |
| Parahippocampal gyrus | 36 | 28 | −28 | −12 | 4.48 | ||
| Hippocampus | — | 30 | −16 | −14 | 4.41 | ||
| Vermis VIIb | Superior parietal lobule | 7 | 167 | −8 | −68 | 58 | 8.6 |
| Precuneus | 7 | −2 | −80 | 50 | 4.32 | ||
| Precuneus | 31 | 248 | 2 | −68 | 24 | 5.55 | |
| Posterior cingulate | 31 | 6 | −64 | 18 | 4.75 | ||
| Posterior cingulate | 30 | 24 | −58 | 14 | 4.34 | ||
| Amygdala | — | 140 | −28 | 0 | −14 | 5.14 | |
| Putamen | — | 18 | 6 | 14 | 4.9 | ||
| Claustrum | — | 28 | 10 | 16 | 4.4 | ||
| Lobule V | — | 129 | 32 | −32 | −20 | 4.74 | |
| Parahippocampal gyrus | 36 | 28 | −32 | −10 | 4.4 | ||
| Parahippocampal gyrus | 35 | 28 | −22 | −18 | 3.9 | ||
| Vermis IX | Superior occipital gyrus | 19 | 185 | −32 | −84 | 30 | 6.08 |
| Precuneus | 19 | −24 | −70 | 30 | |||
| Fusiform gyrus | 37 | 183 | 32 | −46 | −8 | 4.87 | |
| Parahippocampal gyrus | 36 | 24 | −34 | −12 | 4.47 | ||
| Parahippocampal gyrus | 36 | 26 | −40 | −6 | 4.14 | ||
Negative and positive x‐values indicate regions in the left and right hemispheres, respectively.
Indicative of negative correlations such that weaker connectivity results in greater sway area (worse performance). Regions in bold font are indicative of the peak voxel in a particular cluster.
DISCUSSION
To our knowledge, this is the first study to measure postural stability and the first to target cerebello‐cortical resting state networks in UHR individuals. We detected that UHR individuals have deficits in postural control comparable to those seen in schizophrenia [Kent et al., 2012; Marvel et al., 2007], and decreased cerebello‐cortical connectivity relative to controls. Furthermore, the magnitude of the deficits in postural control is correlated with symptom severity, and both postural sway and symptom severity are correlated with cerebello‐cortical connectivity in the UHR individuals. Taken together, this study indicates that abnormalities in cerebellar function may precede formal psychosis, greatly extends our knowledge of the pathophysiology of UHR populations, and provides a link between postural control, cerebello‐cortical networks, and symptomatology.
The overall finding of increased sway in the UHR group is consistent with the existing literature demonstrating postural control deficits and increased sway in schizophrenia. Initial work describing postural control deficits relied primarily on gross measures of ataxia and standing balance [Deshmukh et al., 2002; Sullivan et al., 2004], and provided evidence of postural control deficits in schizophrenia. Using a force plate to quantify center of pressure and sway direction, Marvel et al. [2004] provided a detailed examination of the impact of stance, arm position, and visual input on postural control in schizophrenia. This finding was recently replicated, and furthered by demonstrating correlations between sway complexity and symptom severity [Kent et al., 2012]. Our results further our knowledge of movement abnormalities in UHR groups to include postural control, and are consistent with the idea of schizophrenia as a neurodevelopmental disorder [Bilder, 2001] wherein UHR individuals show early abnormalities and symptoms that may be indicative of future conversion to psychosis.
Postural control is heavily reliant upon sensory integration. Removal of sensory inputs, such as having individuals close their eyes, results in increased postural sway in healthy individuals [Kuo et al., 1998] as well as in those with bipolar disorder [Bolbecker et al., 2011] and schizophrenia [Marvel et al., 2004]. In removing these inputs, less information is available to allow for corrective actions and movements to maintain postural control, resulting in greater postural sway. Our overall group main effect indicates that UHR individuals are impaired in postural control, perhaps due to deficits in sensory integration. However, the lack of group by condition interaction means we can only speculate as to the specific sensory integration deficits. Likely, this is due to a floor effect and overall deficit in UHR individuals, although it is of note that the correlations with negative symptom severity in this population were only with the eyes‐closed condition. Thus, postural control under eyes closed conditions is specific to negative symptomatology.
Furthermore, the correlations between cerebello‐cortical network connectivity and postural control further support the notion of deficits in sensory integration. Connectivity between the cerebellum and the parietal cortex was implicated across multiple networks, and it is important for sensorimotor integration during postural control tasks [Jacobs and Horak, 2007]. Cerebellar connectivity with the somatosensory cortex was also associated with postural sway. Together, these correlations are perhaps indicative of dysfunctional sensorimotor integration in the UHR group due to dysfunctional cerebello‐cortical connectivity. Previous work has demonstrated that cerebellar patients have deficits in postural control [Morton and Bastian, 2003, 2004], cerebellar volume is associated with balance in young and older adults [Bernard and Seidler, 2013], and the cerebellum is functionally active during balance as well [Ouchi et al., 1999]. However, it is notable that correlations between cerebello‐cortical connectivity and postural sway were seen across numerous cerebellar lobules that are associated with non‐motor cortical areas (lobules VIIb, Crus I, and posterior vermal lobules; [Bernard et al., 2012] in addition to lobule V which is connected with primary motor cortex in healthy individuals [Bernard et al., 2012]). Our findings highlight the importance of motor networks as evidenced by the negative correlation between lobule V connectivity and sway area on the ECCB condition, but also the potential interference from higher level processing given the positive correlations between the cerebellum and non‐motor brain regions in the prefrontal and temporal cortices [Bernard and Seidler, 2013].
Within our UHR group, the postural sway on the eyes closed conditions (ECCB and ECOB) was positively correlated with negative symptoms, as measured using the SIPS. Individuals with the largest degree of postural sway had more severe symptoms. Similar relationships have been described in high‐risk groups and in schizophrenia. Body movements during social interactions (movements coded during video‐taped role play involving two people) are correlated with negative symptoms in schizophrenia [Kupper et al., 2010]. Movement abnormalities (force variability and involuntary dyskinetic movements, respectively) in schizotypal personality disorder have also been linked to both negative symptoms [Neumann and Walker, 2003] and general symptomatology [Mittal et al., 2007], and predict negative symptoms 1 year later [Mittal et al., 2007]. Furthermore, dyskinetic movements of the head and upper body were greater in high‐risk individuals who eventually converted to psychosis compared to those who did not convert [Mittal and Walker, 2007]. The authors speculated that movement abnormalities may be indicative of abnormal neural circuitry that is also associated with psychosis [Mittal and Walker, 2007]. However, in these studies positive symptom severity was also implicated. Here, the specificity of the relationship between postural control deficits and negative symptoms may therefore reflect disordered underlying circuitry common to both of these factors.
Although prior work has indicated that both schizophrenia patients, as well as their siblings have disrupted cerebello‐cortical connectivity [Collin et al., 2011; Repovš and Barch, 2012; Repovs et al., 2011] and that there are cerebellar morphological differences in UHR individuals [Borgwardt et al., 2007; Dean et al., in press; Pantelis et al., 2003], to our knowledge this is the first study to directly investigate distinct resting state cerebellar networks in UHR individuals. Indeed, across multiple networks we found decreased connectivity in the UHR individuals. Anterior cerebellar networks more typically associated with motor cortical regions as well as posterior cerebellar networks associated with cognitive and association regions of the cortex [Bernard et al., 2012; Krienen and Buckner, 2009; O'Reilly et al., 2010] were both impacted in the UHR individuals. Specifically, the decreased connectivity of the network for lobules I–IV is largely consistent with evidence from schizophrenia patients indicating that connectivity in the right anterior cerebellum was especially impacted [Collin et al., 2011]. We have expanded on these findings however to demonstrate decreased connectivity in several additional cerebello‐cortical networks, including those in both the posterior cerebellum and cerebellar vermis. Furthermore, consistent with the work in siblings, we also demonstrated decreased cerebello‐cortical connectivity with the frontal‐parietal network [Repovs et al., 2011], as connectivity between several lobules and the parietal cortex was decreased relative to controls. These findings provide evidence for widespread dysfunctional interactions between the cerebellum and cerebral cortex in UHR populations. Ongoing longitudinal work will allow us to investigate whether or not anterior motor or posterior prefrontal cognitive cerebellar networks are differentially impacted with disease progression.
Crucially, we also found significant relationships between cerebello‐cortical network connectivity and both symptom severity and postural control. Negative symptoms were associated with greater connectivity between Crus II and the parietal cortex, which is associated with sensory integration during postural control [Jacobs and Horak, 2007]. Given this finding, coupled with the correlations between postural sway and cerebello‐parietal connectivity, negative symptoms may be uniquely related to sensorimotor integration deficits and cerebellar dysfunction. Furthermore, in healthy young adults, the resting state networks of Crus II include prefrontal and temporal lobe regions important for cognitive function [Bernard et al., 2012]. The negative symptom domain includes anhedonia and attentional dysfunction [Andreasen and Olsen, 1982], and this particular cerebello‐cortical network would contribute to these factors. Thus, based on the characteristics of the negative symptom domain, and the known resting state connectivity of Crus II, this connectivity is particularly informative.
Given that there are distinct resting state cortico‐cerebellar networks [Bernard et al., 2012] and the diverse behavioral contributions of the cerebellum [Stoodley and Schmahmann, 2009], it is perhaps not surprising that there were also associations with positive symptoms. Positive symptoms were also associated with vermis X connectivity with the orbitofrontal cortex, and were highly distinct from the negative symptom correlations. Although resting state networks of vermis X alone are not robust in healthy adults [Bernard et al., 2012], cortically driven analyses have linked this region with the default mode network [Buckner et al., 2011]. Typically, the default mode network deactivates during task performance, but individuals with schizophrenia fail to deactivate this region relative to controls [Whitfield‐Gabrieli et al., 2009]. Whitfield‐Gabrieli et al. [2009] speculate that this dysfunctional default mode network deactivation is associated with positive symptoms as well as cognitive dysfunction in schizophrenia. Thus, the implication of a cerebellar node associated with the default mode network and positive symptoms is quite interesting. Importantly, positive and negative symptoms are associated with distinct cerebello‐cortical resting state networks, further highlighting the dissociability of these symptom domains. Future longitudinal work following UHR individuals will allow us to better understand how topographically distinct cerebello‐cortical networks change with respect to disease severity.
This link between connectivity and symptom severity across both domains further supports the notion of cognitive dysmetria such that interactions between the cerebellum and cortex are altered in schizophrenia, resulting in disordered thought [Andreasen et al., 1996, 1998], and this is extended to UHR populations where these aberrant connectivity patterns may be indicative of future conversion to psychosis. Although our results indicated that greater connectivity was associated with worse outcomes (symptom severity and postural sway), this is still highly indicative of dysfunctional cortico‐cerebellar interactions and processing. Disordered sensorimotor integration seems to share a neural substrate with the disordered thought seen in UHR individuals as evidenced by the relationships between cerebellar connectivity, symptom severity, and postural sway.
Importantly, the postural control deficits described here and their cerebellar substrates are likely distinct from the dyskinesias described in previous work [Mittal and Walker, 2007; Mittal et al., 2008, 2007]. These dyskinesias have been proposed to be markers of striatal dysfunction and are associated with a variety of symptom domains [Mittal and Walker, 2007; Mittal et al., 2008, 2007, 2010]. Here, however, postural control was specifically associated with negative symptoms, and cerebello‐cortical networks were also associated with symptom severity. Although there is indeed overlap between symptom correlates of these motor deficits in the negative domain, the specificity of the postural sway correlates indicates a potentially distinct and important role for the cerebellum in symptomatology in UHR populations and in the etiology of schizophrenia. Future longitudinal work is however necessary to understand how these factors relate to disease progression and symptomatology, and indeed this work is ongoing. Our longitudinal findings may reveal that postural sway is an important new biomarker indicative of disease progression in UHR populations.
Lastly, there are several limitations to this work. Importantly, there are issues related to the confounding effects of alcohol consumption. Although we ruled out individuals with alcohol dependence and completed additional analyses to investigate any relationships between the alcohol consumption and postural sway, we were unable to index binge drinking in this population and our measures are based on self‐report. Thus, while we are less likely to have confounds associated with chronic alcohol abuse/dependence as has been previously reported [Sullivan et al., 2010], binge drinking may at least in part be impacting our results. Future work will benefit from assessing binge drinking directly. Additionally, we did not investigate potential gender differences in the resting state networks, due to sample size. Exploratory analyses indicated that there were no effects of gender on postural sway (all analyses were non‐significant), but future work with larger samples would benefit from investigating this important question. Furthermore, although we used a commonly accepted multiple comparisons correction in our resting state analyses, we did include a large number of networks. Because so little is known about these networks in UHR populations, we took a more lenient statistical approach and did not apply any additional statistical corrections. However, we did take a more statistically rigorous approach than comparable past analyses in aging and patient populations [Bernard et al., 2013; Kwak et al., 2010]. Finally, and most importantly, we note that the UHR individuals investigated here represent a largely heterogeneous group. Only a subset of these individuals will go on to develop schizophrenia or another disorder, and many will end up with no formal diagnosis.
Supporting information
Supplementary Figure S1. Cerebello‐cortical connectivity and symptom severity in UHR individuals. Axial slices are presented, with the left hemisphere presented on the left using anatomical conventions. Regions in blue indicate correlations with negative symptoms and Crus I connectivity, while regions in red indicate correlations with positive symptoms and Vermis X connectivity. L: left; R: right, presented with the left‐most slice also provide image orientation information.
Supplementary Figure S2. Cerebello‐cortical connectivity and postural sway in UHR individuals. Axial slices are presented, with the left hemisphere presented on the left. Blue regions indicate negative correlations such that weaker connectivity was associated with greater sway (worse performance). Red areas are indicative of correlations wherein greater connectivity was indicative of greater sway. L: left; R: right, presented with the upper‐left slice also provide image orientation information.
Supplementary Table S1. MNI coordinates of cerebellar networks in control participants. Negative and positive x‐values indicate locations in the left and right hemispheres, respectively. Regions in bold font are indicative of the peak voxel in a particular cluster.
REFERENCES
- Andersson JLR, Jenkinson M, Smith S (2010): Non‐linear registration, aka spatial normalisation. FMRIB technical report TR07JA2.
- Andreasen NC, O'Leary DS, Cizadlo T, Arndt S, Rezai K, Ponto LL, Watkins GL, Hichwa RD (1996): Schizophrenia and cognitive dysmetria: A positron‐emission tomography study of dysfunctional prefrontal‐thalamic‐cerebellar circuitry. Proc Natl Acad Sci USA 93:9985–9990. [DOI] [PMC free article] [PubMed] [Google Scholar]
- Andreasen NC, Olsen S (1982): Negative v positive schizophrenia. Arch Gen Psychiatry 39:789–794. [DOI] [PubMed] [Google Scholar]
- Andreasen NC, Paradiso S, O'Leary DS (1998): “Cognitive dysmetria” as an integrative theory of schizophrenia: A dysfunction in cortical‐subcortical‐cerebellar circuitry? Schizophr Bull 24:203–218. [DOI] [PubMed] [Google Scholar]
- Andreasen NC, Pierson R (2008): The role of the cerebellum in schizophrenia. Biol Psychiatry 64:81–88. [DOI] [PMC free article] [PubMed] [Google Scholar]
- Bernard JA, Peltier SJ, Wiggins JL, Jaeggi SM, Buschkuehl M, Fling BW, Kwak Y, Jonides J, Monk CS, Seidler RD (2013): Disrupted cortico‐cerebellar connectivity in older adults. Neuroimage 83:103–119. [DOI] [PMC free article] [PubMed] [Google Scholar]
- Bernard JA, Seidler RD, Hassevoort KM, Benson BL, Welsh RC, Wiggins JL, Jaeggi SM, Buschkuehl M, Monk CS, Jonides J, Peltier SJ (2012): Resting state cortico‐cerebellar functional connectivity networks: A comparison of anatomical and self‐organizing map approaches. Front Neuroanat 6:31. [DOI] [PMC free article] [PubMed] [Google Scholar]
- Bernard JA, Seidler RD (2013): Relationships between regional cerebellar volume and sensorimotor and cognitive function in young and older adults. Cerebellum 12:721–737. [DOI] [PMC free article] [PubMed] [Google Scholar]
- Bilder RM (2001): Schizophrenia as a neurodevelopmental disorder. Curr Opin Psychiatry 14:9–15. [Google Scholar]
- Biswal B, Yetkin FZ, Haughton VM, Hyde JS (1995): Functional connectivity in the motor cortex of resting. Magn Reson Med 34:537–541. [DOI] [PubMed] [Google Scholar]
- Biswal BB, Mennes M, Zuo X‐N, Gohel S, Kelly C, Smith SM, Beckmann CF, Adelstein JS, Buckner RL, Colcombe S, Dogonowski A‐M, Ernst M, Fair D, Hampson M, Hoptman MJ, Hyde JS, Kiviniemi VJ, R Kötter, L S‐J, Lin C‐P, McMahon K, Monk CS, Mostofsky SH, Nagel BJ, Pekar JJ, Peltier SJ, Petersen SE, Riedl V, Rombouts SARB, Rympa B, Schlaggar BL, Schmidt S, Seidler RD, Siegle GJ, Sorg C, Teng G‐J, Veijola J, Villringer A, Walter M, Wang L, Weng X‐C, S Whitfield‐Gabrieli, Williamson P, Windischberger C, Zang Y‐F, Zhang H‐Y, Castellanos FC, Milham MP (2010): Toward discovery science of human brain function. Proc Natl Acad Sci USA 107:4734–4739. [DOI] [PMC free article] [PubMed] [Google Scholar]
- Bolbecker AR, Hong SL, Kent JS, Klaunig MJ, O'Donnell BF, Hetrick WP (2011): Postural control in bipolar disorder: Increased sway area and decreased dynamical complexity. PLoS One 6:e19824. [DOI] [PMC free article] [PubMed] [Google Scholar]
- Borgwardt SJ, Riecher‐Rössler A, Dazzan P, Chitnis X, Aston J, Drewe M, Gschwandtner U, Haller S, Pflüger M, Rechsteiner E, D'Souza M, Stieglitz R‐D, Radü E‐W, McGuire PK (2007): Regional gray matter volume abnormalities in the at risk mental state. Biol Psychiatry 61:1148–1156. [DOI] [PubMed] [Google Scholar]
- Buckner RL, Krienen FM, Castellanos A, Diaz JC, Yeo BTT (2011): The organization of the human cerebellum estimated by intrinsic functional connectivity. J Neurophysiol 106:2322–2345. [DOI] [PMC free article] [PubMed] [Google Scholar]
- Chumbley JR, Friston KJ (2009): False discovery rate revisited: FDR and topological inference using Gaussian random fields. Neuroimage 44:62–70. [DOI] [PubMed] [Google Scholar]
- Collin G, Hulshoff Pol HE, Haijma SV, Cahn W, Kahn RS, van den Heuvel MP (2011): Impaired cerebellar functional connectivity in schizophrenia patients and their healthy siblings. Front Psychiatry 2:73. [DOI] [PMC free article] [PubMed] [Google Scholar]
- Cornblatt BA, Lencz T, Obuchowski M (2002): The schizophrenia prodrome: Treatment and high‐risk perspectives. Schizophr Res 54:177–186. [DOI] [PubMed] [Google Scholar]
- Cornblatt BA, Lencz T, Smith CW, Correll CU, Auther AM, Nakayama E (2003): The schizophrenia prodrome revisited: A neurodevelopmental perspective. Schizophr Bull 29:633–651. [DOI] [PubMed] [Google Scholar]
- Dazzan P, Soulsby B, Mechelli A, Wood SJ, Velakoulis D, Phillips LJ, Yung AR, Chitnis X, Lin A, Murray RM, McGorry PD, McGuire PK, Pantelis C (2012): Volumetric abnormalities predating the onset of schizophrenia and affective psychoses: An MRI study in subjects at ultrahigh risk of psychosis. Schizophr Bull 38:1083–1091. [DOI] [PMC free article] [PubMed] [Google Scholar]
- Dean DJ, Bernard JA, Orr JM, Pelletier AL, Gupta T, Carrol EE, Mittal VA: Cerebellar morphology and procedural learning impairment in neuroleptic‐naive youth at ultrahigh risk of psychosis. Clin Psychol Sci (in press). [DOI] [PMC free article] [PubMed] [Google Scholar]
- Deshmukh A, Rosenbloom MJ, Pfefferbaum A, Sullivan EV (2002): Clinical signs of cerebellar dysfunction in schizophrenia, alcoholism, and their comorbidity. Schizophr Res 57:281–291. [DOI] [PubMed] [Google Scholar]
- Diedrichsen J (2006): A spatially unbiased atlas template of the human cerebellum. Neuroimage 33:127–138. [DOI] [PubMed] [Google Scholar]
- Diedrichsen J, Balsters JH, Flavell J, Cussans E, Ramnani N (2009): A probabilistic MR atlas of the human cerebellum. Neuroimage 46:39–46. [DOI] [PubMed] [Google Scholar]
- First M, Spitzer R, Gibbon M, Williams J (1995): Structured Clinical Interview for the DSM‐IV Axis I Disorders (SCID‐I), Patient Edition. Washington, DC: American Psychiatric Press. [Google Scholar]
- Greve DN, Fischl B (2009): Accurate and robust brain image alignment using boundary‐based registration. Neuroimage 48:63–72. [DOI] [PMC free article] [PubMed] [Google Scholar]
- Howes OD, Montgomery AJ, Asselin M‐C, Murray RM, Valli I, Tabraham P, Bramon‐Bosch E, Valmaggia L, Johns L, Broome M, McGuire PK, Grasby PM (2009): Elevated striatal dopamine function linked to prodromal signs of schizophrenia. Arch Gen Psychiatry 66:13–20. [DOI] [PubMed] [Google Scholar]
- Jacobs JV, Horak FB (2007): Cortical control of postural responses. J Neural Transm 114:1339–1348. [DOI] [PMC free article] [PubMed] [Google Scholar]
- Jenkinson M, Bannister P, Brady M, Smith SM (2002): Improved optimization for the robust and accurate linear registration and motion correction of brain images. Neuroimage 17:825–841. [DOI] [PubMed] [Google Scholar]
- Jenkinson M, Smith SM (2001): A global optimisation method for robust affine registration of brain images. Med Image Anal 5:143–156. [DOI] [PubMed] [Google Scholar]
- Jung WH, Borgwardt S, Fusar‐Poli P, Kwon JS (2012): Gray matter volumetric abnormalities associated with the onset of psychosis. Front Psychiatry 3:101. [DOI] [PMC free article] [PubMed] [Google Scholar]
- Jung WH, Kim JS, Jang JH, Choi J‐S, Jung MH, Park J‐Y, Han JY, Choi C‐H, Kang D‐H, Chung CK, Kwon JS (2011): Cortical thickness reduction in individuals at ultra‐high‐risk for psychosis. Schizophr Bull 37:839–849. [DOI] [PMC free article] [PubMed] [Google Scholar]
- Kent JS, Hong SL, Bolbecker AR, Klaunig MJ, Forsyth JK, O'Donnell BF, Hetrick WP (2012): Motor deficits in schizophrenia quantified by nonlinear analysis of postural sway. PLoS One 7:e41808. [DOI] [PMC free article] [PubMed] [Google Scholar]
- Krienen FM, Buckner RL (2009): Segregated fronto‐cerebellar circuits revealed by intrinsic functional connectivity. Cereb Cortex 19:2485–2497. [DOI] [PMC free article] [PubMed] [Google Scholar]
- Kuo AD, Speers RA, Peterka RJ, Horak FB (1998): Effect of altered sensory conditions on multivariate descriptors of human postural sway. Exp Brain Res 122:185–195. [DOI] [PubMed] [Google Scholar]
- Kupper Z, Ramseyer F, Hoffmann H, Kalbermatten S, Tschacher W (2010): Video‐based quantification of body movement during social interaction indicates the severity of negative symptoms in patients with schizophrenia. Schizophr Res 121:90–100. [DOI] [PubMed] [Google Scholar]
- Kwak Y, Peltier S, Bohnen NI, Müller MLTM, Dayalu P, Seidler RD (2010): Altered resting state cortico‐striatal connectivity in mild to moderate stage Parkinson's disease. Front Syst Neurosci 4:143. [DOI] [PMC free article] [PubMed] [Google Scholar]
- Liddle PF (1987): The symptoms of chronic schizophrenia. A re‐examination of the positive‐negative dichotomy. Br J Psychiatry 151:145–151. [DOI] [PubMed] [Google Scholar]
- Liu H, Fan G, Xu K, Wang F (2011): Changes in cerebellar functional connectivity and anatomical connectivity in schizophrenia: A combined resting‐state functional MRI and diffusion tensor imaging study. J Magn Reson Imaging 34:1430–1438. [DOI] [PMC free article] [PubMed] [Google Scholar]
- Martin C, Pollock N, Bukstein O, Lynch K (2000): Inter‐rater reliability of the SCID alcohol and substance use disorders section among adolescents. Drug Alcohol Depend 59:173–176. [DOI] [PubMed] [Google Scholar]
- Marvel CL, Schwartz BL, Rosse RB (2004): A quantitative measure of postural sway deficits in schizophrenia. Schizophr Res 68:363–372. [DOI] [PubMed] [Google Scholar]
- Marvel CL, Turner BM, O'Leary DS, Johnson HJ, Pierson RK, Ponto LLB, Andreasen NC (2007): The neural correlates of implicit sequence learning in schizophrenia. Neuropsychology 21:761–777. [DOI] [PMC free article] [PubMed] [Google Scholar]
- Miller TJ, Mcglashan TH, Woods SW, Stein K, Driesen N, Corcoran CM, Hoffman R, Davidson L (1999): Symptom assessment in schizophrenic prodromal states. Psychiatr Q 70:273–287. [DOI] [PubMed] [Google Scholar]
- Mittal VA, Neumann C, Saczawa M, Walker EF (2008): Longitudinal progression of movement abnormalities in relation to psychotic symptoms in adolescents at high risk of schizophrenia. Arch Gen Psychiatry 65:165–171. [DOI] [PubMed] [Google Scholar]
- Mittal VA, Tessner KD, Trottman HD, Esterberg M, Dhrub SH, Simeonova DI, McMillan AL, Murphy E, Saczawa ME, Walker EF (2007): Movement abnormalities and the progression of prodromal symptomatology in adolescents at risk for psychotic disorders. J Abnorm Psychol 116:260–267. [DOI] [PubMed] [Google Scholar]
- Mittal VA, Walker EF (2007): Movement abnormalities predict conversion to Axis I psychosis among prodromal adolescents. J Abnorm Psychol 116:796–803. [DOI] [PubMed] [Google Scholar]
- Mittal VA, Walker EF, Bearden CE, Walder D, Trottman H, Daley M, Simone A, Cannon TD (2010): Markers of basal ganglia dysfunction and conversion to psychosis: Neurocignitive deficits and dyskinesias in the prodromal period. Biol Psychiatry 68:93–99. [DOI] [PMC free article] [PubMed] [Google Scholar]
- Morton SM, Bastian AJ (2003): Relative contributions of balance and voluntary leg‐coordination deficits to cerebellar gait ataxia. J Neurophysiol 89:1844–1856. [DOI] [PubMed] [Google Scholar]
- Morton SM, Bastian AJ (2004): Cerebellar control of balance and locomotion. Neuroscientist 10:247–259. [DOI] [PubMed] [Google Scholar]
- Neumann CS, Walker EF (2003): Neuromotor functioning in adolescents with schizotypal personality disorder: Associations with symptoms and neurocognition. Schizophr Bull 29:285–298. [DOI] [PubMed] [Google Scholar]
- Odenrick P, Sandstedt P (1984): Development of postural sway in the normal child. Hum Neurobiol 3:241–244. [PubMed] [Google Scholar]
- Oliveira L, Simpson D, Nadal J (1996): Calculation of area of stabolometric signals using principal component analysis. Physiol Meas 17:305–312. [DOI] [PubMed] [Google Scholar]
- O'Reilly JX, Beckmann CF, Tomassini V, Ramnani N, Johansen‐Berg H (2010): Distinct and overlapping functional zones in the cerebellum defined by resting state functional connectivity. Cereb Cortex 20:953–965. [DOI] [PMC free article] [PubMed] [Google Scholar]
- Ouchi Y, Okada H, Yoshikawa E, Nobezawa S, Futatsubashi M (1999): Brain activation during maintenance of standing postures in humans. Brain 122:329–338. [DOI] [PubMed] [Google Scholar]
- Pantelis C, Velakoulis D, McGorry PD, Wood SJ, Suckling J, Phillips LJ, Yung AR, Bullmore ET, Brewer W, Soulsby B, Desmond P, McGuire PK (2003): Neuroanatomical abnormalities before and after onset of psychosis: A cross‐sectional and longitudinal MRI comparison. Lancet 361:281–288. [DOI] [PubMed] [Google Scholar]
- Power JD, Barnes KA, Snyder AZ, Schlaggar BL, Petersen SE (2012): Spurious but systematic correlations in functional connectivity MRI networks arise from subject motion. Neuroimage 59:2142–2154. [DOI] [PMC free article] [PubMed] [Google Scholar]
- Prieto T, Myklebust J, Myklebust B (1992): Postural steadiness and ankle joint compliance in the elderly. IEEE Eng Med Biol Mag 11:25–27. [Google Scholar]
- Repovš G, Barch DM (2012): Working memory related brain network connectivity in individuals with schizophrenia and their siblings. Front Hum Neurosci 6:137. [DOI] [PMC free article] [PubMed] [Google Scholar]
- Repovs G, Csernansky JG, Barch DM (2011): Brain network connectivity in individuals with schizophrenia and their siblings. Biol Psychiatry 69:967–973. [DOI] [PMC free article] [PubMed] [Google Scholar]
- Schmahmann JD, Doyon J, Mcdonald D, Holmes C, Lavoie K, Hurwitz AS, Kabani N, Toga A, Evans A, Petrides M (1999): Three‐dimensional MRI atlas of the human cerebellum in proportional stereotaxic space. Neuroimage 260:233–260. [DOI] [PubMed] [Google Scholar]
- Simon AE, Cattapan‐Ludewig K, Zmilacher S, Arbach D, Gruber K, Dvorsky DN, Roth B, Isler E, Zimmer A, Umbricht D (2007): Cognitive functioning in the schizophrenia prodrome. Schizophr Bull 33:761–771. [DOI] [PMC free article] [PubMed] [Google Scholar]
- Stoodley CJ, Schmahmann JD (2009): NeuroImage functional topography in the human cerebellum: A meta‐analysis of neuroimaging studies. Neuroimage 44:489–501. [DOI] [PubMed] [Google Scholar]
- Sullivan EV, Rohlfing T, Pfefferbaum A (2010): Pontocerebellar volume deficits and ataxia in alcoholic men and women: No evidence for “telescoping”. Psychopharmacology (Berl) 208:279–290. [DOI] [PMC free article] [PubMed] [Google Scholar]
- Sullivan EV, Rosenbloom MJ, Pfefferbaum A (2004): Balance and gait deficits in schizophrenia compounded by the comorbidity of alcoholism. Am J Psychiatry 161:751–755. [DOI] [PubMed] [Google Scholar]
- Van Dijk KRA, Hedden T, Venkataraman A, Evans KC, Lazar SW, Buckner RL (2010): Intrinsic functional connectivity as a tool for human connectomics: Theory, properties, and optimization. J Neurophysiol 103:297–321. [DOI] [PMC free article] [PubMed] [Google Scholar]
- Walker E, Lewis N, Loewy R, Palyo S (1999): Motor dysfunction and risk for schizophrenia. Dev Psychopathol 11:509–523. [DOI] [PubMed] [Google Scholar]
- Wassink TH, Andreasen NC, Nopoulos P, Flaum M (1999): Cerebellar morphology as a predictor of symptom and psychosocial outcome in schizophrenia. Biol Psychiatry 45:41–48. [DOI] [PubMed] [Google Scholar]
- White T, Anjum A, Schulz SC (2006): The schizophrenia prodrome. Am J Psychiatry 163:376–380. [DOI] [PubMed] [Google Scholar]
- Whitfield‐Gabrieli S, Nieto‐Castanon A (2012): Conn: A functional connectivity toolbox for correlated and anticorrelated brain networks. Brain Connect 2:125–141. [DOI] [PubMed] [Google Scholar]
- Whitfield‐Gabrieli S, Thermenos HW, Milanovic S, Tsuang MT, Stephen V, Mccarley RW, Shenton ME, Alan I, Nieto‐castanon A, Laviolette P, Gabrieli JDE, Seidman LJ (2009): Hyperactivity and hyperconnectivity of the default network in schizophrenia and in first‐degree relatives of persons with schizophrenia. Proc Natl Acad Sci USA 106:1279–1283. [DOI] [PMC free article] [PubMed] [Google Scholar]
- Yung AR, Phillips LJ, Yuen HP, McGorry PD (2004): Risk factors for psychosis in an ultra high‐risk group: Psychopathology and clinical features. Schizophr Res 67:131–142. [DOI] [PubMed] [Google Scholar]
Associated Data
This section collects any data citations, data availability statements, or supplementary materials included in this article.
Supplementary Materials
Supplementary Figure S1. Cerebello‐cortical connectivity and symptom severity in UHR individuals. Axial slices are presented, with the left hemisphere presented on the left using anatomical conventions. Regions in blue indicate correlations with negative symptoms and Crus I connectivity, while regions in red indicate correlations with positive symptoms and Vermis X connectivity. L: left; R: right, presented with the left‐most slice also provide image orientation information.
Supplementary Figure S2. Cerebello‐cortical connectivity and postural sway in UHR individuals. Axial slices are presented, with the left hemisphere presented on the left. Blue regions indicate negative correlations such that weaker connectivity was associated with greater sway (worse performance). Red areas are indicative of correlations wherein greater connectivity was indicative of greater sway. L: left; R: right, presented with the upper‐left slice also provide image orientation information.
Supplementary Table S1. MNI coordinates of cerebellar networks in control participants. Negative and positive x‐values indicate locations in the left and right hemispheres, respectively. Regions in bold font are indicative of the peak voxel in a particular cluster.