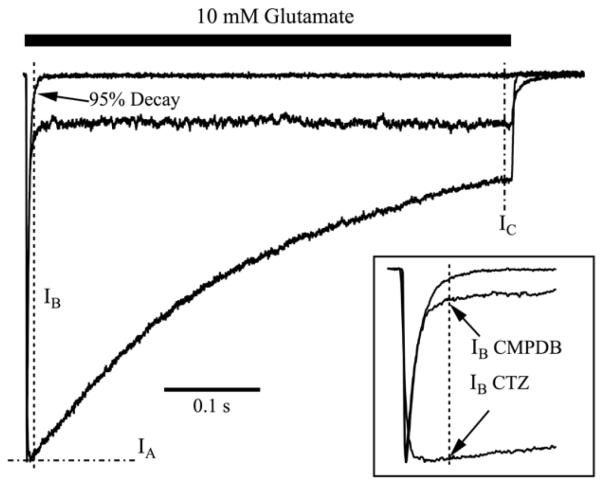
Figure 3. Quantitative analysis of decay properties among modulators.
Shown are three different types of decay patterns that were observed for WT GluA2o. The control trace has a rapid decay of the current from the peak, and almost no sustained current during the pulse; the black bar represents application of 10 mM glutamate for 500 ms. The CTZ current trace shows a slow decay throughout the 500 ms pulse of glutamate. The CMPDB trace shows an immediate, rapid decay to a sustained current that is larger than baseline. These three traces illustrate the three representative patterns that were observed for various combinations of modulators and mutant receptors shown in Figure 2. Traces have been normalized to their peak amplitudes to emphasize the different kinetics of decay. To quantitatively analyze these differences, measurements were made of the peak amplitude (IA), the amplitude measured at the time of 95% decay of control responses in the absence of modulator (IB), and the amplitude just prior to termination of the pulse of glutamate (IC). For the control trace, the current at which there is 95% decay from the peak amplitude is marked with an arrow. The inset shows an expanded view of the peak amplitudes. Values for each condition are presented in Table 2. Traces with modulators are single sweeps. Trace of 10 mM glutamate alone is an average of 25 sweeps.

