

Abstract
Recent neuroimaging and behavioral studies have revealed that children with new onset epilepsy already exhibit brain structural abnormalities and cognitive impairment. How the organization of large‐scale brain structural networks is altered near the time of seizure onset and whether network changes are related to cognitive performances remain unclear. Recent studies also suggest that regional brain volume covariance reflects synchronized brain developmental changes. Here, we test the hypothesis that epilepsy during early‐life is associated with abnormalities in brain network organization and cognition. We used graph theory to study structural brain networks based on regional volume covariance in 39 children with new‐onset seizures and 28 healthy controls. Children with new‐onset epilepsy showed a suboptimal topological structural organization with enhanced network segregation and reduced global integration compared with controls. At the regional level, structural reorganization was evident with redistributed nodes from the posterior to more anterior head regions. The epileptic brain network was more vulnerable to targeted but not random attacks. Finally, a subgroup of children with epilepsy, namely those with lower IQ and poorer executive function, had a reduced balance between network segregation and integration. Taken together, the findings suggest that the neurodevelopmental impact of new onset childhood epilepsies alters large‐scale brain networks, resulting in greater vulnerability to network failure and cognitive impairment. Hum Brain Mapp 35:3661–3672, 2014. © 2014 Wiley Periodicals, Inc.
Keywords: epilepsy, structural network, graph theory, neurodevelopment, cognition
INTRODUCTION
The structural organization of the human brain is highly economical and nonrandom [Bullmore and Sporns, 2012], achieved through an orderly growth process, with age‐dependent changes that optimize efficiency [Hagmann et al., 2010]. Thus, the configuration of brain regions and their connections are progressively modified into a small‐world topology that maximizes simultaneous local and global information processing. Indeed, functional modules within the brain are segregated into specialized regions, with the concurrent integration of these regions into a global network [Fair et al., 2009]. These topological properties likely confer an adaptive advantage, increasing the capacity to process information and resist adverse network perturbations.
Neurological diseases with onset during critical stages of brain maturation may threaten this orderly neurodevelopmental process. An especially pertinent model in this regard is childhood epilepsy, which is very common and known to affect cognition and behavior with persisting adverse effects on lifespan achievement even if the seizures remit and treatment is stopped [Lin et al., 2012a]. The degree to which childhood epilepsies exert a significant effect on network brain organization and subsequent cognition remains uncertain. A promising theory suggests that the formation of abnormal networks associated with epileptogenesis in early life leads to a disruption in normal brain network development and cognition [Hernan et al., 2013]. However, the timing, pattern and mechanisms by which the organization of structural networks in the developing brain may be altered are unclear. Examining children with new onset epilepsies and examining their brain network organization over time, something that is largely unexplored to date, may most directly assess these issues. Most knowledge regarding large‐scale network topology in epilepsy has focused on data from adults with long to medium term idiopathic generalized or temporal lobe epilepsy (average epilepsy duration 7–21 years) [Bernhardt et al., 2011; Bonilha et al., 2012; Kramer et al., 2010; Liao et al., 2010; Vaessen et al., 2012; Vlooswijk et al., 2011; Zhang et al., 2011]. The altered topologies found in these studies are often attributed to the seizure‐dependent reinforcement of an epileptogenic configuration of the brain network. As such, epilepsy is hypothesized to affect not only the brain location where seizures are postulated to start, but may also have profound effects over distant brain regions, which are drawn into a pathological network reconfiguration.
Interestingly, our group and others have demonstrated that children with new‐onset epilepsy already exhibited regional [Lin et al., 2012b; Pulsipher et al., 2011] and widespread [Tosun et al., 2007; Widjaja et al., 2012; Yang et al., 2012] changes in brain volume and connectivity when their epilepsy begins, suggesting that factors other than recurrent seizures or iatrogenic medication effects are critically involved in the creation of the altered network. When examining adults with chronic epilepsy, early‐life seizures are associated with poorer cognitive performances and a greater burden of brain structural abnormalities compared with later life onset seizures [Hermann et al., 2002; Kaaden and Helmstaedter, 2009]. Together, these converging sets of evidence point to an adverse neurodevelopmental impact of childhood onset epilepsy, with rearrangement of brain structure in epilepsy that may lead to epileptogenesis and suboptimal neurocognitive development. Nonetheless, it is unclear when, how and why such large‐scale compromises occur in the brain organization of children with new‐onset epilepsy.
In this study, we investigated structural brain networks, inferred from gray matter volumes, in children with new‐ and recent‐onset epilepsy and healthy controls. Previous studies revealed that volumetric covariances between brain regions might be related to anatomical connections within a common circuit [Bernhardt et al., 2008; Lerch et al., 2006; Mechelli et al., 2005]. Specifically, homotopic brain regions between two hemispheres have highly inter‐correlated gray matter volumes [Mechelli et al., 2005] and morphometric covariances of cortical thickness have delineated structural networks that closely mirror diffusion tensor imaging (DTI) tracks [Bernhardt et al., 2008; Lerch et al., 2006]. In animal tracing studies, cortical structural characteristics including thickness, folding and neuronal density have predicted anatomical connections between cortical regions [Barbas and Rempel‐Clower, 1997; Dombrowski et al., 2001]. Although the mechanism of this coordinated structural network is unknown, it has been attributed to mutually trophic [Pezawas et al., 2004], developmental [Bush and Allman, 2003; Zhang and Sejnowski, 2000] and experience‐related plasticity [Draganski et al., 2004].
We employed postprocessing techniques to quantitatively assess brain tissue volume in global and regional scales, constructing structural networks reflecting the relationship between regional brain volumes, which were evaluated with graph theory and mathematical modeling of network properties. As the first study to use graph theory in new‐onset epilepsy, we hypothesized that children in the early course of epilepsy, compared with healthy controls, will already exhibit a disruption in the global organization of structural brain networks, possibly associated with aberrant network segregation and integration, Further, we hypothesized that the altered topological organization will be associated with two common neuropsychological impairments in children with epilepsy: lower IQ and poorer executive function.
METHODS
Subjects
We studied a group composed of 67 subjects (39 children with new‐onset epilepsy and 28 healthy controls) recruited from the Pediatric Neurology Clinics at the University of Wisconsin Hospital and Clinics and the Marshfield Clinic. Initial inclusion criteria included a diagnosis of epilepsy within the past 12 months. Among the children with epilepsy, 21 were diagnosed with localization related epilepsy (LRE) (11.6 ± 2.68 years, 12 males) and 18 with idiopathic generalized epilepsy (IGE) (15 ± 3.3 years, 7 males). Each child's epilepsy syndrome was defined in a research consensus meeting by the research pediatric neurologist who reviewed all available clinical data (e.g., seizure description and phenomenology, EEG, clinical imaging, neurodevelopmental history) while blinded to all research cognitive, behavioral, and neuroimaging data. Two levels of syndromic classification were undertaken including a broad‐band syndrome classification (i.e., IGE and LRE). Included in IGE were children with Juvenile Myoclonic Epilepsy, Childhood Absence, Juvenile Absence, and IGE not otherwise specified (NOS). Included in LRE were children with Benign Epilepsy with Centrotemporal Spikes, Temporal Lobe Epilepsy, Frontal Lobe Epilepsy, and Focal NOS. All patients in the LRE group were considered to have “MRI‐negative” epilepsy. The routine clinical radiological MRI evaluation was reported as unremarkable in all patients with LRE.
First‐degree cousins were recruited as healthy controls (mean age 13.3 ± 3.28 years, 11 males), with no history of neurological or psychiatric illnesses. First‐degree cousins were chosen rather than siblings to minimize shared genetic factors that might contribute to anomalies in brain structure, while controlling for potential socioeconomic confounds.
All children were diagnosed with epilepsy according to the criteria defined by the International League Against Epilepsy (ILAE) [Engel, 2001], after a comprehensive review by a pediatric epileptologist. Families and children gave informed consent and assent to participate in this study. This study was approved by the Institutional Review Boards of the University of Wisconsin School of Medicine and Public Health, the University of California at Irvine, and the Medical University of South Carolina.
Table 1 provides the demographic characteristics of the research participants. Patients and controls were similar in age (one‐way ANOVA F (1,65) = 0.009, P = 0.92) and gender distribution (χ2 = 1.9, P = 0.4). When comparing LRE with IGE, there was a significant group effect (P = 0.005), with Tukey HSD demonstrating younger age in LRE compared with IGE; IGE and LRE groups did not significantly differ from controls (P = 0.09 and P = 0.07, respectively).
Table 1.
Demographic and clinical features of the study group
| Controls | IGE | LRE | |
|---|---|---|---|
| Number subjects | 28 | 18 | 21 |
| Baseline age (yr) | 13.2 (3.3) | 15.0 (3.3) | 11.6 (2.7) |
| Gender (F/M) | 17/11 | 11/7 | 9/12 |
| Age of epilepsy onset (yr) | — | 14.3 (3.4) | 10.9 (2.8) |
| Interval between diagnosis and MRI scan (mo) | — | 8.5 (3.8) | 7.8 (4.0) |
Date are shown as mean (standard deviation); F = female; M = male.
Image Acquisition
All subjects underwent MRI scans utilizing the same imaging protocol. In this study, we focused our analyses on T1‐weighted volumetric images (SPGR images—1.5 T GE Signa MR Scanner, TR = 24 ms, TE = 5 ms, flip angle = 40°, Slice thickness 1.5 mm, field of view (FOV) = 200 mm, matrix = 256 × 256).
Image Processing
All MR images underwent volumetric segmentation utilizing FreeSurfer version 5.1 with automatic segmentation according to the “Destrieux Atlas” [Destrieux et al., 2010]. This algorithm subdivides the human cerebral cortex into sulco‐gyral based cortical and subcortical regions of interest (ROI) by automatically assigning a neuroanatomical label to each location on a cortical surface model based on probabilistic information estimated from a manually labeled training set. All processed images were visually inspected to ensure cortical segmentation quality. The cortical tissue segmented into anatomical regions was overlaid onto the original T1 image in order to ensure that no segmentation errors occurred.
Adjacency Matrices and Graph Theory
From the image segmentation, we utilized the volumes from 171 anatomical ROIs for the construction of group‐wise adjacency matrices for: (1) controls; (2) all patients with epilepsy; (3) patients with LRE; and (4) patients with IGE. The ROIs utilized in this study are summarized in Supporting Information Table 1. Note that we deliberately included subcortical regions (in addition to cortical regions) because our previous work showed that volumes and shapes of these regions are altered in this group of patients [Lin et al., 2012b; Pulsipher et al., 2011, 2009]. The volumetric data from each region was individually adjusted based on the subject's total intracranial volume (i.e., regional volume = raw regional volume/total intracranial volume).
Adjacency matrices were constructed by evaluating the relationship between the adjusted volumes from each pair of ROIs across groups. The “link” between regions “i” and “j” was defined as the Pearson Correlation Coefficient between the volumes of structures “i” and “j” across all individuals in the following groups: (1) controls, (2) all children with epilepsy, (3) children with IGE and (4) children with LRE.
Hence, for each of the groups (controls, epilepsy, IGE and LRE), a connectivity matrix A was constructed, where each entry A ij corresponded to the correlation between the individual volumes of ROIs “i” and “j” in that clinical group. A ij is the weighted strength of connection between regions “i” and “j”. Employing graph theory terminology, the value of A ij can be understood as the weighted “link” between ‘nodes’ “i” and “j.” This process is summarized in Supporting Information Figure 1.
Network properties were calculated utilizing graph theory. We employed measures included in the brain connectivity toolbox (http://www.brain-connectivity-toolbox.net) to calculate graph theory‐based regional and global network properties from each group. Our adjacency matrices were constructed based on pair‐wise regional correlations and therefore included positive and negative correlations. Since negative links may represent an indirect measure of association, we assessed graph theoretical measures only on networks composed of positive links [Kaiser, 2011]. For each positive adjacency matrix, we investigated measures related to: (1) global network properties and (2) node properties (where each node corresponded to an anatomical ROI).
We chose global graph theoretical measures that could provide tangible information regarding global network properties and the impact of each node in the entire network. The graph measures chosen in this study were also aimed at illustrating regional or global disruption of connectivity properties that are theoretically relevant in the context of epilepsy and neurodevelopment.
The following node properties were evaluated: (1) degree, (2) clustering coefficient, (3) local efficiency, and (4) betweenness centrality. Whole network measures were: (1) average degree, (2) average clustering coefficient, (3) global efficiency, and (4) average betweenness centrality. These measures are summarized in Supporting Information Table 2, which also includes an explanation of the interpretation from each metric.
Global Network Properties
Since adjacency matrices were constructed based on correlation coefficients between regional volumes, we employed a bootstrapping method to evaluate the confidence limits on our data and hence calculate group‐wise statistics. The ROI data for each group (controls, epilepsy, IGE and LRE) were submitted to independent sampling with replacement (bootstrapping) across subjects. Each ROI was bootstrapped 200 times, and the resulting weighted nondirected connectivity matrix was calculated for each resampling. From the resulting 200 matrices in each group, graph theory measures were then calculated based on matrices with positive entries only.
A series of fixed density binary matrices were calculated for each resampling ranging from 0.15 to 0.5, representing respectively links with weights in the highest 15% and in the 50% percentile. For each binarized matrix, global graph metrics were calculated. Since each binarized fixed density threshold had a similar number of connections (for example, the highest 15%, etc), the average whole network degree was held constant for each threshold. For each graph theory measure, a statistical comparison was performed to evaluate differences between groups for every fixed density threshold. Since bootstrapping involved an artificial generation of large samples, we applied a very stringent correction for multiple comparisons. We employed a Bonferroni correction based on: (1) the number of entries per each matrix (171 × 171); (2) the number of fixed density of thresholds; (3) the number of bootstrapped data (200 per group × 4 groups). The corrected P value was therefore (0.05/[(171 × 171) × (8) × (800)]) = 2.6718e‐10. We employed a particularly conservative threshold for statistical significance to avoid false positives, which can be generated due to the large number of simultaneous statistical comparisons. We also opted to employ a conservative statistical threshold since bootstrapped data may provide the theoretical dispersion of the correlation coefficients between structural regions, but given that this is an artificial step to evaluate the distribution of data, it may be overly sensitive to the small sample differences.
It should be noted that bootstrapped samples originated from groups with a smaller sample size might lead to a broader dispersion in the correlation coefficients per link and therefore yield “noisier” networks, thereby further reducing the statistical power to assess differences between groups.
Regional Network Properties
Regional network properties were calculated per group for each graph theory measure. For each measure, the vector composed of graph measures per ROI was compared between patients and controls. The percent of difference between groups for each node (and for each measure) was calculated as follows: (measure in patient group/measure in controls) × 100. The distribution of the percent of differences was calculated for each graph theory metric. Nodes with its percent of difference within the highest quartile, representing increase in patients, and within the lowest quartile, representing decrement in patients, were then plotted anatomically, employing the software BrainNet Viewer (http://www.nitrc.org/projects/bnv/). This display enabled the visualization of the anatomical distribution of nodes with the highest participation on the network as defined by each graph measure. Since this step involved the evaluation of individual node values per group, the use of other group‐wise statistical tests was not possible.
Network Vulnerability
The resilience of each network was assessed with several complementary methods. First, we visually evaluated the cumulative distribution of node degrees for each node across groups [Barabasi and Albert, 1999]. Second, we evaluated the resilience of the networks to two different forms of attacks [Kaiser et al., 2007]. The first model, random attacks, tests the hypothesis that network failure is due to random loss of nodes. The second model, targeted attacks, assumes that removing nodes that are highly connected (i.e. hubs) will be more detrimental than eliminating nodes that are less connected.
The number of nodes attacked per iteration was chosen based on an approximate distribution of 30% increments in the number of nodes attack, with the first step comprising an attack of four nodes. The number of attacked nodes per iteration was: 4, 55, 106, and 157. This rate of increment in the number of attacks was arbitrary, aiming to provide a representative range of attacked networks. Random attacks were performed by excluding random nodes from each bootstrapped matrix, while targeted attacks were performed by excluding the nodes with the highest nodal measures (calculated based on the intact network). Each attack was applied to every bootstrapped matrix and global network measures were calculated from the attacked network. Each graph measures were normalized to the measure obtained from the intact network, and ensuing measures obtained from attacked networks were calculated as a fraction of the measure from the intact network. Group differences were tested employing t‐tests, comparing the change in the metric yielded by each level of random and targeted attack between patients with epilepsy and controls. The level of significance was set as a Bonferroni corrected P value = 0.05/number of random or targeted attacks.
Relationship Between Network Organization and Cognitive Measures
All patients with epilepsy underwent comprehensive neuropsychological testing following the same protocol. From the neuropsychological battery, we examined the link between graph theory metrics, full scale IQ [Wechsler, 2003] and the Delis‐Kaplan Executive Function System (D‐KEFS) Card Sorting Test [Delis et al., 2001]. Scores were scaled to remove age‐ and gender‐related confounds. We focused on intelligence and executive function because these are commonly adversely affected cognitive measures in childhood epilepsies of diverse types, which have also been related to graph theory metrics in previous studies [Langer et al., 2012; Wen et al., 2011]. Further, these abilities are adversely affected by diverse childhood and adult epilepsies and we recently demonstrated that children with IGE and LRE have a similar degree of impairment relative to controls [Jackson et al., 2013].
The patients were divided into two different groups based on the median split for each score, representing lower and higher performing groups. For each resulting group (e.g. patients with low full scale IQ), a series of bootstrapped matrices were generated based on the adjacency matrix obtained from the cross correlation of volumes of the ROIs for that group. This step was similar to the methods describe above, except that bootstrapped data were performed from subgroups of patients based on the cognitive scores. From each bootstrapped matrices, the ratio between global clustering coefficient and characteristic path length was calculated, and an independent sample t‐test was used to investigate differences between patients with lower versus higher cognitive score.
RESULTS
Adjacency Matrices
The adjacency matrices from each group are demonstrated in Figure 1, where subtle differences between groups can be visually appreciated. While in controls there was an overall homogenous pattern of correlation across regions, this pattern was replaced by clusters of increased and decreased correlation in patients with LRE and IGE.
Figure 1.
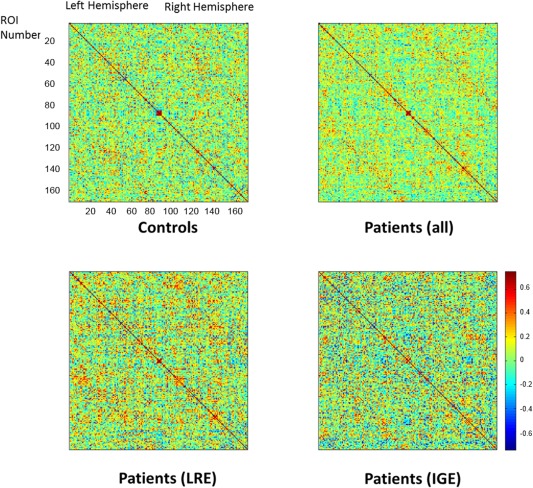
Adjacency matrices for controls and patients with epilepsy. In these composites, each matrix entry represents the pairwise Pearson correlation between the regional volume from region “i” (row) and region “j” (column). The entry A ij therefore represents the weighted “link” between network ‘nodes’ “i” and “j.” The order of regions is the same as demonstrated in Supporting Information Table 1.
Global Network Graph Theory Measures
The impact of these structural differences on the global network behavior cannot be inferred solely from visual interpretation of adjacency matrices. To better appreciate the impact of network organization, global graph theory metrics were calculated from binarized matrices constructed from resampled bootstrapped data from each group across fixed density across thresholds. The global graph measure was then statistically compared for each density across groups. These results are displayed in Figure 2. Patients with IGE and LRE exhibited a consistent decrement in global network efficiency across most binarized thresholds. Patients also exhibited a consistent increment in global clustering coefficient and betweenness centrality compared with controls. There were no differences in global graph theory metrics between IGE and LRE. Therefore, in the subsequent analyses, we combined the two epilepsy syndromes into a single group and compared it to controls.
Figure 2.

Global network analyses. The plots represent global network measures for each group across a series of binarized matrices utilizing a fixed threshold to maintain a constant density of nonzero entries. “Stars” denote density levels where patients with IGE (green stars) or LRE (red stars) exhibited measures that were statistically different than controls. Results were Bonferroni corrected for multiple comparisons.
Regional Network Graph Theory Measures
To illustrate the spatial distribution of regional network changes in patients, nodes that exhibited the highest percent of change between patients and controls were anatomically plotted in Figure 3. Patients with epilepsy exhibited significant reorganization regarding the distribution of nodes with high network measures.
Figure 3.

Nodes with highest difference in graph metrics in patients compared with controls were plotted anatomically. The percent of difference was calculated as: (measure in patient group/measure in controls) × 100, for each graph theory metric. Nodes in “blue” exhibited a higher measure in controls; nodes in “orange” exhibited a higher metric in patients.
Specifically, nodes with a high strength were redistributed from occipitoparietal regions to medial to diffuse lateral and dorsolateral frontal and temporal nodes. Nodes with high clustering coefficients were reduced in patients, where the aggregate of nodes with high clustering coefficients around the medial occipitotemporal regions observed in controls was lost. Conversely, there was a marked redistribution of betweenness centrality, with a significant increase in diffuse and widespread nodes. This increase was observed at the expense of local efficiency, which was extensively reduced in patients with epilepsy. Overall, children with new‐onset epilepsy demonstrated a posterior‐to‐anterior and medial to lateral shift in nodes with higher network influence.
Network Vulnerability
We observed that node degrees exhibited different levels of dispersion in patients compared with controls. The kurtosis of the degree distribution in controls was k = 2.53, while it was higher in patients with LRE (k= k = 3.41), and in patients with IGE (k = 3.3). These findings indicate that children with epilepsy exhibited a lower probability of nodes with a greater number of connections, and a higher probability of nodes with fewer connections.
Network vulnerability results are summarized in Figure 4. We observed that random attacks did not yield large differences in global network metrics between patients and controls. However, targeted attacks lead to more premature disruption of global network metrics in patients. Conversely, control participants exhibited a higher resilience after progressive targeted attacks, suggesting that more nodes are responsible for maintaining the global network properties. Indeed, nodes with a greater number of connections are impoverished in epilepsy compared with controls, as observed in the above of analysis of nodal degree distribution.
Figure 4.

Network vulnerability analyses. The vulnerability of global networks was calculated by applying a series of progressively larger random and targeted attacks to the weighted connectivity network, and calculating the ensuing global network property. All measures were normalized to the measure obtained from the intact network and the global graph measures from ensuing attacks were calculated as a fraction of the measure from the intact network. “Stars” illustrate measures that were statistically significant compared with controls for each level of percent of the network being attacked.
Relationship With Cognitive Measures
As described previously, the children with epilepsy were dichotomized into higher and lower cognitive performing groups (IQ standard score: high =114.8 ±7.8, low = 93.7±7.6; D‐KEFS Card Sort scaled score: high = 11.6 ± 1.3; low = 7.0 ± 2.0). We observed a significant difference in global network measures between patients with higher versus lower cognitive performance. The ratio between network segregation (defined by clustering coefficient) and network integration (defined by characteristic path length) was significantly reduced in patients with lower full‐scale IQ (T = 12.67, P < 0.0001) and in patients with greater executive dysfunction (D‐KEF Sort) (T = 19.67, P < 0.0001). These results suggest a combined reduction in segregation (decreased clustering coefficient) and integration (longer path length) in patients with lower IQ and greater executive dysfunction.
DISCUSSION
Four primary findings were derived from this examination of large‐scale brain network analysis in children with new‐ and recent‐onset uncomplicated epilepsies. First, children with epilepsy, compared with controls, had a more segregated (increased clustering coefficient) and less integrated (decreased efficiency) global network, indicating a suboptimal topological organization. Second, nodes with high strength, clustering coefficients and efficiency were redistributed from posterior‐to‐anterior brain regions in children with epilepsy. Interestingly, nodal centrality was increased diffusely without spatial predilection. Third, children with epilepsy were more vulnerable to targeted attacks but resilient to random attacks compared with controls. Fourth, the altered structural network evident in children with epilepsy has important clinical significance, as lower cognitive performances were associated with less optimal global topology.
Altered Global Topology in New‐Onset Pediatric Epilepsy
Patients with IGE and LRE exhibited an increase in global clustering coefficient and decreased global efficiency compared with controls. This type of network is more segregated and less integrated, in which neighboring network nodes (brain regions) are highly connected but distant regions have sparser connections. These alterations conform the network to a more regular, lattice‐like topology, minimizing the overall cost of the network at the expense of global integration [Bullmore and Sporns, 2012].
Studies in adult patients with chronic epilepsy using graph theory analysis have observed both a more regular [Bernhardt et al., 2011; Bonilha et al., 2012; Kramer et al., 2010] as well as a more random network topology [Liao et al., 2010; Vaessen et al., 2012; Vlooswijk et al., 2011; Zhang et al., 2011]. These discrepancies across studies are likely influenced by the modality of connectivity measurements (e.g. structural MRI, diffusion tensor imaging, functional MRI, electrophysiological recording), but are likely also influenced by epilepsy‐related factors and cognitive status. For example, longer seizure duration has been related to lower cluster coefficients [van Dellen et al., 2009] and decoupling of functional and structural networks [Zhang et al., 2011]. Patients with epilepsy with comorbid cognitive limitations in intelligence and executive function showed a lower clustering coefficient compared with healthy controls and non‐impaired epilepsy patients [Vaessen et al., 2012; Vlooswijk et al., 2011]. Notably, whereas almost all the studies were performed in adults with epilepsy, a recent study in children (similar to our study's age range) with frontal lobe epilepsy showed increased clustering coefficients in the cognitively impaired patients [Vaessen et al., 2013]. Thus, these differences may also be partially explained by developmental changes and cognitive baseline, as discussed more fully in the next section. Our study represents the first investigation of large‐scale brain network analysis in children with new‐onset and uncomplicated epilepsy (i.e., normal neurological examination, normal/average intelligence and attending mainstream schools) and as such the current results are less likely to be confounded by recurrent seizures and profound cognitive compromise. How network properties and cognitive status are progressively modified by middle and long term epilepsy chronicity is currently the focus of an ongoing longitudinal investigation at our center.
Neurodevelopmental Implications
During development, the brain network undergoes age‐dependent reorganization; the mean clustering coefficient, a measure of network segregation is decreased and concurrently, network efficiency is enhanced [Hagmann et al., 2010]. This type of network remodeling emphasizes a local‐to‐distributed pattern of information transfer in which connections close in space are decreased and connections between distant regions are strengthened [Fair et al., 2009; Khundrakpam et al., 2013]. Recent work suggests that the structural covariance, i.e., the relationship between regional brain volumes, reflect synchronized brain developmental changes [Alexander‐Bloch et al., 2013a, 2013b].
Compared with this framework, children with new‐onset epilepsy exhibited a network topology that is contrary to the normal developmental pattern, that is, a network that emphasized greater local connectivity and impoverished integration with distant brain regions. Further, nodal centrality, which measures the relative importance of nodes in a network, is stable across ages in healthy subjects, suggesting that the core structural brain network is fixed during normal brain development [Hagmann et al., 2010; Hwang et al., 2013]. In contrast, children with new‐onset epilepsy showed reorganization with enhanced nodal centrality. Such remodeling may have shifted the brain network into a more epileptogenic configuration, as studies have shown that increased betweenness centrality is highly correlated with the seizure onset zone [Varotto et al., 2012; Wilke et al., 2011]. In summary, children with epilepsy showed an altered developmental pattern of network topology, but whether this derangement represents a temporary delay in brain maturation or a fixed deviation from the normal developmental trajectory remains to be clarified.
Regional Reorganization: A Posterior‐to‐Anterior Shift
Nodes with the highest percent change in children with new‐onset epilepsy compared with controls were redistributed along the posterior ‐ anterior axis. Specifically, nodal strength is increased in bilateral frontal and temporal regions and reduced in the bilateral parietal and occipital regions. Similarly, the cluster coefficient is increased in bilateral frontal and left temporal regions. Although network efficiency is reduced throughout most of the brain regions, a few islands of enhanced efficiency are revealed in the left ventrolateral, dorsomedial, orbital frontal, and right parasylvian regions. The spatial distribution of these network measures is strikingly similar to the pattern of increased gray matter and decreased white matter volumes found in our study using deformation‐based morphometry [Tosun et al., 2007]. Further, the distribution of frontotemporalparietal changes is within the default mode network, which has been found to be abnormal in LRE [Voets et al., 2012] and IGE [Luo et al., 2011]. These converging lines of evidence suggest that there is a fundamental shift in brain network organization of children with new‐onset epilepsy.
The underlying etiology of this brain organizational shift remains to be determined. Experimental models of epilepsy suggest that frontotemporal reorganization might be a compensatory mechanism. Rats that experienced early life seizures showed greater electrophysiological coherence between the frontal and mesial temporal regions during working memory tasks [Kleen et al., 2011]. Interestingly, we found that executive function, a cognitive domain that is predominantly mediated by frontosubcortical networks, is frequently impaired in this group of children with epilepsy [Lin et al., 2012a, 2012b; Pulsipher et al., 2009]. These findings could also help to explain the increased prevalence of attention deficit hyperactive disorder in children with new‐onset epilepsy [Hermann et al., 2007; Hesdorffer et al., 2004].
In this study, we aimed to evaluate the effects of epilepsy in the developing brain. Therefore, we combined LRE and IGE into one single group in order to focus on the shared similarities between both forms of epilepsy, and to better assess the overall effects of epilepsy onto the developing brain and neuropsychological performance. It is important to note that LRE and IGE are distinct pathophysiological entities. Even though both subgroups share the important factor of seizures occurring in the developing brain, the mechanisms leading to seizures in each group can be different. However, despite the very different pathophysiology, there appear to be many similar cognitive and behavioral complications across diverse childhood epilepsy syndromes—perhaps with more shared than syndrome specific neurobehavioral abnormalities. It should be noted that this is an important limitation of our study. Future studies should address specific network aberrations related to different sub‐forms of epilepsy. Also, other clinical features of epilepsy such as seizure frequency, age of epilepsy onset, history of febrile seizures and use of antiepileptic medications are potential confounders and should be addressed in future studies.
Vulnerability to Network Perturbation
Our modeling of network damage revealed that children with epilepsy have fewer highly connected nodes and are more vulnerable to targeted rather than random attacks. These results imply that fewer parallel or alternative pathways are available for children with epilepsy to maintain global network integrity. Further, the pathophysiology of childhood onset epilepsy may specifically impact regions that are highly connected to the rest of the brain [Morgan and Soltesz, 2008]. In chronic temporal lobe epilepsy, [Bernhardt et al. also found that patients exhibited a greater vulnerability to targeted attacks compared with random attacks [Bernhardt et al., 2011]. Together, these findings suggest that the early neurodevelopmental abnormalities in childhood onset epilepsy might lead to a reduction of network structural reserve and contribute to patterns of abnormal anatomical network observed in adults with chronic epilepsy.
Relation to Cognitive Performances
We found a reduced ratio between network segregation (clustering coefficient) and integration (characteristic path length) in a subgroup of children with epilepsy who exhibited lower IQ and poorer executive function. Indeed, lower clustering coefficient and longer path length has been linked to lower IQ scores in healthy adults [Li et al., 2009; Langer et al., 2012], children with LRE [Vaessen et al., 2012; Vlooswijk et al., 2011], and normal aging [Wen et al., 2011]. The association between these network metrics and executive function have also been found in age‐related decline [Wen et al., 2011] and individuals with traumatic brain injury [Caeyenberghs et al., 2012]. Taken together, the balance between segregation and integration, commonly referred as small world property, appears to be essential in maintaining an efficient anatomical network across health and disease. A reduced small world characteristic, noted in lower cognitive performance individuals with epilepsy, might impede the opposing demands of functionally specialized local networks and a robust transfer of information across distant brain regions. As such, these findings may represent a new avenue to understand the disordered neurobiology of cognitive comorbidities in epilepsy.
CONCLUSION AND FUTURE DIRECTIONS
Children with new‐onset epilepsy showed a reduced optimal topological structural organization with a bias toward enhanced network segregation and curtailed global integration. In the context of normal brain development, this pattern suggests either a delay in brain maturation or a fixed deviation from the normal developmental template. At the regional level, structural reorganization was evident with redistributed nodes from the posterior head regions to more anterior frontal, and temporal regions. These altered brain topologies appeared to have adverse consequences, as these network configurations may be more predisposed to targeted attacks and poorer cognitive performances. Importantly, these properties are evident very early in the course of epilepsy and are clearly not a consequence of epilepsy chronicity. How these systems may further diverge over time will provide insight into the natural history of altered typologies.
The new proposed framework to classify epilepsy suggests that underlying networks, rather than isolated brain regions, play a role in the epileptogenesis and epilepsy co‐morbidities [Berg et al., 2010]. Specifically, LRE are associated with abnormalities in localized networks, while generalized epilepsies reflect abnormal networks with bilateral hemispheric representation. Our findings directly corroborate this concept. Importantly, our observations are related to children with new‐onset epilepsy, and the impact of abnormal structural networks in their neurodevelopmental trajectory remains to be determined. A previous prospective study from our group over 2 years showed reduced gray matter pruning and white matter expansion [Tosun et al., 2007]. Whether these changes are associated with large‐scale network alternations that lead to a conformation that has a more random or regular topology is unknown. Further, how the cumulative effects of seizures and antiepileptic medications impact large scale network organization remains a clinically important issue. Given the promise of these findings, future efforts should involve similar analyses using participants with discrete epilepsy syndromes in order to determine the generality of effect and the way, if any, specific syndromes may modify the results described here.
Supporting information
Supporting Information Figure 1.
Supporting Information Table 1.
Supporting Information Table 2.
REFERENCES
- Alexander‐Bloch A, Giedd JN, Bullmore E (2013a): Imaging structural co‐variance between human brain regions. Nat Rev Neurosci 14:322–336. [DOI] [PMC free article] [PubMed] [Google Scholar]
- Alexander‐Bloch A, Raznahan A, Bullmore E, Giedd J (2013b): The convergence of maturational change and structural covariance in human cortical networks. J Neurosci 33:2889–2899. [DOI] [PMC free article] [PubMed] [Google Scholar]
- Apostolova LG, Beyer M, Green AE, Hwang KS, Morra JH, Chou YY, Avedissian C, Aarsland D, Janvin CC, Larsen JP, Cummings JL, Thompson PM (2010): Hippocampal, caudate, and ventricular changes in Parkinson's disease with and without dementia. Mov Disord 25:687–688. [DOI] [PMC free article] [PubMed] [Google Scholar]
- Barabasi AL, Albert R (1999): Emergence of scaling in random networks. Science 286:509–512. [DOI] [PubMed] [Google Scholar]
- Barbas H, Rempel‐Clower N (1997): Cortical structure predicts the pattern of corticocortical connections. Cereb Cortex 7:635–646. [DOI] [PubMed] [Google Scholar]
- Berg AT, Berkovic SF, Brodie MJ, Buchhalter J, Cross JH, van Emde Boas W, Engel J, French J, Glauser TA, Mathern GW, Moshe SL, Nordli D, Plouin P, Scheffer IE (2010): Revised terminology and concepts for organization of seizures and epilepsies: Report of the ILAE Commission on Classification and Terminology, 2005‐2009. Epilepsia 51:676–685. [DOI] [PubMed] [Google Scholar]
- Bernhardt BC, Chen Z, He Y, Evans AC, Bernasconi N (2011): Graph‐theoretical analysis reveals disrupted small‐world organization of cortical thickness correlation networks in temporal lobe epilepsy. Cereb Cortex 21:2147–2157. [DOI] [PubMed] [Google Scholar]
- Bernhardt BC, Worsley KJ, Besson P, Concha L, Lerch JP, Evans AC, Bernasconi N (2008): Mapping limbic network organization in temporal lobe epilepsy using morphometric correlations: Insights on the relation between mesiotemporal connectivity and cortical atrophy. Neuroimage 42:515–524. [DOI] [PubMed] [Google Scholar]
- Bonilha L, Nesland T, Martz GU, Joseph JE, Spampinato MV, Edwards JC, Tabesh A (2012): Medial temporal lobe epilepsy is associated with neuronal fibre loss and paradoxical increase in structural connectivity of limbic structures. J Neurol Neurosurg Psychiatry 83:903–909. [DOI] [PMC free article] [PubMed] [Google Scholar]
- Bullmore E, Sporns O (2012): The economy of brain network organization. Nat Rev Neurosci 13:336–349. [DOI] [PubMed] [Google Scholar]
- Bush EC, Allman JM (2003): The scaling of white matter to gray matter in cerebellum and neocortex. Brain Behav Evol 61:1–5. [DOI] [PubMed] [Google Scholar]
- Caeyenberghs K, Leemans A, Leunissen I, Gooijers J, Michiels K, Sunaert S, Swinnen SP (2012): Altered structural networks and executive deficits in traumatic brain injury patients. Brain structure & function. [DOI] [PubMed] [Google Scholar]
- Delis DC, Kaplan E, Kramer J (2001): Delis‐Kaplan Executive Function System manual. San Antonio, TX: The Psychological Corporation. [Google Scholar]
- Destrieux C, Fischl B, Dale A, Halgren E (2010): Automatic parcellation of human cortical gyri and sulci using standard anatomical nomenclature. Neuroimage 53:1–15. [DOI] [PMC free article] [PubMed] [Google Scholar]
- Dombrowski SM, Hilgetag CC, Barbas H (2001): Quantitative architecture distinguishes prefrontal cortical systems in the rhesus monkey. Cereb Cortex 11:975–988. [DOI] [PubMed] [Google Scholar]
- Draganski B, Gaser C, Busch V, Schuierer G, Bogdahn U, May A (2004): Neuroplasticity: Changes in grey matter induced by training. Nature 427:311–312. [DOI] [PubMed] [Google Scholar]
- Engel J Jr. (2001): A proposed diagnostic scheme for people with epileptic seizures and with epilepsy: Report of the ILAE Task Force on Classification and Terminology. Epilepsia 42:796–803. [DOI] [PubMed] [Google Scholar]
- Fair DA, Cohen AL, Power JD, Dosenbach NU, Church JA, Miezin FM, Schlaggar BL, Petersen SE (2009): Functional brain networks develop from a ”local to distributed“ organization. PLoS Comput Biol 5:e1000381. [DOI] [PMC free article] [PubMed] [Google Scholar]
- Hagmann P, Sporns O, Madan N, Cammoun L, Pienaar R, Wedeen VJ, Meuli R, Thiran JP, Grant PE (2010): White matter maturation reshapes structural connectivity in the late developing human brain. Proc Natl Acad Sci USA 107:19067–19072. [DOI] [PMC free article] [PubMed] [Google Scholar]
- Hermann B, Jones J, Dabbs K, Allen CA, Sheth R, Fine J, McMillan A, Seidenberg M (2007): The frequency, complications and aetiology of ADHD in new onset paediatric epilepsy. Brain 130:3135–3148. [DOI] [PubMed] [Google Scholar]
- Hermann B, Seidenberg M, Bell B, Rutecki P, Sheth R, Ruggles K, Wendt G, O'Leary D, Magnotta V (2002): The neurodevelopmental impact of childhood‐onset temporal lobe epilepsy on brain structure and function. Epilepsia 43:1062–1071. [DOI] [PubMed] [Google Scholar]
- Hernan AE, Holmes GL, Isaev D, Scott RC, Isaeva E. (2013): Altered short‐term plasticity in the prefrontal cortex after early life seizures. Neurobiol Dis 50:120–126. [DOI] [PMC free article] [PubMed] [Google Scholar]
- Hesdorffer DC, Ludvigsson P, Olafsson E, Gudmundsson G, Kjartansson O, Hauser WA (2004): ADHD as a risk factor for incident unprovoked seizures and epilepsy in children. Arch Gen Psychiatry 61:731–736. [DOI] [PubMed] [Google Scholar]
- Hwang K, Hallquist MN, Luna B (2013): The development of hub architecture in the human functional brain network. Cereb Cortex 23:2380–2393. [DOI] [PMC free article] [PubMed] [Google Scholar]
- Jackson DC, Dabbs K, Walker NM, Jones JE, Hsu DA, Stafstrom CE, Seidenberg M, Hermann BP (2013): The neuropsychological and academic substrate of new/recent‐onset epilepsies. J Neurosci 162:1047–1053. [DOI] [PMC free article] [PubMed] [Google Scholar]
- Kaaden S, Helmstaedter C (2009): Age at onset of epilepsy as a determinant of intellectual impairment in temporal lobe epilepsy. Epilepsy Behav 15:213–217. [DOI] [PubMed] [Google Scholar]
- Kaiser M, Martin R, Andras P, Young MP (2007): Simulation of robustness against lesions of cortical networks. Eur J Neurosci 25:3185–3192. [DOI] [PubMed] [Google Scholar]
- Kaiser M (2011): A tutorial in connectome analysis: Topological and spatial features of brain networks. Neuroimage 57:892–907. [DOI] [PubMed] [Google Scholar]
- Khundrakpam BS, Reid A, Brauer J, Carbonell F, Lewis J, Ameis S, Karama S, Lee J, Chen Z, Das S, Evans AC (2013): Developmental changes in organization of structural brain networks. Cereb Cortex 23:2072–2085. [DOI] [PMC free article] [PubMed] [Google Scholar]
- Kleen JK, Wu EX, Holmes GL, Scott RC, Lenck‐Santini PP (2011): Enhanced oscillatory activity in the hippocampal‐prefrontal network is related to short‐term memory function after early‐life seizures. J Neurosci 31:15397–15406. [DOI] [PMC free article] [PubMed] [Google Scholar]
- Kramer MA, Eden UT, Kolaczyk ED, Zepeda R, Eskandar EN, Cash SS (2010): Coalescence and fragmentation of cortical networks during focal seizures. J Neurosci 30:10076–10085. [DOI] [PMC free article] [PubMed] [Google Scholar]
- Langer N, Pedroni A, Gianotti LR, Hanggi J, Knoch D, Jancke L (2012): Functional brain network efficiency predicts intelligence. Hum Brain Mapp 33:1393–1406. [DOI] [PMC free article] [PubMed] [Google Scholar]
- Lerch JP, Worsley K, Shaw WP, Greenstein DK, Lenroot RK, Giedd J, Evans AC (2006): Mapping anatomical correlations across cerebral cortex (MACACC) using cortical thickness from MRI. Neuroimage 31:993–1003. [DOI] [PubMed] [Google Scholar]
- Li Y, Liu Y, Li J, Qin W, Li K, Yu C, Jiang T. (2009): Brain anatomical network and intelligence. PLoS computational biology 5:e1000395. [DOI] [PMC free article] [PubMed] [Google Scholar]
- Liao W, Zhang Z, Pan Z, Mantini D, Ding J, Duan X, Luo C, Lu G, Chen H (2010): Altered functional connectivity and small‐world in mesial temporal lobe epilepsy. PLoS One 5:e8525. [DOI] [PMC free article] [PubMed] [Google Scholar]
- Lin JJ, Mula M, Hermann BP (2012a): Uncovering the neurobehavioural comorbidities of epilepsy over the lifespan. Lancet 380:1180–1192. [DOI] [PMC free article] [PubMed] [Google Scholar]
- Lin JJ, Riley JD, Hsu DA, Stafstrom CE, Dabbs K, Becker T, Seidenberg M, Hermann BP (2012b): Striatal hypertrophy and its cognitive effects in new‐onset benign epilepsy with centrotemporal spikes. Epilepsia 53:677–685. [DOI] [PMC free article] [PubMed] [Google Scholar]
- Luo C, Li Q, Lai Y, Xia Y, Qin Y, Liao W, Li S, Zhou D, Yao D, Gong Q (2011): Altered functional connectivity in default mode network in absence epilepsy: A resting‐state fMRI study. Hum Brain Mapp 32:438–449. [DOI] [PMC free article] [PubMed] [Google Scholar]
- Mechelli A, Friston KJ, Frackowiak RS, Price CJ (2005): Structural covariance in the human cortex. J Neurosci 25:8303–8510. [DOI] [PMC free article] [PubMed] [Google Scholar]
- Morgan RJ, Soltesz I (2008): Nonrandom connectivity of the epileptic dentate gyrus predicts a major role for neuronal hubs in seizures. Proc Natl Acad Sci U S A 105:6179–6184. [DOI] [PMC free article] [PubMed] [Google Scholar]
- Pezawas L, Verchinski BA, Mattay VS, Callicott JH, Kolachana BS, Straub RE, Egan MF, Meyer‐Lindenberg A, Weinberger DR (2004): The brain‐derived neurotrophic factor val66met polymorphism and variation in human cortical morphology. J Neurosci 24:10099–10102. [DOI] [PMC free article] [PubMed] [Google Scholar]
- Pulsipher DT, Dabbs K, Tuchsherer V, Sheth RD, Koehn MA, Hermann BP, Seidenberg M (2011): Thalamofrontal neurodevelopment in new‐onset pediatric idiopathic generalized epilepsy. Neurology 76:28–33. [DOI] [PMC free article] [PubMed] [Google Scholar]
- Pulsipher DT, Seidenberg M, Guidotti L, Tuchscherer VN, Morton J, Sheth RD, Hermann B (2009): Thalamofrontal circuitry and executive dysfunction in recent‐onset juvenile myoclonic epilepsy. Epilepsia 50:1210–1219. [DOI] [PMC free article] [PubMed] [Google Scholar]
- Vaessen MJ, Braakman HM, Heerink JS, Jansen JF, Debeij‐van Hall MH, Hofman PA, Aldenkamp AP, Backes WH (2013): Abnormal modular organization of functional networks in cognitively impaired children with frontal lobe epilepsy. Cereb Cortex 23:1997–2006. [DOI] [PubMed] [Google Scholar]
- Vaessen MJ, Jansen JF, Vlooswijk MC, Hofman PA, Majoie HJ, Aldenkamp AP, Backes WH (2012): White matter network abnormalities are associated with cognitive decline in chronic epilepsy. Cereb Cortex 22:2139–2147. [DOI] [PubMed] [Google Scholar]
- van Dellen E, Douw L, Baayen JC, Heimans JJ, Ponten SC, Vandertop WP, Velis DN, Stam CJ, Reijneveld JC (2009): Long‐term effects of temporal lobe epilepsy on local neural networks: a graph theoretical analysis of corticography recordings. PLoS One 4:e8081. [DOI] [PMC free article] [PubMed] [Google Scholar]
- Varotto G, Tassi L, Franceschetti S, Spreafico R, Panzica F (2012): Epileptogenic networks of type II focal cortical dysplasia: A stereo‐EEG study. Neuroimage 61:591–598. [DOI] [PubMed] [Google Scholar]
- Vlooswijk MC, Vaessen MJ, Jansen JF, de Krom MC, Majoie HJ, Hofman PA, Aldenkamp AP, Backes WH (2011): Loss of network efficiency associated with cognitive decline in chronic epilepsy. Neurology 77:938–944. [DOI] [PubMed] [Google Scholar]
- Voets NL, Beckmann CF, Cole DM, Hong S, Bernasconi A, Bernasconi N (2012): Structural substrates for resting network disruption in temporal lobe epilepsy. Brain 135:2350–2357. [DOI] [PubMed] [Google Scholar]
- Wechsler D (2003): Wechsler Intelligence Scale for Children. San Antonio, TX: The Psychological Corporation. [Google Scholar]
- Wen W, Zhu W, He Y, Kochan NA, Reppermund S, Slavin MJ, Brodaty H, Crawford J, Xia A, Sachdev P (2011): Discrete neuroanatomical networks are associated with specific cognitive abilities in old age. J Neurosci 31:1204–1212. [DOI] [PMC free article] [PubMed] [Google Scholar]
- Widjaja E, Zarei Mahmoodabadi S, Go C, Raybaud C, Chuang S, Snead OC, Smith ML (2012): Reduced cortical thickness in children with new‐onset seizures. AJNR Am J Neuroradiol 33:673–677. [DOI] [PMC free article] [PubMed] [Google Scholar]
- Wilke C, Worrell G, He B (2011): Graph analysis of epileptogenic networks in human partial epilepsy. Epilepsia 52:84–93. [DOI] [PMC free article] [PubMed] [Google Scholar]
- Yang T, Guo Z, Luo C, Li Q, Yan B, Liu L, Gong Q, Yao D, Zhou D (2012): White matter impairment in the basal ganglia‐thalamocortical circuit of drug‐naive childhood absence epilepsy. Epilepsy Res 99:267–273. [DOI] [PubMed] [Google Scholar]
- Zhang K, Sejnowski TJ (2000): A universal scaling law between gray matter and white matter of cerebral cortex. Proc Natl Acad Sci USA 97:5621–5626. [DOI] [PMC free article] [PubMed] [Google Scholar]
- Zhang Z, Liao W, Chen H, Mantini D, Ding JR, Xu Q, Wang Z, Yuan C, Chen G, Jiao Q, Lu G (2011): Altered functional‐structural coupling of large‐scale brain networks in idiopathic generalized epilepsy. Brain 134:2912–2928. [DOI] [PubMed] [Google Scholar]
Associated Data
This section collects any data citations, data availability statements, or supplementary materials included in this article.
Supplementary Materials
Supporting Information Figure 1.
Supporting Information Table 1.
Supporting Information Table 2.