Abstract
Purpose
In this work, we investigate the spatial and temporal fidelity of highly constrained backPRojection (HYPR) processing using a computer-controlled motion phantom. The goal of this experimental set-up was to provide not only well-defined temporal dynamics and spatial characteristics of the motion phantom, but also circumstances that imitate in vivo scenarios.
Methods
The phantom was designed to represent an artery flanked on both sides by vein. Both arterial and venous components have different temporal dynamics but are confluent, which corresponds to a difficult scenario for HYPR. Spatial and temporal fidelity was investigated by measuring signal intensity profiles through the phantom both orthogonal to as well as along the direction of motion.
Results
Spatial fidelity profiles measured from the HYPR processed images yielded full-width-at-half-maximum values very similar to those measured in non-HYPR-processed images. Furthermore, there was no significant spreading of the motion phantom leading edge in HYPR processed images.
Conclusion
Although HYPR processing has certain characteristic artifacts that are discussed, the technique can be used to improve image quality of highly undersampled time frame images with minimal loss of spatial or temporal fidelity.
Keywords: contrast-enhanced MRA, time-resolved, HYPR, phantom study
Time-resolved contrast-enhanced MR Angiography (CE-MRA) remains a highly utilized clinical technique for evaluation of vascular diseases (1,2). Despite significant advantages, including providing three-dimensional (3D) information, MR-based methods have been unable to provide sufficiently comparable in-plane spatial resolution and temporal resolution to X-ray digital subtraction angiography. Considerable research has been performed with the goal of improving CE-MRA through accelerated data acquisition and reconstruction methods (3–9).
Phantom experiments and in vivo comparisons of advanced time-resolved CE-MRA methods are necessary and instructive to validate a technique. However, in certain phantom experiments and in vivo, the exact temporal dynamics of the object being imaged are unknown. Therefore, comparisons and precise judgments of the temporal and spatial fidelity of reconstruction techniques based solely on such experiments can be inconclusive since the truth is not known. Previously, an experimental set-up similar to the one used in this work was used to facilitate a thorough investigation of the temporal behavior of Cartesian view-shared time-resolved MRA techniques (10). In the work reported here, a computer-controlled motion phantom was used to translate an object through the image field-of-view (FOV) in a way that mimics contrast traveling through the vasculature of the lower extremities to validate the accuracy of a constrained reconstruction technique used in time-resolved CE-MRA of the peripheral vessels.
Highly constrained backPRojection (HYPR) (6) is a constrained image reconstruction technique that aims to produce time-resolved images with high spatial and temporal resolution while providing high signal-to-noise ratios (SNR). The method utilizes anatomical or structural constraints from a well-sampled, time-averaged composite image in combination with temporal information from highly undersampled weighting images to reconstruct a time series. Both the composite and temporal weighting images are required to have high SNR. As the composite image is formed using a large amount of data collected over a long temporal duration, high SNR occurs naturally. This is not the case for the temporal weighting image, which is highly undersampled; additional steps are taken to ensure sufficient SNR. These steps vary depending on the specific HYPR algorithm being utilized, but typically spatial filtering is performed to increase the SNR of the weighting image.
Effective use of HYPR relies upon adequate signal sparsity and spatio-temporal correlation in the underlying data set. Therefore, time-resolved CE-MRA is likely to be well-suited for the technique. Several authors have shown that when applied to CE-MRA, reconstructions based on the HYPR concept exhibit a decrease in undersampling artifacts and an increase in SNR compared to corresponding, non-HYPR-processed under-sampled images (11–17).
In HYPR images, spatial and temporal domains have a complicated relationship due to the multiplication of the low spatial resolution, high temporal resolution weighting image with the high spatial resolution, low temporal resolution composite image. Therefore, measurements of pure spatial or temporal resolution are difficult and potentially misleading. However, certain measurements and observations can be made of characteristics that are indicative of images with high spatial and temporal resolution. The terms “spatial fidelity” and “temporal fidelity” refer to such measurements and observations and will be discussed below.
The spatial and temporal fidelity of images produced with HYPR-based algorithms has been evaluated using both numerical simulations (12–16) and phantom experiments (11,18) as well as in vivo experiments (12,16–18). In this manuscript, we seek to investigate the spatial and temporal fidelity of HYPR processed images using a computer-controlled phantom experiment designed to model the spatio-temporal characteristics of peripheral MRA. The phantom and the acquisition and reconstruction methods were designed based on our in vivo research studies (19–22). The goal of this experimental set-up was to provide not only well-defined temporal dynamics and spatial characteristics of the motion phantom, but also circumstances that imitate in vivo scenarios.
METHODS
Experimental Set-Up
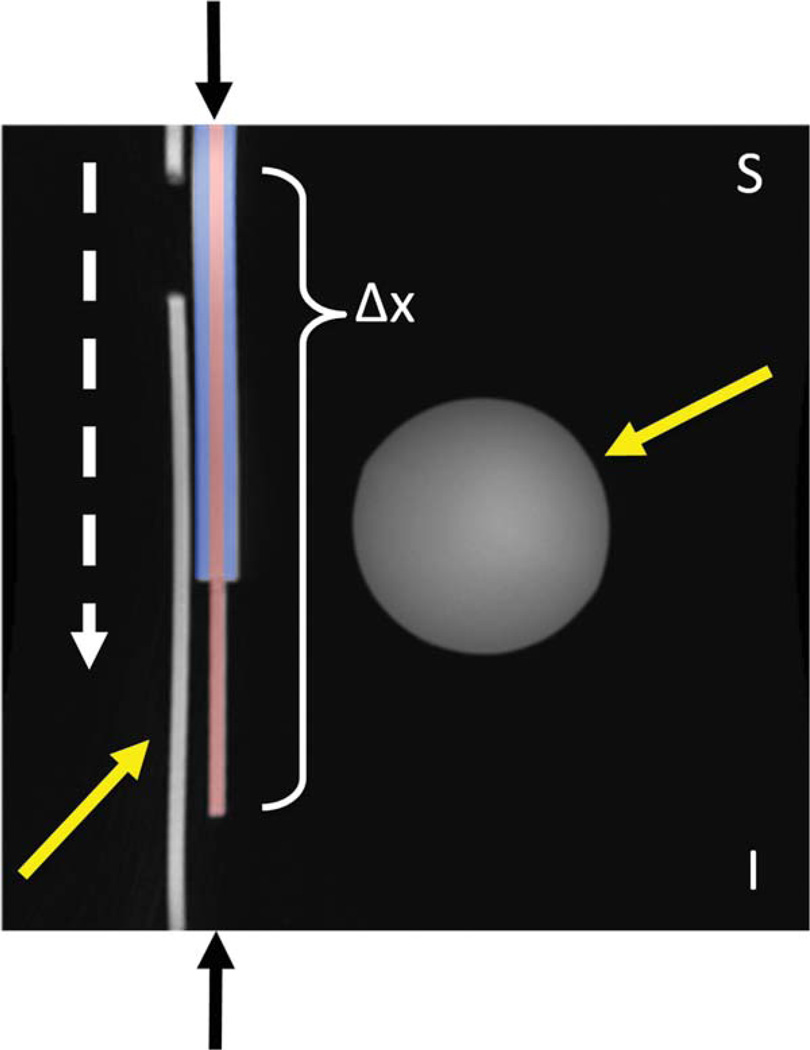
A custom built computer-controlled motion stage (Hardware: Velmex linear stage, Parker Hannifin controller, drive and motor. Software: Motion Planner, Parker Hannifin) was used to translate an object through the imaging FOV during data acquisition to mimic a bolus of contrast material traveling through vasculature. As shown in Figure 1, this dynamic object was composed of a single tube with two distinct, concentric sections, each with circular crosssections: an artery component (6.35 mm inner diameter), which was chosen to represent the initial passage of a contrast bolus through an artery of interest, and a wider section (15.8 mm inner diameter) that was chosen to represent a combination of the artery in addition to veins running parallel to and on opposite sides of the artery. The dynamic object was filled with a copper sulfate solution commonly used in phantoms constructed at our institution.
FIG. 1.
Coronal MIP of imaging FOV (32.0 × 32.0 cm2). This image was acquired while the dynamic object (between black arrows) was held stationary at the point of maximum displacement. Solid yellow arrows indicate stationary objects. The dashed white arrow indicates the direction of motion of the dynamic object. The dynamic object is shaded red and blue to point out the artery and vein components, respectively. The different colors should not be interpreted as representing a physical barrier defining the artery and vein; the entire dynamic object is confluent. In this figure, the up/down direction corresponds to the superior/inferior axis and the total displacement of the object is represented by Δx.
In this design, artery and vein components are confluent—there is no interface or diaphragm separating the two sections. Although this represents an unlikely in vivo scenario, it provides a useful test to illustrate the characteristics of the reconstruction technique in instances of relatively low sparsity and spatio-temporal correlation—the most challenging scenario for HYPR reconstruction. Figure 1 shows a coronal maximum intensity projection (MIP) of the imaging FOV (32.0 cm) while the dynamic object is stationary at its point of maximum displacement—i.e. with no motion present. The spherical and cylindrical phantoms (yellow arrows) are stationary aspects of the phantom set-up (the signal void in the cylindrical phantom is an air bubble that did not affect the experiment). The dynamic object (black arrows) is shaded red and blue to indicate the artery and vein components, respectively.
The motion stage was programmed to have a maximum superior/inferior displacement of 24.0 cm. The total distance traveled is represented in Figure 1 as Δx. Data acquisitions were performed during phantom translation with velocities of 5.0 and 10.0 mm/s. These velocities were chosen to allow for an accurate characterization of the temporal fidelity of HYPR processing and, though significantly lower than peak arterial blood velocities seen in vivo, are comparable to phantom velocities used in similar experimental set-ups (10). The motion stage was programmed to traverse 1.0 cm after prescanning and prior to triggering the scanner to begin data acquisition to ensure that the motion stage had completely ramped up to its programmed velocity. Also, for each acquisition, the total time allowed for playing of discarded acquisitions was held constant, ensuring that the motion stage was in the same position for the start of data acquisition for all experiments for a given programmed velocity.
Data Acquisition
Data were acquired on a 3.0 T scanner (Discovery MR750, GE Healthcare, Waukesha, WI) using a 32-channel phased array torso coil (GE Healthcare, Waukesha, WI). The 3D radial vastly undersampled projection reconstruction (VIPR) (23) method was used for data acquisition. The acquisition parameters were chosen to mimic the parameters used in our in vivo research studies of HYPR-processing for peripheral MRA and included: image FOV: 32.0 × 32.0 × 32.0 cm3; imaging matrix: 320 × 320 × 320; 1.0 mm isotropic spatial resolution; fractional echo 80% with 256 acquired points per radial projection; echo time/pulse repetition time: 1.1/ 4.06 ms; flip angle: 20° ; receiver bandwidth: 6125 kHz; radial projections per frame: 640; undersampling factor per frame (compared to fully sampled VIPR trajectory): 250; time per frame: 2.59 s. The acquisition was run continuously for a total scan time of 50 s, during which no projection was resampled. Within each time frame, the 640 projections sparsely spanned all of 3D k-space.
Data Reconstruction
Data from the VIPR acquisition were reconstructed into two distinct image series, which were analyzed independently. Images from these series are referred to as: Time-Frame and HYPR. The Time-Frame images for a given exam were reconstructed from undersampled time frame data (kt) using a gridding algorithm (24) (including weighting terms to compensate for sampling density) and a 3D Fourier transform. No extraneous processing (i.e., view-sharing or HYPR) was applied to the data during reconstruction. In other words, there is no source of temporal inaccuracy in the reconstruction of any image in the Time-Frame series beyond the motion of the object itself during the acquisition of that time frame.
HYPR time frames were processed using the HYPR LR algorithm (25). The generalized HYPR LR image reconstruction formula can be expressed as:
| [1] |
where Ic is a well-sampled composite image with high SNR, high spatial resolution, and limited or no temporal information; IW(t) is the unique weighting image for time frame t (note that both the HYPR weighting image and Time-Frame image for a given time frame originate from the same k-space data set, (kt)]; Ф represents a weighting image reconstruction technique for k-space data (kt) and resampled composite image data that reduces aliasing artifacts and improves SNR relative to the corresponding Time-Frame image. For the VIPR acquisition described above, Ф represents a low-spatial-resolution reconstruction of the given k-space data. SNR improvement and subsequent spatial resolution loss is achieved by not applying sampling density compensation terms to spatial frequencies outside the Nyquist radius, computed based on the level of undersampling in the time frame.
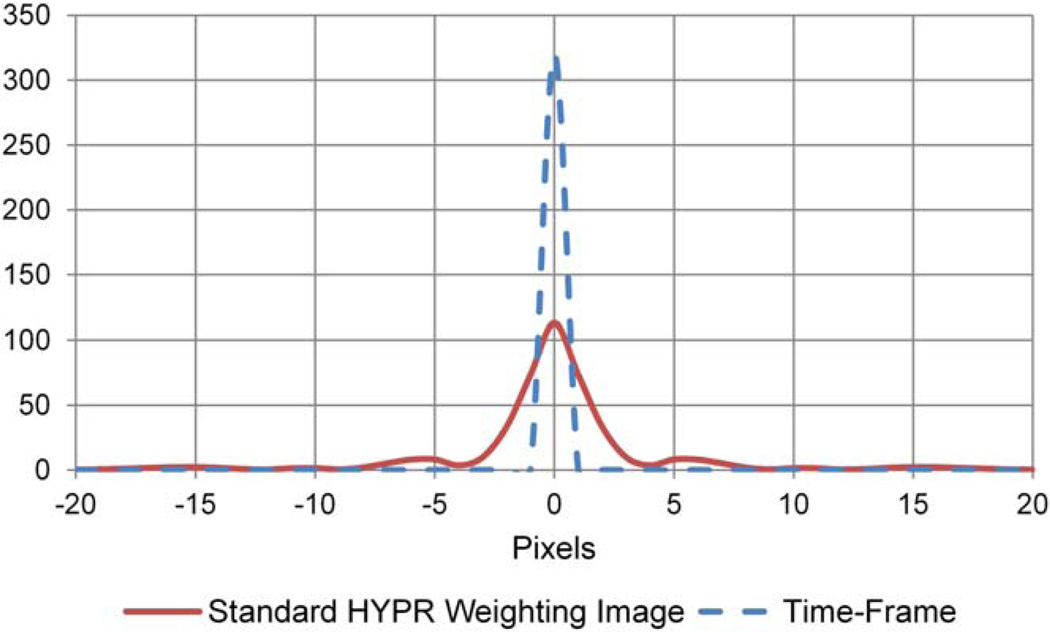
Figure 2 shows the magnitude of a 1D profile through the isotropic, 3D pointspread-functions corresponding to the reconstruction techniques used for Time-Frame images (gridding with full density compensation and 3D Fourier transform) and HYPR weighting images (gridding with some density compensation and 3D Fourier transform). Full-width-at-half-maximum and full-width-at-tenth-maximum (FWHM/FWTM) values for the Time-Frame image and HYPR weighting image pointspread-functions are: 1.0/1.8 pixels and 2.84/5.87 pixels, respectively (estimated using linear interpolation to find locations of half and tenth maximum). The HYPR weighting image reconstruction technique Ф analyzed in Figure 2 is the technique used throughout this work. The well-sampled composite image is formed using 12,316 radial projections (undersampling factor of 13) acquired over the 50 s scan time (unless otherwise noted) and the same density compensation technique that is used for the Time-Frame images. These are the strategies typically used for our in vivo research studies (19–22). For an investigation of the spatial and temporal fidelity of HYPR when weighting image reconstruction parameters vary from those described above, see Supporting Information.
FIG. 2.
Pointspread-functions corresponding to the reconstruction techniques used for Time-Frame and standard HYPR weighting images. FWHM/FWTM values for standard HYPR weighting image and Time-Frame image: 2.84/5.87 pixels and 1.0/1.8 pixels, respectively (estimated using linear interpolation). [Color figure can be viewed in the online issue, which is available at wileyonlinelibrary.com.]
Data Analysis
Spatial Fidelity
The HYPR process as described above involves the multiplication of two images with different spatial resolutions. In this study, the extent to which the spatial resolution of the final HYPR image is dictated by the high spatial resolution of the composite image is investigated by measuring signal profiles in the final HYPR images through the artery component in the direction orthogonal to motion.
Profiles from HYPR images were compared with profiles from corresponding images of interest: Time-Frame and HYPR composite images. Profiles were obtained by averaging the signal intensity along six neighboring line profiles placed in a single, central coronal slice.
It is important to note that there are two distinct scenarios that require separate consideration since the profiles measured from a HYPR image may vary depending on the structures present in each HYPR component image (weighting and composite). First, a profile was taken at a point (frame 13) where the artery component was the only structure enhanced in both the weighting image and the composite image. This profile is referred to as PA,A,standing for Artery (in the weighting image), Artery (in the composite image). This is anticipated to represent the best-case scenario for the HYPR technique. Second, a profile PA,AV standing for Artery (in the weighting image), artery + vein (in the composite image) was taken (frame 4) at a point along the dynamic object where only the artery component was enhanced in the weighting image, but the artery and vein components were enhanced in the composite image. This is expected to represent a challenging scenario for HYPR—especially since the artery and vein components are confluent in this experimental set-up, as noted above.
Temporal Fidelity
The HYPR process also involves the multiplication of two images that have different temporal resolutions. The extent to which the temporal resolution of the HYPR image is dictated by the temporal resolution of the corresponding Time-Frame image is investigated by (i) plotting profiles from Time-Frame and HYPR images of the leading edge of the dynamic component of the phantom; (ii) measuring the location of the leading edge of the dynamic component of the phantom as a function of time in both Time-Frame and HYPR image series; (iii) plotting the different enhancement patterns of the artery and vein components in both Time-Frame and HYPR image series.
Because of the continuous motion of the phantom during data acquisition and the inherent time averaging of low spatial frequency data collected within a given time frame with the VIPR acquisition, a certain amount of edge blur in the direction of motion is expected. Therefore, the leading edge is defined as the time averaged position of the most distal edge of the artery component during the interval of data acquisition for a given time frame. In this work it is assumed that all additional blurring of the leading edge is due to losses in temporal fidelity imposed by the image reconstruction technique.
To investigate and assess the temporal fidelity of HYPR processing, a profile through the dynamic object in the direction of motion (S/I in Fig. 1) was measured by averaging profiles from three neighboring lines placed in a central coronal slice of the 3D image. Profiles were considered for comparison only if the leading edge was in the central 50% of the image FOV. This restriction was imposed to minimize the effects of receiver coil sensitivity and possible errors in the gradient nonlinearity correction, which are worse with increasing distance from isocenter. Along a profile, the absolute location of the phantom edge was defined as the spatial location where the signal was equal to 50% of the difference in mean signals within and outside of the artery component.
Additionally, the ability of HYPR processing to accurately maintain and represent different temporal patterns within the same time series was examined. 3D regions of interest (ROIs) of size (4×3×5 pixels) were placed in the path of the artery and vein components of the dynamic object in Time-Frame and HYPR time series. Mean signals within these ROIs were measured in consecutive time frames.
As noted above, the composite image in HYPR processing is generated using data extending beyond the specific time frame of interest. To investigate how this affects the temporal fidelity in a HYPR image, an analysis was performed by reconstructing HYPR time series a using sliding window composite of shorter temporal length.
RESULTS
Spatial Fidelity
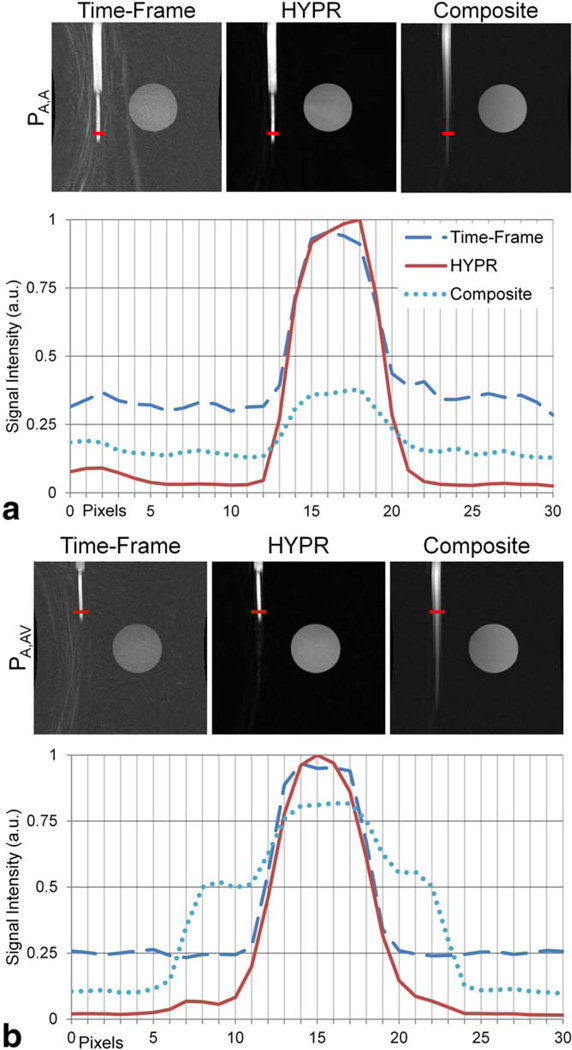
Figure 3 shows PA,A and PA,AV profiles for Time-Frame and HYPR series and for the HYPR composite image. Single slices of Time-Frame, HYPR and HYPR composite images are also shown. The red horizontal lines on the images illustrate the measurement locations of the two profiles taken along the dynamic object. Note that in both frames (Fig. 3a,b), the SNR of the HYPR image is significantly higher than the SNR of the Time-Frame image, though there is almost no evidence of spatial fidelity loss in the HYPR images or profiles.
FIG. 3.
The spatial locations of PA,A (a) and PA,AV (b) are shown in the Time-Frame, HYPR, and HYPR composite single slice images. Note that in (a), the artery component is the only structure present in both the Time-Frame and HYPR composite images, while in (b) both the artery and vein components are enhanced in the HYPR composite image. PA,A (a) and PA,AV (b) profiles are plotted. The legend in (a) is valid for (b). [Color figure can be viewed in the online issue, which is available at wileyonlinelibrary.com.]
To quantify the spatial fidelity of each analyzed image, FWHM and FWTM values of the PA,A and PA.AV profiles for each reconstruction technique were calculated and are reported as mean 6standard deviation in Table 1. FWHM and FWTM values were calculated for each of the six neighboring line profiles by linearly interpolating between locations along the profile with values closest to half and tenth the maximum profile value, respectively. FWTM values were unattainable for Time-Frame profiles, since profile values never decreased to one-tenth of the maximum signal intensity. Note that these FWHM/FWTM values cannot be directly compared to values from Figure 2, which measure the FWHM/FWTM of pointspread-functions.
Table 1.
Full width at half maximum and full width at tenth maximum values of PA,A and PA,AV profiles for Time-Frame, HYPR and Truth.
| Truth | Time-Frame | HYPR | |
|---|---|---|---|
| PA,A | |||
| FWHM | 4.18±60.02 | 6.56±60.15 | 5.99±60.07 |
| FWTM | 7.25±60.05 | – | 8.67±60.1 |
| PA,AV | |||
| FWHM | 4.18±60.02 | 6.80±60.07 | 6.25±60.01 |
| FWTM | 7.25±60.05 | – | 10.60±60.05 |
The Truth was obtained by measuring FWHM/FWTM values on a fully-sampled image acquired with no motion of the dynamic object. This characterizes the best possible representation of the width of the artery component. Values are reported in units of pixels.
Temporal Fidelity
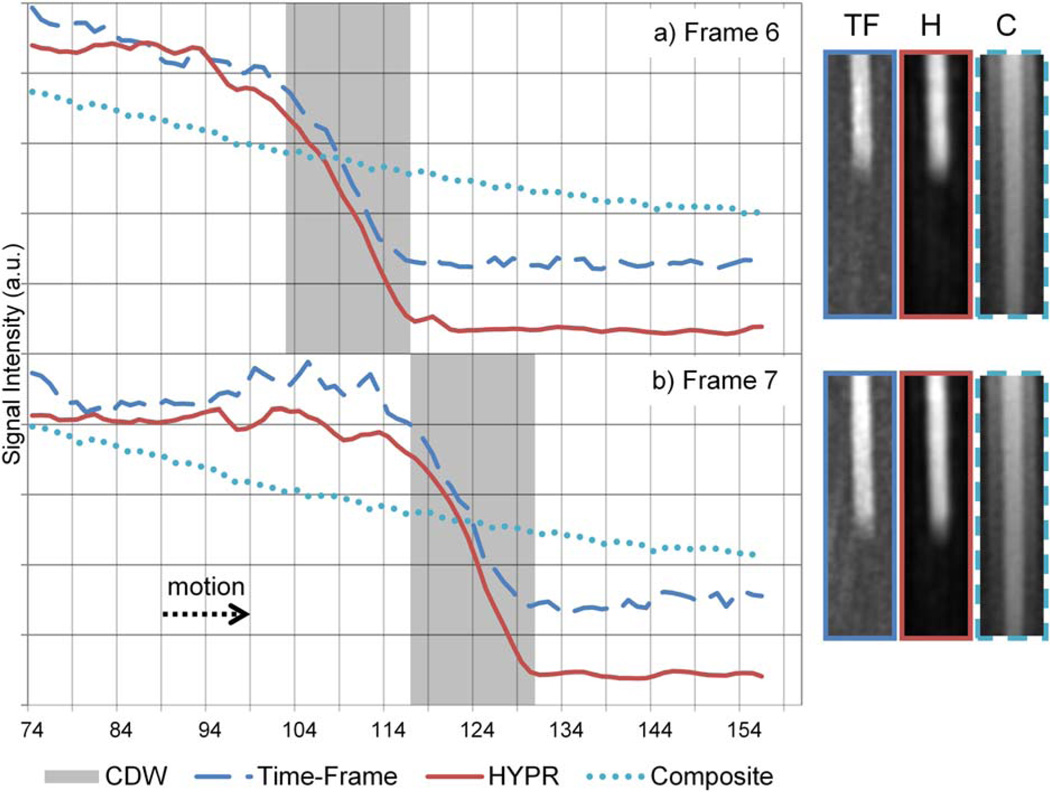
Figure 4 shows leading edge plots of Time-Frame, HYPR and HYPR composite images for two consecutive time frames. The shaded gray box represents the calculated data acquisition window, defined as the distance the phantom moved during the data acquisition of a given time frame; phantom edge blur is expected within the calculated data acquisition window due to motion during the acquisition and the continuous sampling of central k-space data throughout the window. To the right of each plot are cropped and enlarged MIP images associated with each of the two time frames.
FIG. 4.
Plots of the leading edge from two consecutive HYPR (H) and Time-Frame (TF) frames are shown with a corresponding plot from the composite (C) image. The gray box indicates the calculated data acquisition window—or the known positions of the phantom edge during data acquisition for the given time frame. [Color figure can be viewed in the online issue, which is available at wileyonlinelibrary.com.]
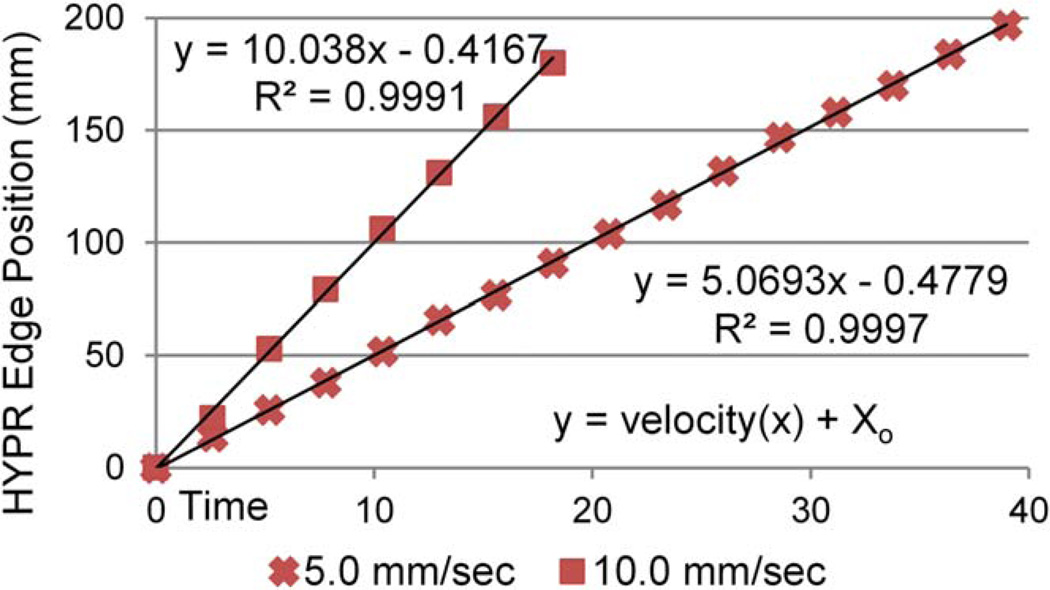
Figure 5 shows absolute locations of the phantom edge as measured from consecutive frames in the HYPR time series plotted as a function of time for programmed phantom velocities of 5.0 and 10.0 mm/s. In both studies, phantom velocity (trend-line slope) corresponds well with the velocities programmed into the motion phantom. Further, it is highly linear; R2 values (0.9991 for 10.0 mm/s and 0.9997 for 5.0 mm/s) suggest that HYPR reconstruction accurately depicted the constant velocity programmed for the motion stage.
FIG. 5.
Phantom leading edge locations measured in consecutive time frames from HYPR image series acquired with different phantom velocities. [Color figure can be viewed in the online issue, which is available at wileyonlinelibrary.com.]
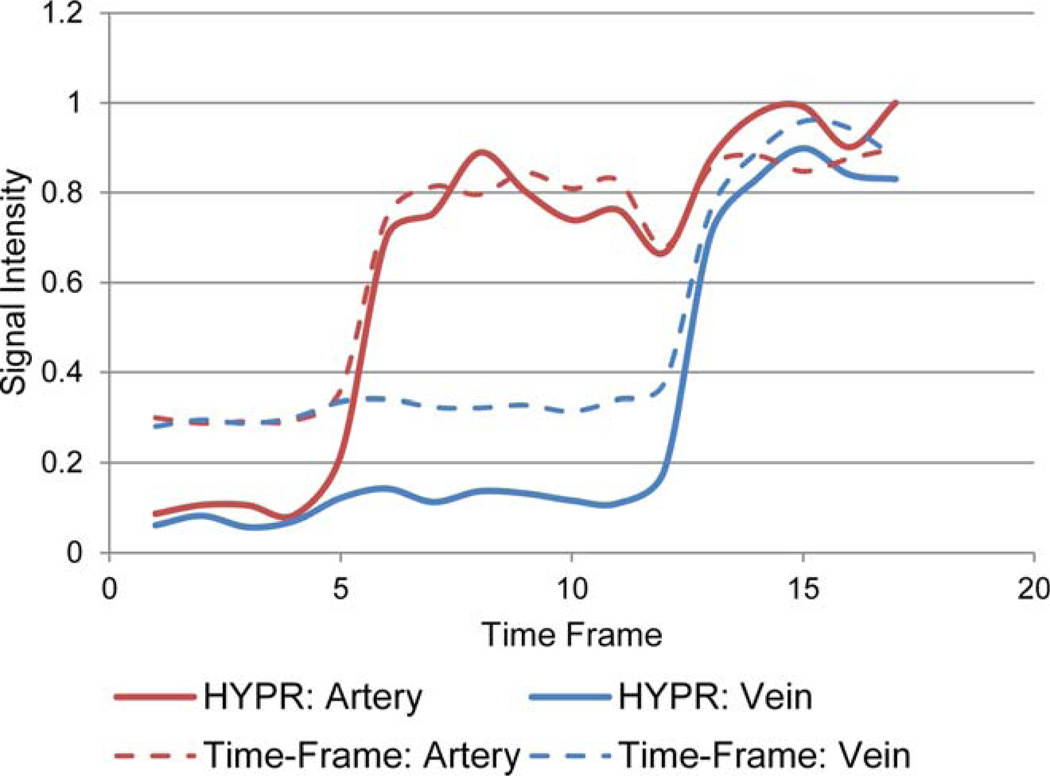
Figure 6 shows mean artery and vein component ROI signals from consecutive frames measured from Time-Frame and HYPR time series.
FIG. 6.
Mean artery and vein component ROI signals from consecutive frames of Time-Frame and HYPR time series. The signals measured in the HYPR series for arterial and venous components remain consistent with those measured in the Time-Frame series. [Color figure can be viewed in the online issue, which is available at wileyonlinelibrary.com.]
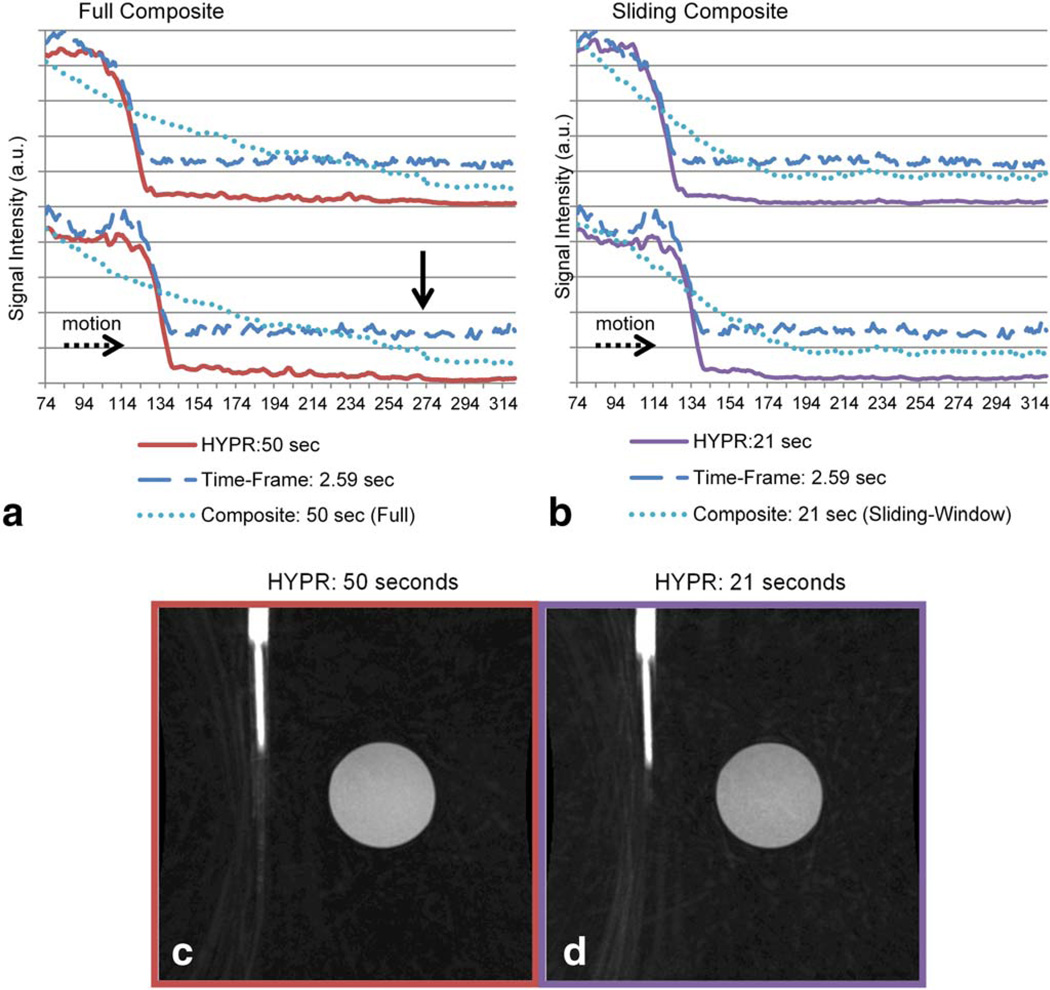
Figure 7 shows comparisons of leading edge blur in HYPR images reconstructed with composite image temporal lengths of 50 and 21 s (full and sliding composites, respectively); two consecutive time frames for each technique are shown. The times reported in each legend entry represent the longest temporal duration used in the given reconstruction process. HYPR:50 s is the HYPR image, reconstructed using a 50 s, full composite. Com-posite:50 s is the composite image used in HYPR:50 s. Note that the profile for Composite:50 s shows no temporal change (it is identical for both time frames) since it is a full composite and contains all the temporal data in the series. Composite:21 s corresponds to the sliding window composite image used in HYPR:21 s.
FIG. 7.
Leading edge profiles measured in the direction of motion from HYPR images reconstructed with composite image temporal lengths of 50 and 21 s. The times reported in the legend entry represent the longest temporal duration used in the given reconstruction process for each entry. Composite:50 sec corresponds to a full composite, while Composite:21 sec corresponds to a sliding window composite. Uncropped, single slice images from HYPR data-sets reconstructed using a full composite (c) and a sliding window composite (d) are shown. Note the increased amount of undersampling artifacts present in (d). [Color figure can be viewed in the online issue, which is available at wileyonlinelibrary.com.]
In Vivo
Figure 8 shows images acquired from a patient with peripheral artery disease. Coronal MIP images of an arterial time frame are shown for Time-Frame and HYPR reconstructions. The HYPR composite image is also shown. In Figure 8d, profiles orthogonal to the vasculature obtained from a single coronal slice exhibiting an artery flanked by veins to the right and left are shown. Only, the artery is enhanced in the frame shown, whereas both artery and vein are enhanced in the composite image (analogous to the PA,AV profile above). The composite image venous signal must be suppressed by the weighting image to produce a HYPR image with high spatial fidelity.
FIG. 8.
Coronal MIP images of Time-Frame, HYPR, and HYPR composite datasets from a patient with peripheral arterial disease (a–c) and profiles (d) orthogonal to the vasculature obtained from a single coronal slice exhibiting an artery flanked by veins to the right and left are shown (location of the profile is indicated by the arrows). Both artery and vein are enhanced in the composite image (analogous to that of PA,AV) but the venous signal is significantly suppressed in the HYPR image. This is confirmed by the plot. [Color figure can be viewed in the online issue, which is available at wileyonlinelibrary.com.]
DISCUSSION
Spatial Fidelity
Figure 3a shows that, in the ideal case of similar structures represented in both the weighting and composite images, HYPR processing—and specifically the weighting image reconstruction technique—does not result in a loss of spatial fidelity. FWHM and FWTM values for PA,A in Table 1 support this assessment. In this case and with these reconstruction parameters, the use of a low spatial resolution HYPR weighting image does not result in a HYPR image with decreased spatial fidelity. Despite the weighting image being blurred, there are no venous components (or any other structures) near the arteries in either the weighting image or the composite image, so nothing (except noise) can be inadvertently weighted to cause misrepresentation of the arterial structures in the final HYPR image. The noise in the composite images used in HYPR processing is intentionally kept low.
Of more interest are the PA,AV results shown in Figure 3b where the artery and vein components are enhanced in the composite image and the vein component requires adequate suppression by the weighting image to accurately reflect the state of the phantom in the given time frame. At high signal values (i.e., above the background signal intensity of the Time-Frame profile), the profiles of the Time-Frame and HYPR images are comparable. The FWHM values reported in Table 1 for these images support this observation. However, FWTM values for HYPR PA,AV profiles reflect an incorrectly wide profile. Examination of the plot in Figure 3b shows this loss of spatial fidelity is due to the composite image signal (from the venous component) not being fully suppressed. This is due to non-zero values in the weighting image at those locations.
Non-zero values in inappropriate locations in the HYPR image can be due to either (i) the intentional blurring of the weighting image, which has a local impact on structures in the composite image that are close to the arterial component or (ii) non-zero noise in the weighting image, which has a global impact on all structures in the composite image. In either case, the result is that a very low signal intensity imprint of the composite profile still remains in the HYPR profile. This phenomenon is not indicative of a loss of spatial resolution but rather is caused by inaccurate temporal weighting of the content in the composite image. This is a potential artifact due to HYPR processing. Note however, that the artifactual signal is of extremely low intensity.
In the case where a vein is touching an artery (as in the experimental set-up), the inappropriate weighting of the vein may make the artery appear blurred, as is manifest by the widening of the FWTM in this example. However, the FWHM is unaffected by this phenomenon. Also, if there were any gap between the artery and vein, the profile would decrease at the edge of the artery, and the inappropriate weighting of the vein would cause a side-lobe in the profile, which would not manifest as blur to the artery in the HYPR image.
Temporal Fidelity
Figure 4 shows that HYPR images exhibit very high temporal fidelity. In each plot, it is apparent that high signal intensity from the composite image is being sufficiently suppressed by the HYPR weighting image. There is no significant increase in temporal blur after HYPR processing; leading edge blur in images from both Time-Frame and HYPR reconstructions remains within the calculated data acquisition window. The benefits of HYPR processing can be appreciated by observing the images shown in Figure 4; the HYPR image exhibits a significant decrease in undersampling artifacts and background noise (due to the contribution from the composite image), while maintaining temporal information similar to that represented in the Time-Frame image (despite the contribution from the composite image).
The measured leading edge locations plotted for consecutive HYPR time frames in Figure 5 accurately depict the linear velocity programmed for the two separate experiments with velocities of 5.0 and 10 mm/s. Note that the velocities measured from the HYPR time frames are represented by the slope of the trend lines. The high degree of linearity might not be attainable in techniques that rely on view-sharing, since the center of k-space could be shared from either previous or future time frames, resulting in a nonlinear relationship between edge locations measured in consecutive time frames. This effect can be mitigated, however, if consistent sampling of k-space is maintained from one frame to the next, as shown in Mostardi et al.
Figure 6 shows that different temporal patterns within the time series are well maintained and represented after HYPR processing. The signal enhancement curves measured from ROIs in both artery and vein components remain consistent between Time-Frame and HYPR series. In other words, HYPR processing does not result in significant early arterial or venous enhancement, which in this case, would manifest as an increase in the HYPR ROI signals prior to Time-Frame ROI enhancements. After the arrival of the arterial and venous sections of the dynamic object, there are deviations in the ROI signal intensity. The cause of these deviations is not known, though they might be the result of undersampling artifacts in the HYPR weighting image. Regardless, Figure 6 suggests that the determination of presence or absence of contrast material within a vessel is clear and straightforward.
Figure 7 illustrates how full and sliding composite images affect the temporal fidelity of the resulting HYPR image. Figure 7a demonstrates the low signal imprint artifact mentioned above: signal from structures in the composite image appear as low intensity signal in the final HYPR image. The vertical black arrow in Figure 7a points to the location where the artery component terminates in the composite image (end of the phantom trajectory). In the profile from the HYPR image, a low signal intensity can be seen that extends from the leading edge of the phantom in each time frame to the end of the phantom trajectory in the composite image (the vertical black arrow), demonstrating the imprint artifact.
Figure 7b demonstrates that—if necessary—this imprint phenomenon can be mitigated with the use of a sliding composite image of shorter temporal duration. The artifact is still present, but extends over a shorter distance due to decreased amount of data used to form the composite. The vertical black arrow is not shown in Figure 7b, but the imprint can be seen to disappear at about 174 mm (horizontal axis) for the frame shown on the lower section of the plot. The imprint artifact and the mitigation thereof can be seen in the images shown in Figure 7c,d, respectively (which have been windowed and leveled in a dramatic fashion to show the artifact). However, Figure 7c,d demonstrate the penalty for implementing HYPR reconstruction with a more undersampled composite image: undersam-pling artifacts are more pronounced in the HYPR result. Iterative HYPR methods (13,26,27) have been shown to mitigate the imprint artifact while avoiding the penalty associated with using an undersampled composite image. However, it should be noted that the signal intensity of this imprint is very low and is not discernible in in vivo images.
In Vivo
As noted above, since the exact temporal kinetics of a contrast-enhanced bolus are not known, conclusions regarding the exact position of the contrast bolus are difficult to support with in vivo data. The low signal imprint artifact discussed above is visually detectable in Figure 8b. However, the plot in Figure 8d confirms the results of the motion phantom experiment for analysis of the spatial fidelity of HYPR images and possible unintentional enhancement of nearby vessels due to the spatial blur in the weighting image. Given an appropriate weighting image reconstruction technique, enhanced structures in the composite image that are not enhanced in the weighting image can be adequately suppressed in the HYPR images in in vivo studies. Note that visible discrepancies exist between Time-Frame and HYPR images in Figure 8, particularly with regards to the enhancement of small vessels. Because of the nature of in vivo experiments, one cannot make a conclusive judgment as to the cause of these discrepancies since the truth at a given time frame in unknown. This illustrates the importance of conducting well-controlled, phantom experiments.
Study Limitations
As noted above, this study was designed to mimic a contrast bolus traversing peripheral vasculature; however, there are some limitations to this approach. First, the phantom does not simulate background enhancement due to mask subtraction errors as a result of patient motion or perfusion of the contrast agent. Tissue enhancement in the composite image may be incompletely suppressed by the weighting image and may cause similar tissue enhancement in the HYPR image (as seen in Fig. 8b).
Second, although the arterial and venous signals of the phantom were confluent, the filling pattern occurred in a parallel direction. Filling of peripheral vasculature in vivo is anti-parallel. For the purposes of this study this discrepancy was assumed to have no effect on the study outcome.
Third, the sharp edges of the phantom overexpress high spatial frequencies and result in streak artifacts of higher intensity than typically found in vivo with projection reconstruction. This was an intentional design choice of the motion phantom to provide well-defined sharp edges to improve measurements of temporal and spatial fidelity.
Fourth, the motion phantom velocities used in this experiment were significantly lower than blood velocities found in vivo. This decision was made to ensure that multiple time frames of phantom motion would be acquired given our FOV and undersampling parameters. Although we believe that the findings of this study may be extended to more complex, in vivo-like dynamics, including faster and nonconstant blood velocities, further studies would be needed to confirm this belief.
CONCLUSIONS
In HYPR processing, a highly undersampled weighting image is intentionally blurred and multiplied by a high SNR, nearly fully sampled, temporally averaged composite image. In theory, the HYPR image spatial resolution is related to the composite image spatial resolution, while the HYPR image temporal resolution is related to the weighting image temporal resolution. The purpose of this work was to investigate the spatial and temporal fidelity of HYPR processing using a computer-controlled motion phantom designed to simulate the imaging environment encountered in peripheral MRA.
One potential limitation of the HYPR algorithm is that the spatial blur imposed on the weighting image may result in unintentional temporal weighting of nearby vessels. In this work, it was demonstrated that these effects were small, and could be controlled by ensuring that the weighting image reconstruction technique is strategically chosen to yield a narrow point spread function while providing a sufficient increase in weighting image SNR and decrease in undersampling artifacts. The penalties for using a suboptimal weighting image reconstruction technique are discussed in Supporting Information. It was shown that in general, the spatial fidelity of the HYPR image is not significantly reduced. Signal intensity profiles measured in the HYPR processed images yielded FWHM values similar to those measured in Time-Frame images. These results were confirmed by observing the same phenomenon in profiles obtained from in vivo images.
Measurements of the position and blur of the leading edge of the motion phantom demonstrated that HYPR processing effectively preserved the temporal fidelity inherent in the weighting image, despite being multiplied by the composite image. There was a small amount of signal from the composite image that was imprinted on the HYPR image, but the amplitude of this signal is small, and is generally not seen in in vivo images, presumably because this signal is lost in the noise. HYPR processing also preserved the different temporal behaviors of the artery and vein components within a single time series. Furthermore, the measured locations of the leading edge in consecutive time frames accurately portrayed the constant phantom velocity that was programmed for the experiment.
Finally, while this experiment was specifically designed to mimic a peripheral MRA examination, we believe these findings to be applicable to a broad range of anatomical regions with similar spatio-temporal correlation and sparsity where HYPR may be used as a post-processing technique.
Footnotes
Additional Supporting Information may be found in the online version of this article.
REFERENCES
- 1.Zhang H, Maki JH, Prince MR. 3D contrast-enhanced MR angiogra-phy. J Magn Reson Imaging. 2007;25:13–25. doi: 10.1002/jmri.20767. [DOI] [PubMed] [Google Scholar]
- 2.Carr J, Carrol T. New York: Spinger; 2012. Magnetic resonance angiography: principles and applications. [Google Scholar]
- 3.Korosec FR, Frayne R, Grist TM, Mistretta CA. Time-resolved contrast-enhanced 3D MR angiography. Magn Reson Med. 1996;36:345–351. doi: 10.1002/mrm.1910360304. [DOI] [PubMed] [Google Scholar]
- 4.Peters DC, Korosec FR, Grist TM, Block WF, Holden JE, Vigen KK, Mistretta CA. Undersampled projection reconstruction applied to MR angiography. Magn Reson Med. 2000;43:91–101. doi: 10.1002/(sici)1522-2594(200001)43:1<91::aid-mrm11>3.0.co;2-4. [DOI] [PubMed] [Google Scholar]
- 5.Tsao J, Boesiger P, Pruessmann KP. k-t BLAST and k-t SENSE: dynamic MRI with high frame rate exploiting spatiotemporal correlations. Magn Reson Med. 2003;50:1031–1042. doi: 10.1002/mrm.10611. [DOI] [PubMed] [Google Scholar]
- 6.Mistretta CA, Wieben O, Velikina J, Block W, Perry J, Wu Y, Johnson K, Wu Y. Highly constrained backprojection for time-resolved MRI. Magn Reson Med. 2006;55:30–40. doi: 10.1002/mrm.20772. [DOI] [PMC free article] [PubMed] [Google Scholar]
- 7.Lustig M, Donoho D, Pauly JM. Sparse MRI: the application of compressed sensing for rapid MR imaging. Magn Reson Med. 2007;58:1182–1195. doi: 10.1002/mrm.21391. [DOI] [PubMed] [Google Scholar]
- 8.Haider CR, Hu HH, Campeau NG, Huston J, 3rd, Riederer SJ. 3D high temporal and spatial resolution contrast-enhanced MR angiography of the whole brain. Magn Reson Med. 2008;60:749–760. doi: 10.1002/mrm.21675. [DOI] [PMC free article] [PubMed] [Google Scholar]
- 9.Lim RP, Shapiro M, Wang EY, et al. 3D time-resolved MR angiogra-phy (MRA) of the carotid arteries with time-resolved imaging with stochastic trajectories: comparison with 3D contrast-enhanced Bolus-Chase MRA and 3D time-of-flight MRA. AJNR Am J Neuroradiol. 2008;29:1847–1854. doi: 10.3174/ajnr.A1252. [DOI] [PMC free article] [PubMed] [Google Scholar]
- 10.Mostardi PM, Haider CR, Rossman PJ, Borisch EA, Riederer SJ. Controlled experimental study depicting moving objects in view-shared time-resolved 3D MRA. Magn Reson Med. 2009;62:85–95. doi: 10.1002/mrm.21993. [DOI] [PMC free article] [PubMed] [Google Scholar]
- 11.Wieben O, Velikina J, Block W, Perry J, Wu Y, Johnson K, Wu Y, Kor-osec FR, Mistretta C. Highly Constrained back projection (HYPR): theory and potential MRI applications. Proceedings of the 14th Annual Meeting of ISMRM; Seattle, Washington, USA. 2006. p. 688. [Google Scholar]
- 12.Huang Y, Wright GA. Time-resolved MR angiography with limited projections. Magn Reson Med. 2007;58:316–325. doi: 10.1002/mrm.21312. [DOI] [PubMed] [Google Scholar]
- 13.O’Halloran RL, Wen Z, Holmes JH, Fain SB. Iterative projection reconstruction of time-resolved images using highly-constrained back-projection (HYPR) Magn Reson Med. 2008;59:132–139. doi: 10.1002/mrm.21439. [DOI] [PubMed] [Google Scholar]
- 14.Wu Y, Wieben O, Mistretta CA, Korosec FR. Evaluation of temporal and spatial characteristics of 2D HYPR processing using simulations. Magn Reson Med. 2008;59:1090–1098. doi: 10.1002/mrm.21564. [DOI] [PubMed] [Google Scholar]
- 15.Keith L, Kecskemeti S, Velikina J, Mistretta C. Simulation of relative temporal resolution of time-resolved MRA sequences. Magn Reson Med. 2008;60:398–404. doi: 10.1002/mrm.21658. [DOI] [PMC free article] [PubMed] [Google Scholar]
- 16.Jeong HJ, Cashen TA, Hurley MC, Eddleman C, Getch C, Batjer HH, Carroll TJ. Radial sliding-window magnetic resonance angiography (MRA) with highly-constrained projection reconstruction (HYPR) Magn Reson Med. 2009;61:1103–1113. doi: 10.1002/mrm.21888. [DOI] [PMC free article] [PubMed] [Google Scholar]
- 17.Wu Y, Korosec FR, Mistretta CA, Wieben O. CE-MRA of the lower extremities using HYPR stack-of-stars. J Magn Reson Imaging. 2009;29:917–923. doi: 10.1002/jmri.21733. [DOI] [PMC free article] [PubMed] [Google Scholar]
- 18.Holmes JH, O’Halloran RL, Brodsky EK, Bley TA, Francois CJ, Veli-kina JV, Sorkness RL, Busse WW, Fain SB. Three-dimensional imaging of ventilation dynamics in asthmatics using multiecho projection acquisition with constrained reconstruction. Magn Reson Med. 2009;62:1543–1556. doi: 10.1002/mrm.22150. [DOI] [PMC free article] [PubMed] [Google Scholar]
- 19.Keith L, Kecsckemeti SR, Wu Y, Holmes JH, Wang K, Busse RF, Koro-sec F. Vastly undersampled isotripic projection reconsturction and HYPR for time resolved CE-MRA of the peripheral vessels. Proceedings of the 18th Annual Meeting of ISMRM; Stockholm, Sweden. 2010. p. 1418. [Google Scholar]
- 20.Keith L, Korosec F, Mistretta C. MR angiography using fractional contrast doses with VIPR and HYPR. Proceedings of the 19th Annual Meeting of ISMRM; Montreal, Canada. 2011. p. 3328. [Google Scholar]
- 21.Keith L, Schiebler M, Francois C, Reeder S, Korosec F. Comparison of Diagnostic Quality of HYPR and TRICKS for Peripheral MRA Exams in Patients. Proceedings of the 20th Annual Meeting of ISMRM; Melbourne, Australia. 2012. p. 3868. [Google Scholar]
- 22.Keith L, Francois C, Schiebler M, Reeder S, Korosec F. Time-resolved contrast-enhaced peripheral MRA in patients with low contrast doses using VIPR-HYPR. Proceedings of the 20th Annual Meeting of ISMRM; Melbourne, Australia. 2012. p. 4159. [Google Scholar]
- 23.Barger AV, Block WF, Toropov Y, Grist TM, Mistretta CA. Time-resolved contrast-enhanced imaging with isotropic resolution and broad coverage using an undersampled 3D projection trajectory. Magn Reson Med. 2002;48:297–305. doi: 10.1002/mrm.10212. [DOI] [PubMed] [Google Scholar]
- 24.Beatty PJ, Nishimura DG, Pauly JM. Rapid gridding reconstruction with a minimal oversampling ratio. IEEE Trans Med Imaging. 2005;24:799–808. doi: 10.1109/TMI.2005.848376. [DOI] [PubMed] [Google Scholar]
- 25.Johnson KM, Velikina J, Wu Y, Kecskemeti S, Wieben O, Mistretta CA. Improved waveform fidelity using local HYPR reconstruction (HYPR LR) Magn Reson Med. 2008;59:456–462. doi: 10.1002/mrm.21505. [DOI] [PMC free article] [PubMed] [Google Scholar]
- 26.Griswold M, Barkauskas K, Blaimer M, Moriguchi H, Sunshine J, Duerk J. More Optimal HYPR Reconstructione Using a Combination of HYPR and Conjugate-Gradient Minimization. In: Club M, editor. Basel, Switzerland: 2006. p. 29. [Google Scholar]
- 27.Wu H, Block W, Samsonov A. HYPR-constrained compressed sensing reconstruction for accelerated time resolved imaging. Proceedings of the 16th Annual Meeting of Toronto; Canada. 2008. p. 339. [Google Scholar]


