Abstract
Background
The strength-interval (SI) curve is an important measure of refractoriness in cardiac tissue. The anodal SI curve contains a “dip” in which the S2 threshold increases with interval. Two explanations exist for this dip: 1) electrotonic interaction between regions of depolarization and hyperpolarization, 2) the sodium-calcium exchange (NCX) current. The goal of this study is to use mathematical modeling to determine which explanation is correct.
Methods and Results
The bidomain model represents cardiac tissue and the Luo-Rudy model describes the active membrane. The SI curve is determined by applying a threshold stimulus at different time intervals after a previous action potential. During space-clamped and equal-anisotropy-ratios simulations, anodal excitation does not occur. During unequal-anisotropy-ratios simulations, following the S2 stimulus electrotonic currents, not membrane currents, are present during the few milliseconds before excitation. The dip disappears with no NCX current, but is present with 50% and 75% reduction of it. The calcium-induced-calcium-release (CICR) current has little effect on the dip.
Conclusions
These results indicate that neither NCX nor CICR current is responsible for the dip in the anodal SI curve. It is caused by the electrotonic interaction between regions of depolarization and hyperpolarization following the S2 stimulus.
Keywords: Strength-interval curve, Anodal dip, NCX current, Intracellular calcium, CICR current
1. Introduction
Electrical defibrillation of the heart is a complex process, which we cannot understand without an adequate description of the more simple process of electrical stimulation by a unipolar electrode. One behavior that must be understood completely is the strength-interval (SI) curve.
The strength-interval curve describes how refractory cardiac tissue responds to an electrical stimulus; the critical event during electrical defibrillation. The SI curve is measured by applying two stimuli--a first (S1) that initiates an action potential (AP), and then a second (S2)--and measuring the threshold S2 strength as a function of the S1-S2 interval. If a cathodal S2 stimulus is applied through a unipolar electrode, the SI curve decreases monotonically with interval because the tissue becomes easier to stimulate as it recovers from the refractoriness of the S1 AP. If an anodal stimulus is applied through the same electrode, however, the response is more complicated. A section of the curve has positive slope: threshold increases as the interval increases.1–7 This “dip” in the anodal SI curve is surprising: excitation should get easier as tissue recovers from refractoriness, not more difficult. It is also fundamental: threshold excitation with a unipolar electrode is the simplest example of electrical stimulation. We cannot be confident that we understand defibrillation until we thoroughly understand the dip in the anodal SI curve.
Two competing hypotheses exist to explain the shape of the anodal SI curve.8 The first is electrotonic interaction of adjacent regions of depolarization and hyperpolarization. Dekker3 identified four mechanisms of excitation: cathode make, cathode break, anode make, and anode break. Roth9 used the bidomain model of cardiac tissue to explain these mechanisms, and Wikswo et al.10 verified them by optical mapping in rabbit hearts. Suppose an S2 anodal stimulus is applied to refractory tissue. The hyperpolarization under the anode causes the tissue to recover from refractoriness by removing sodium channel inactivitation. Adjacent regions of depolarization are created along the fiber direction by anisotropy.11 After the stimulus pulse ends (the “break” of the pulse), depolarization diffuses into the previously hyperpolarized and now excitable tissue, exciting it.
Roth7 used the bidomain model to explain the mechanism of the dip in the anodal SI curve. To understand why the dip is present, realize that anode-break excitation requires a source of depolarization that interacts electrotonically with the hyperpolarized and excitable tissue under the anode. This depolarization arises from two sources. One is caused directly by the S2 stimulus (the virtual cathode), and another arises from the previous S1 AP. If S2 is applied during the repolarization phase of the S1 AP, then shortening the S1-S2 interval increases the S1 depolarization present, reducing the S2 threshold. Thus, the dip in the anodal SI curve arises from the electrotonic interaction of hyperpolarized tissue under the anode and adjacent depolarized tissue. Sidorov et al.12 performed optical mapping studies of rabbit hearts and verified that the dip occurs during break excitation.
Recently, Joung et al.13 proposed another explanation for the dip in the anodal SI curve, related to the intracellular calcium concentration (Cai) and the sodium-calcium exchange (NCX) current. They “tested the hypothesis that the maximum slope of the Cai decline (-(dCai/dt)max) corresponds to the timing of anodal dip on the SI curve and the initiation of repetitive responses and ventricular fibrillation (VF) after a premature stimulus (S2).” Their alternative mechanism is fundamentally different from the electrotonic mechanism. They conclude13 “The anodal dip (supernormal) period results from a complex interplay of factors, among which the Cai transient plays a critical role in shaping the balance between depolarizing and repolarizing forces during late phase 3 to reduce the excitation threshold”.
We use mathematical modeling to test these hypotheses regarding the response of refractory tissue to an anodal shock and to determine which of these mechanisms is the cause of the dip in the anodal SI curve.14
2. Methods
Cardiac tissue is represented by a three-dimensional bidomain model, and the active properties of the membrane are described by the Luo-Rudy dynamic (LRd) model,15 which includes a representation of calcium dynamics and the NCX current (INCX). The coupled partial differential equations in the bidomain model with LRd kinetics are:
| (1) |
| (2) |
where Vm and Ve are the transmembrane and extracellular potentials, g̃i and g̃e are the intracellular and extracellular conductivity tensors, C is the membrane capacitance per unit area (0.01 F/m2), β is the ratio of membrane surface area to tissue volume (0.3 µm−1), and Jion is the membrane ion current density.
To indicate position, we use cylindrical co-ordinates (z, ρ, θ) with the potential independent of the angle θ. The myocardial fibers are straight and lie along the z-axis. The tissue is characterized by four parameters: the intracellular (i) and extracellular (e) conductivities in the direction parallel to (z) and perpendicular to (ρ) the fibers. Their values16 (giz= 0.1863, giρ= 0.0179, gez = 0.1863, and geρ= 0.0894 S/m) are chosen so the tissue has unequal-anisotropy-ratios: giz/giρ= 10.4, gez/geρ= 2.08. For simulations using equal-anisotropy-ratios, giz= 0.1863, giρ = 0.0298, gez = 0.1836, and geρ = 0.0298 S/m.16, 31–33
We apply the unipolar stimulus through a cylindrical electrode centered at the origin, with a length of 1 mm along the z direction, a diameter of 0.4 mm along the ρ direction, and a surface area of 1.51 mm2. Three boundary conditions are applied at the tissue-electrode interface: the normal component of the intracellular current density is zero; the extracellular potential is constant; and the total current passing from the electrode into the extracellular space is equal to the stimulus current. In space-clamed simulations, we apply stimulus as an extra membrane current. The tissue has a length of 20 mm and diameter of 8 mm. At the tissue’s outer edge, the normal component of the intracellular current density is zero and the extracellular potential is zero. During unipolar cathodal stimulation the outer edge of the tissue behaves as the anode and has negligible influence on the electrical behavior near the stimulating electrode.
We solve the bidomain equations numerically by replacing the temporal and spatial derivatives by finite differences.9 At each time step, we solve Eq. (1) for Vm by Euler’s explicit method, using Ve from the previous time step in the source term, and then solve Eq. (2) for Ve by systematic overrelaxation, using the updated Vm in the source term. The time step is 0.01 ms, the space step is 0.1 mm and 0.04 mm in z and ρ directions. The spatial grid consists of 101 by 101 nodes. Approximately 40 minutes of CPU time are required for a 300 ms simulation. Symmetry allows us to consider only one quadrant of the z-ρ plane.
3. Results
The Action Potential in Normal Tissue
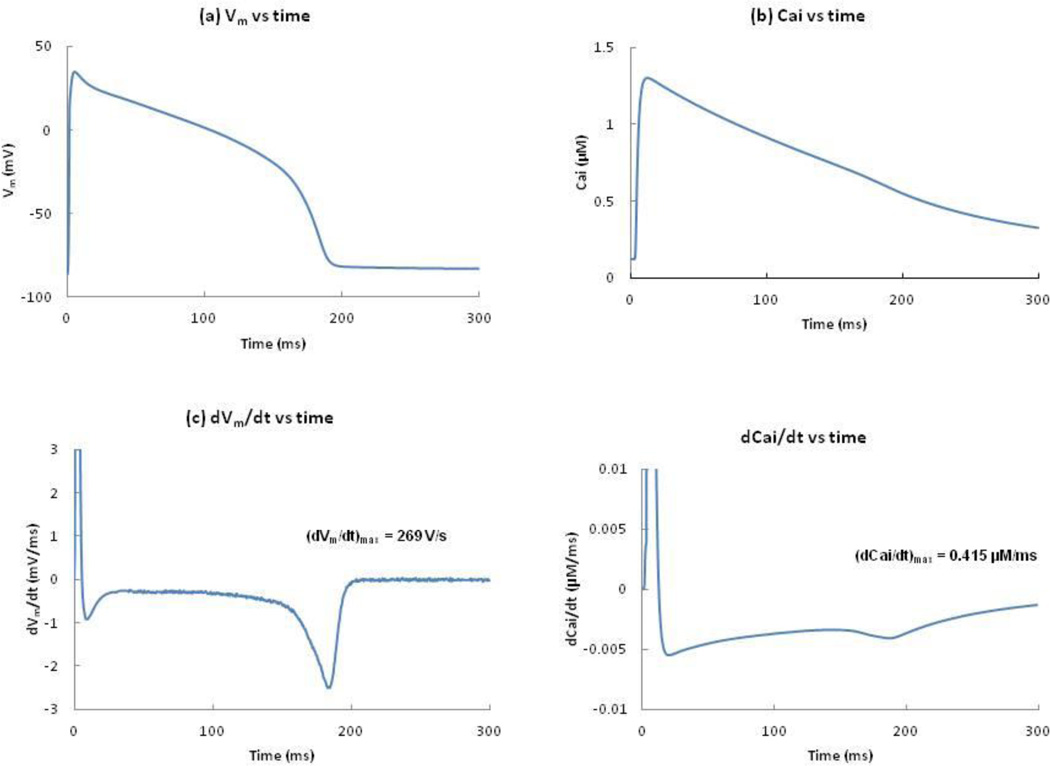
We apply a cathodal stimulus S1 of 0.15 mA (twice threshold) for 2 ms to resting tissue. This stimulus excites an AP that propagates outward from the electrode with propagation speeds of 0.33 and 0.13 m/s along the z and ρ-axes. Figure 1(a) shows Vm as a function of time. The action potential duration (APD) is about 192 ms. Figure 1(b) shows Cai as a function of time. The maximum Cai transient is 1.3 µM, achieved soon after the AP begins. Calcium ions move in and out of the sarcoplasmic reticulum (SR). The mechanism by which Ca2+ is released from the junctional sarcoplasmic reticulum (JSR) into the myoplasm is called calcium-induced-calcium-release (CICR).15 The plot of dVm/dt versus time shows the maximum upstroke velocity (269 V/s), which is important for CICR. In the Luo-Rudy model, the CICR current (Icicr) is only released if (dVm/dt)max is greater than 100 V/s. The rate of change in Cai (dCai/dt) is shown in figure 1(d). The dCai/dt values are highest during phase 1 (depolarization upstroke) and lowest during phase 3 (repolarization) of the AP.
Figure 1.
(a) Vm(b) Cai, (c) dVm/dt, and (d) dCai/dt, versus time following the S1 stimulus, at z = 1 mm and ρ = 0.2 mm. The peak value of dVm/dt and dCai/dt are 269 V/s and 0.415 µM/ms.
The Strength-Interval Curve
A second stimulus S2 is applied later through the same electrode. The S1-S2 interval is defined as the time from the start of S1 to the start of S2, where S2 has a duration of 20 ms and can be cathodal or anodal. In space-clamped simulations using the LRd model,15 we obtain no excitation from anodal stimulation, so there is no anodal SI curve. We also performed simulations using the bidomain model with equal-anisotropy-ratios. Although this case is non-physiological, it does eliminate the presence of virtual cathodes surrounding an anode (and virtual anodes surrounding a cathode), and thereby surpresses break excitation. Therefore, it allows us to better identify which features of the SI curve arise from electrotonic interactions between regions of depolarization and hyperpolarization, and which do not. We did not observe anodal excitation.
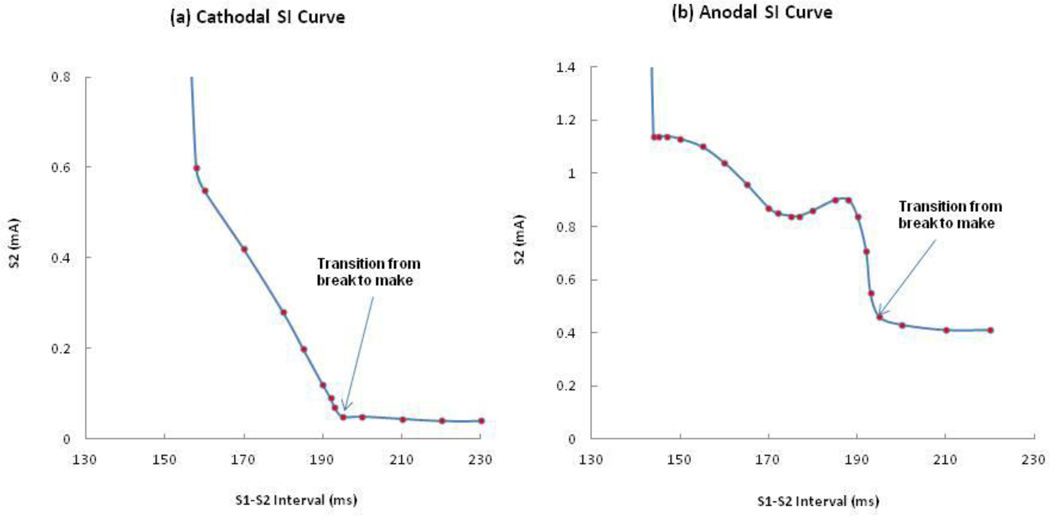
When we perform tissue simulations using the bidomain model with unequal-anisotropy-ratios, we find a complicated distribution of Vm including adjacent regions of depolarization and hyperpolarization.11 Figure 2(a) and 2(b) show the calculated SI curves for normal tissue with unequal-anisotropy-ratios. During cathodal stimulation, the SI curve falls with increasing interval, reflecting the recovery of excitability following the S1 AP. However, during anodal stimulation the SI curve contains a dip; a section has positive slope (174-188 ms). The anodal threshold stimulus during the dip is 0.84 mA (interval = 175 ms). The local maximum after the dip is 0.90 mA (interval = 188 ms). After reaching its peak, the SI curve falls abruptly.
Figure 2.
The calculated (a) cathodal, and (b) anodal SI curves with unequal-anisotropy-ratios.
The SI curves are divided into two sections, corresponding to ‘make’ and ‘break’ stimulation. There is an abrupt change in the SI curve that marks the transition from break to make (indicated by an arrow); make and break stimulation occur for intervals greater and less than 193 ms, respectively. There is a minimum interval below which the break mechanism does not stimulate the tissue, 156 and 143 ms for cathodal and anodal stimulation. The threshold for cathode make and anode make for diastolic tissue are 0.04 and 0.41 mA. The level of accuracy for the threshold is 0.01 mA in all calculations of SI curves.
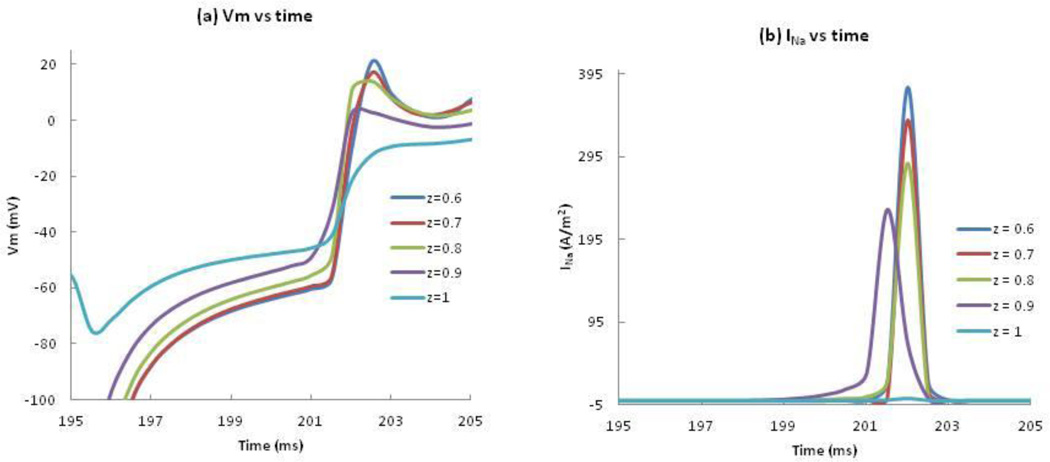
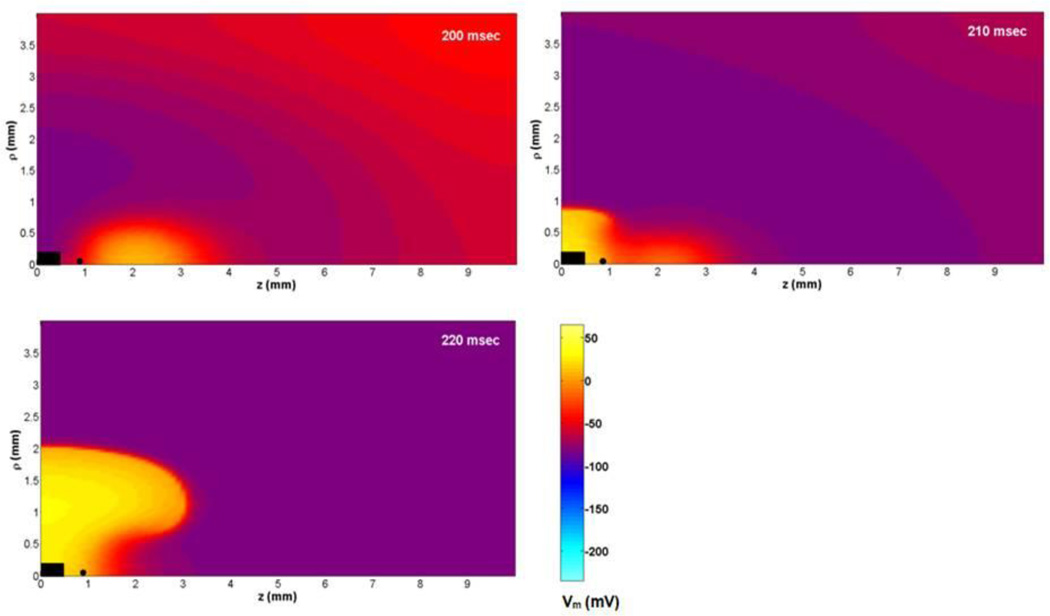
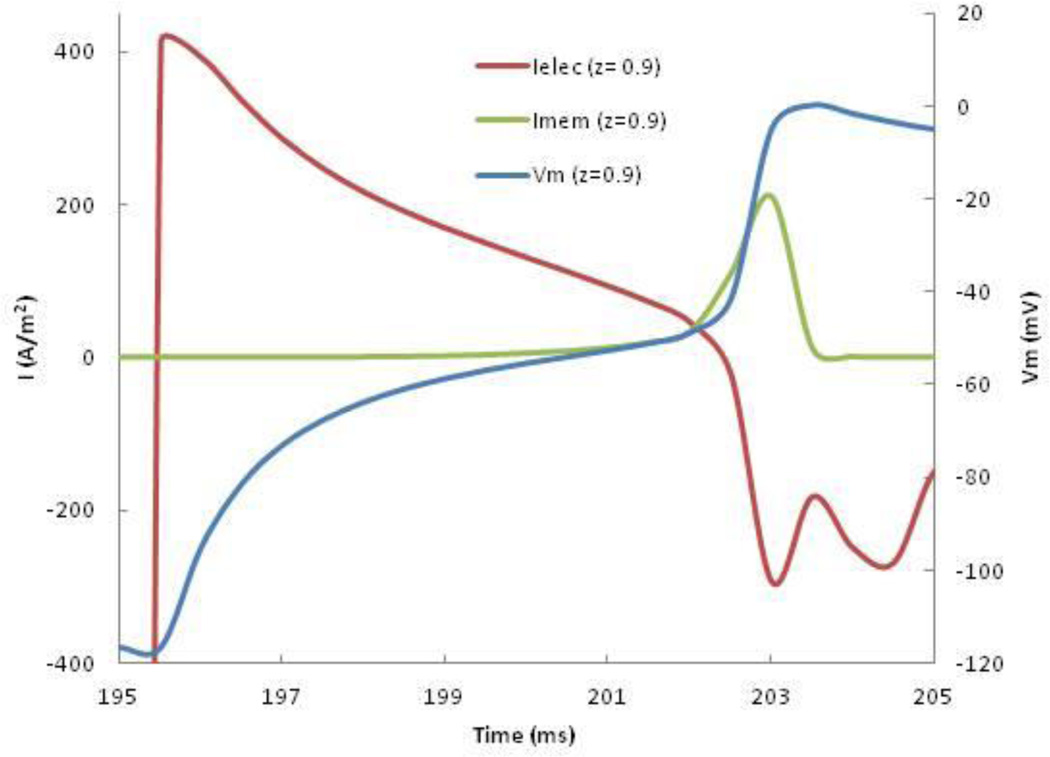
To determine the cause of the dip in the anodal SI curve, we calculated the negative of the membrane current (Jion) and the electrotonic current (∇. g̃e ∇Ve/β) following the S2 shock at the location where excitation begins. To find where anode-break excitation occurs, Vm and INa are plotted as functions of time at five locations along the z-axis (z = 0.6, 0.7, 0.8, 0.9 and 1 mm) (Figure 3(a), (b)). In each case, during the first few milliseconds after the end of the anodal stimulus, depolarization at the virtual cathode diffuses into the hyperpolarized tissue under the anode (electrotonic interaction). At z = 1 mm, the membrane current is nearly zero and does not contribute significantly to depolarization. At z = 0.9 and below, the membrane current contributes significantly to the depolarization upstroke. We consider z = 0.9 mm as the first excitation site because the upstroke happens first at this location (purple curve, Figure 3(a)). This is near the boundary between the virtual anode and virtual cathode. Figure 3(c) illustrates the spatial distribution of Vm at three times following the stimulus. The black dot represents the location (ρ = 0, z = 0.9 mm) where excitation begins.
Figure 3.
(a) Vm and (b) the negative of INa versus time at ρ = 0 and z = 0.6, 0.7, 0.8, 0.9, and 1 mm during anode-break excitation. (c) Vm as a function of z and ρ during and following a 20 ms duration anodal S2 stimulus of strength 0.85 mA applied from 175 to 195 ms. Only one quadrant of the z-ρ plane is shown. The black rectangle at the center indicates the electrode size and position. The black dot represents the location (z = 0.9 mm, ρ = 0) where the traces in Figure 4 are recorded.
Figure 4 plots the membrane and electrotonic contributions to Vm, at the location where excitation first occurs. We applied a 0.85 mA anodal S2 pulse for 20 ms starting at 175 ms. After the stimulus ends (195 ms), the electrotonic contribution rapidly becomes positive as the depolarization at the virtual cathode diffuses into this region. When Vm approaches threshold (-55 mV), INa activates, causing the membrane contribution to become positive. After 202 ms, the electrotonic contribution becomes small compared to the membrane current. But in the crucial few milliseconds before INa activates, the electrotonic current is much larger than the membrane current, and acts as the trigger for launching the AP. The wave front originates from the region where depolarization and hyperpolarization are adjacent: the edge of the virtual anode.
Figure 4.
The membrane (green) and electrotonic (red) contributions to the membrane current, and Vm (blue), as functions of time, at ρ = 0 and z = 0.9 mm following an anodal stimulus ending at 195 ms.
Impact of individual currents on the anodal SI curve
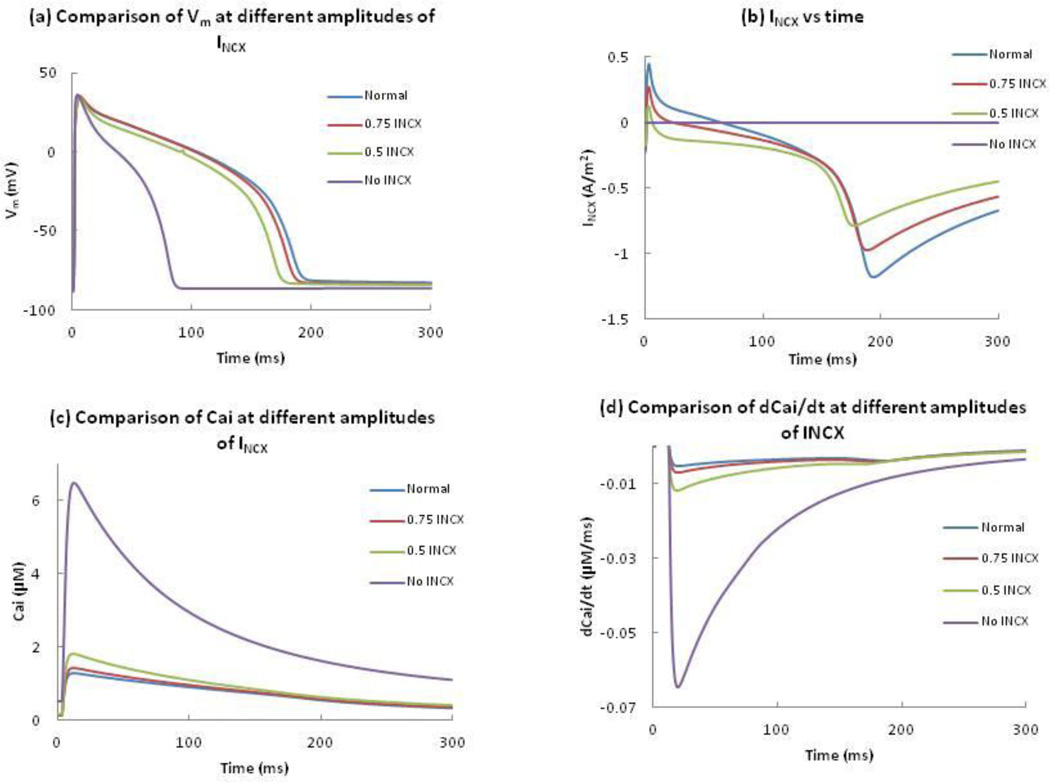
Joung et al.13 suggested that the dip in the anodal SI curve is related to INCX. We remove INCX or reduce it by 50% or 25% of its normal value to represent different amounts of block (Figure 5). Elimination of INCX results in an AP with a shorter duration of about 90 ms, a 56% reduction compared to normal. 75% and 50% of the normal INCX resulted in 1% and 7% reduction of the APD. For all cases, the amplitude of the AP is similar (Figure 5(a)). Figure 5(b) shows INCX as a function of time, and Figure 5(c) shows Cai for different modulations of INCX. Complete block of INCX increases the peak value of Cai by 400%. To determine the cause of this large calcium transient, we examine the Ca2+ in the myoplasm and SR during an AP. At rest, INCX is normally inward, moving Ca2+ out of the cell. This current helps maintain the low Cai, which in turn ensures that the JSR concentration is relatively low. In the absence of INCX, the total Ca2+ concentration in the JSR at the resting state increases to 14.0 mM (1.8 times the Ca2+ concentration present in the normal model). After the stimulus, Cai increases due to the entry of Ca2+ ions, and as a result, Ca2+ is released by CICR from the JSR into the myoplasm, resulting in a peak intracellular Ca2+ transient of 6.4 µM, which is significantly larger than a 1.4 µM peak transient when NCX is active. The maximum upstroke velocity in each case is greater than 100 V/s, which is enough to trigger the CICR mechanism. A decrease in INCX results in a slight reduction of the timing of – (dCai/dt)max (Fig. 5(d)). Complete removal of INCX results in a maximum value of – (dCai/dt)max.
Figure 5.
Comparison of (a) Vm, (b) INCX, (c) Cai, and (d) dCai/dt at different amplitudes of INCX, as a function of time. Blue, red, green and purple represent 100%, 75%, 50% and 0% of the normal INCX.
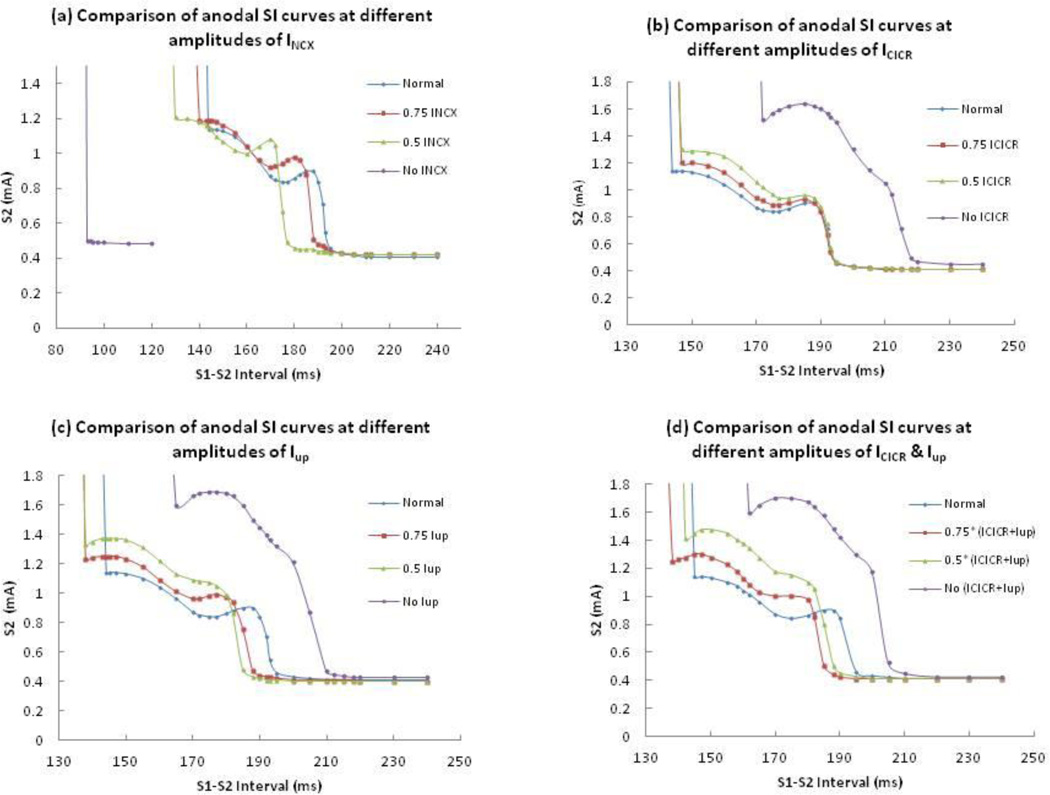
Figure 6(a) shows the anodal SI curves with 100%, 75%, 50% and 0% of normal INCX. Removal of INCX causes a nearly flat anodal SI curve shifted to short intervals; the entire curve corresponds to break excitation and the dip disappears. A 50% reduction in the normal INCX not only results in a steeper dip but also changes the timing of the dip from 175 to 155 ms. When we reduce INCX by 25%, the timing of the dip changes from 175 to 170 ms. The shapes of the anodal SI curves are similar for different reductions of INCX, but the curves shift towards shorter intervals as we reduce INCX.
Figure 6.
The comparison of calculated anodal SI curves at different amplitudes of (a) INCX, (b) Icicr, (c) Iup, and (d) both Icicr and Iup. Blue, red, green, and purple lines represent 100%, 75%, 50% and 0% of the normal current amplitude.
Joung et al.’s13 experiments indicate that the CICR blocker ryanodine suppresses the dip in the anodal SI curve and the Ca-ATPase blocker thapsigargin blocks calcium uptake by the SR and does not change the timing of the dip. They also claimed that combined ryanodine and thapsigargin infusion eliminated the dip. To test these experimental findings, we reduce (by 25% and 50% of normal value) or remove the Icicr and calcium uptake current (Iup) one at a time or at the same time and plot anodal SI curves at different amplitudes of those currents.
Figure 6 (b), (c) and (d) compare the anodal SI curves at different amplitudes of Icicr, Iup and combinations of both currents. Removal of these currents individually or collectively results in the AP having a longer APD and larger amplitude (Figure 7). These modifications change the transition of make and break section in the anodal SI curves. The break section needs a larger threshold stimulus for AP propagation. We see a larger dip in the break section of each curve. Even if the removal of Icicr results in a larger break section and longer APD (purple curve of 6 b), the timing of the dip does not change. In the absence of Iup and combined Icicr and Iup, the timing of the dip changes to 165 and 162 from 175 ms (purple curve of 6 (c) and (d)) respectively. In all cases, the dip regions of the curves have almost twice the S2 threshold compared to the normal model. Reduction in these currents by 25% and 50% result in a smaller dip. In all our simulations with different amplitudes of Icicr or Iup or their combination, we did not find a case where dip is completely eliminated.
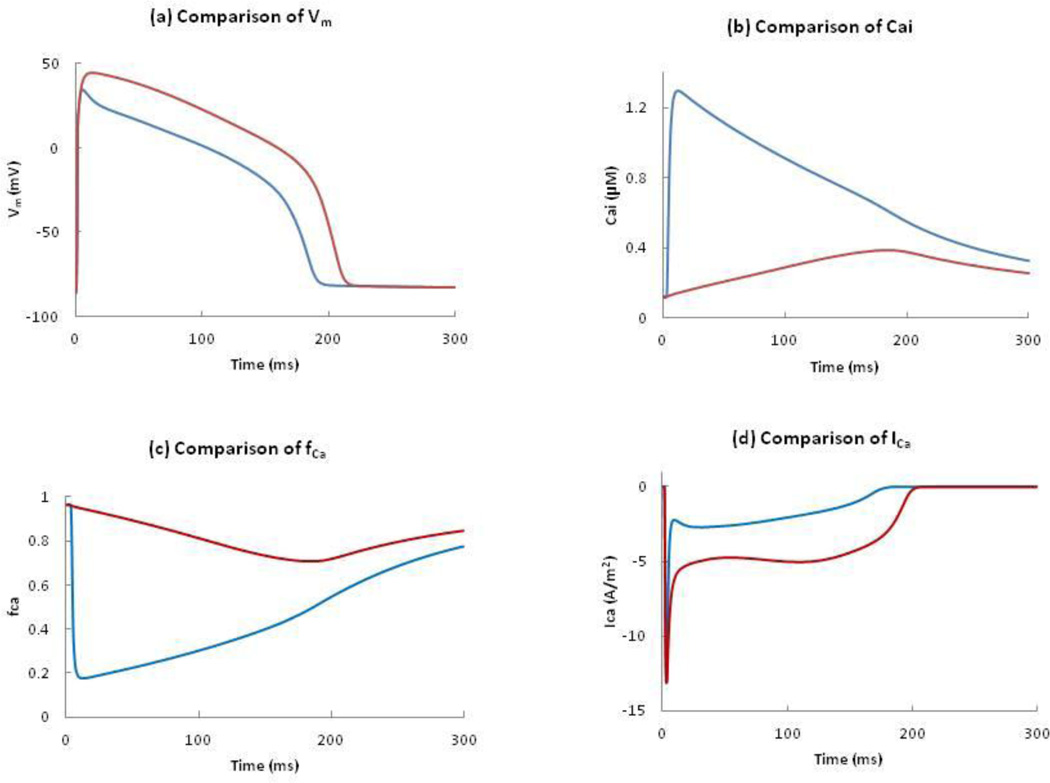
Figure 7.
Comparison of (a) Vm, (b) Cai, (c) fCa, and (d) ICa in the normal model and in the absence of ICICR. Blue and red curves represent the presence and absence of ICICR.
Figure 7(a) compares the changes in the AP with and with out Icicr. In the absence of Icicr, the APD increases from 192 to 212 ms and the peak of the AP increases from 34 to 44 mV (the red curve of figure 7(a)). To explain the cause of the greater amplitude and longer APD in the absence of Icicr, we need to understand the role of the calcium-dependent inactivation gate (fCa). In the absence of Icicr, Cai increases very slowly and reaches a maximum of 0.38 µM at 200 ms (Figure 7(b)). This slowly rising Cai only decreases the fCa slightly compared to normal tissue in which the inactivation is more dramatic because of the higher Cai. At 50 ms, fCa is 0.2 in the normal model and 0.9 in the absence of Icicr and the corresponding values of ICa are -2.6 and -4.8 A/m2 respectively. This is consistent with Luo and Rudy’s observation that “Because the smaller peak intracellular Ca2+ transient implies a reduced level of Ca2+-dependent inactivation, ICa is relatively larger, and the plaeau potential is more positive.”15 The plots of fCa and ICa in both cases are shown in Figure 7(c) and 7(d). The slow changes of the fCa gate and the slow decrease of the inactivation gate (f) determine the plateau of ICa. In our case, the high value of fCa gate (> 0.7 ) makes ICa relatively large, and the plateau potential more positive.
In the absence of Iup, Cai increases slowly and reaches a maximum of 0.5 µM at 185 ms. There is neither free Ca2+ nor Ca2+ buffered by CSQN in the JSR during the resting state when Iup is zero, so no Ca2+ is released from the JSR into the myoplasm. As a result, there is no spike-like CICR release of Ca2+ from the JSR. Hence when Iup is removed Cai increases slowly, and is due to only the Ca2+ entry into the cell from the extracellular space through the calcium channel. This increases the APD and amplitude of the AP in the absence of Iup and combined Iup and Icicr.
4. Discussion
In our simulations, we identified four mechanisms of excitation: cathode make, anode make, cathode break and anode break.9,10 When tissue having equal-anisotropy-ratios was excited, we did not observe an electrotonic effect because the virtual cathodes disappear; cathode-break excitation does not occur and the entire cathodal SI curve corresponds to make excitation, and no excitation occurs during anodal stimulation. The equal-anisotropy-ratios simulations are similar to space-clamp simulations in that there are no adjacent regions of depolarization and hyperpolarization. Neither case resulted in anodal stimulation, suggesting the importance of electrotonic interactions in excitation.
The shapes of the SI curves (Figure 2) are similar to those calculated previously7 using the Beeler-Reuter model.17 However, the cathodal and anodal SI curves started 127 ms earlier than the respective SI curves with the Beeler-Reuter model because of the different APDs in the two models. The calculated anodal SI curve has the same shape as measured experimentally by Sidorov et al.12 The curve has a dip, plateau phase, and descent at the end of the relative refractory period. The presence of the dip in the bidomain simulations but not the space-clamped simulations or the simulations with equal-anisotropy-ratios suggests the dominance of the electrotonic interaction between virtual anodes and cathodes over INCX as a mechanism for the dip.
We find an abrupt transition from anode-make to anode-break stimulation as noted by Roth7. The fall in the anodal SI curve at 193 ms (Fig. 2b) reflects the transition from make to break excitation. However, Sidorov et al.12 found a gradual transition in the anodal SI curve. The mean values of threshold current in diastolic tissue are 0.04 and 0.41 mA for cathodal and anodal stimulation. These results are consistent with Roth and others7,9,18 who used bidomain calculations to find the cathodal and anodal diastolic threshold. However, there is a discrepancy between theoretical and experimental value of threshold stimulation. Experimentally Dekker3 found mean values of 0.4 and 1.3 mA and Sidorov et al.12 found 0.15 and 1.05 mA for cathodal and anodal diastolic stimulation, respectively. This disparity in threshold is well known and has been discussed previously, although a satisfactory explanation has not been determined.19
Ranjan et al.20, 21 suggested that the dip in the anodal SI curve could be explained by the effect of a slow hyperpolarization-activated inward current. Roth and Chen22 added such a current to the original Luo-Rudy model,23 and compared the SI curves with and without it. To determine the underlying cause of the dip in the strength-interval curve, they calculated the membrane and electrotonic currents following the S2 shock at the location where excitation begins. They found that while both electrotonic current and a hyperpolarization-activated current contribute to anode-break excitation, only the electrotonic interactions are responsible for the dip in the anodal SI curve22. Roth and Chen22 also stressed that if the electrotonic current is responsible for excitation, the wave front should originate from the region where depolarization and hyperpolarization are adjacent; the edge of the virtual anode. To determine the cause of the dip in the SI curve, we calculated the membrane and electrotonic currents following the S2 shock at the location where excitation begins (z = 0.9 mm, which is the edge of the virtual anode). Figure 4 indicates that electrotonic currents, not calcium or other membrane currents, are present during the crucial few milliseconds before excitation. This simulation supports the hypothesis that virtual cathodes and anodes, and not membrane current, is responsible for the dip.
Genetic knock-out mice exist that have reduced or augmented Na-Ca exchange.24–28 Previous space-clamped simulations in these mice have shown that a reduction of INCX has only a small effect on the AP amplitude and duration. In our studies, 75% and 50% of the normal INCX resulted in slight reduction of the normal APD and no changes in the amplitude. This is in agreement with the experimental findings.
Joung et al.13 claimed that the dip in the anodal SI curve is related to INCX. We reduced or removed INCX from our model to see if the dip disappears. The dip indeed disappears with no INCX, but is present with 50% and 75% of normal INCX, suggesting the dominance of the electrotonic over the NCX mechanism (Figure 6(a)). The bidomain model was first used to explain the dip in the anodal SI curve using a membrane model that did not include INCX.7 It is difficult to imagine that INCX plays a crucial role in explaining the dip if simulations predict the dip using a model that does not contain INCX.
We get the maximum value of -dCai/dt at an interval between 180-190 ms and this is when we have the dip in the anodal SI curve. This is consistent in every calculation we have done. So the timing of -(dCai/dt)max corresponds to the dip in the anodal SI curve, which is consistent with Joung et al’s finding. They argued that the peak of INCX (as measured by -dCai/dt) occurs at the same time as the dip, “suggesting that INCX activation most likely played a role in the anodal dip of the SI curve.”13 Our results indicate that although INCX and the dip do indeed occur at the same time, this is not a causal relationship. One virtue of numerical simulations is that we can easily isolate the causal factors. In space-clamped simulations and simulations using equal anisotropy ratios, INCX is present with a similar time course, but there is no dip in the anodal SI curve (or even any anodal excitation). If we compare the shape of the curves of dCai/dt and INCX as functions of time, they look similar, but they are not identical (Figure 5). Even in the complete absence of INCX, we find a peak in the calcium concentration time course. Hence dCai/dt cannot be taken as equivalent to INCX in all cases.
Joung et al.’s experiments13 used 3 and 10 µM of ryanodine. It is known that at 1 nM – 10 µM ryanodine causes the ryanodine receptor, RyR, to open to a subconductance level,29 whereas at high concentrations of 0.3 – 2 mM ryanodine binds lower affinity sites and completely blocks the RyR.30 Blocking the CICR (by the application of a high concentration of ryanodine) has resulted in APD prolongation and but no shift in the dip of the anodal SI curve toward longer S1-S2 intervals. Even partial blockage of CICR has no profound effect on the timing and position of the dip in the anodal SI curve. Hence Icicr is not responsible for the dip, as suggested by Joung et al.13 Their experiments indicate that thapsigargin blocks calcium uptake by the SR and does not change the timing of the anodal dip. But in our simulation, the dip occurs 10 ms earlier than the dip in the normal model. Also, we still find a dip present upon the reduction and elimination of the ICICR and Iup, which is not consistent with Joung et al.’s finding (Figure 6 b, c & d).
We suggest that the crucial event leading to a dip in the anodal SI curve is the rapid repolarization at the end of the S1 action potential, and the electrotonic interaction of the repolarization with the virtual anodes and cathodes. As proposed previously, anode-break excitation requires a source of depolarization to excite the hyperpolarized and excitable tissue under the anode. S1 depolarization can replace a virtual cathode as the source of this depolarization, and the S1 depolarization is greater at shorter intervals, leading to a dip. The fact that the magnitude of INCX occurs at the same time as the repolarization of the action potential is a coincidence, and not a cause of the behavior.
Limitations of the Model
Our model has several limitations. We assume a uniform straight fiber geometry. Our membrane model is restricted to that proposed by Luo and Rudy (1994). Other models are available,34 including other currents such as the Ca-activated K channel. Purkinje fibers may play a role in the recurrence of VF after defibrillation.35 We have not included Purkinje fibers in this calculation. Many experiments are performed by stimulating the epicardial surface, in which case the Purkinje fibers should play a smaller role than during endocardial excitation. We assume the experiment is performed at the surface of the heart in air, as in a Langendorff apparatus. If the tissue is bounded by a volume conductor, the results may be different.
5. Conclusion
We integrated the bidomain model together with the LRd model to obtain a detailed calculation of the mechanism of excitation and to understand the electrical behavior of the heart. The dominance of the electrotonic mechanism implies the importance of the spatial distribution of virtual electrodes during excitation. This study provides new and important insights into the response of cardiac tissue to strong electric shocks, and helps to distinguish the role of electrotonic and calcium interactions during excitation. This in turn will lead to a better understanding of how best to model tissue-shock interactions and optimize advanced defibrillation protocols.
Acknowledgement
This research was supported by a Provost graduate student research award at Oakland University, and by NIH grant R01HL118392.
References
- 1.Van Dam RT, Durrer D, Strackee J, Van Der Twell LH. The excitability cycle of the dog’s left ventricle determined by anodal, cathodal and bipolar stimulation. Circ Res. 1956;4:196–204. doi: 10.1161/01.res.4.2.196. [DOI] [PubMed] [Google Scholar]
- 2.Cranefield PF, Hoffman BF, Siebens AA. Anodal excitation of cardiac muscle. Am J Physiol. 1957;190:383–390. doi: 10.1152/ajplegacy.1957.190.2.383. [DOI] [PubMed] [Google Scholar]
- 3.Dekker E. Direct current make and break thresholds for pacemaker electrodes on the canine ventricle. Circ Res. 1970;27:811–823. doi: 10.1161/01.res.27.5.811. [DOI] [PubMed] [Google Scholar]
- 4.Mehra R, Furman S. Comparison of cathodal, anodal, and bipolar strength-interval curves with temporary and permanent pacing electrodes. British Heart Journal. 1979;41:468–476. doi: 10.1136/hrt.41.4.468. [DOI] [PMC free article] [PubMed] [Google Scholar]
- 5.Mehra R, McMullen M, Furman S. Time-dependence of unipolar cathodal and anodal strength–interval curves. PACE. 1980;3:526–530. doi: 10.1111/j.1540-8159.1980.tb05271.x. [DOI] [PubMed] [Google Scholar]
- 6.Chen PS, Wolf PL, Cha YM, Peters BB, Topham SL. Effects of subendocardial ablation on anodal supernormal excitation and ventricular vulnerability in open-chest dogs. Circulation. 1993;87:216–229. doi: 10.1161/01.cir.87.1.216. [DOI] [PubMed] [Google Scholar]
- 7.Roth BJ. Strength-interval curves for cardiac tissue predicted using the bidomain model. J Cardiovasc Electrophysiol. 1996;7:722–737. doi: 10.1111/j.1540-8167.1996.tb00580.x. [DOI] [PubMed] [Google Scholar]
- 8.Kandel SM, Roth BJ. The strength-interval curve in cardiac tissue. Computational and Mathematical Methods in Medicine. 2013:134163. doi: 10.1155/2013/134163. [DOI] [PMC free article] [PubMed] [Google Scholar]
- 9.Roth BJ. A mathematical model of make and break electrical stimulation of cardiac tissue by a unipolar anode or cathode. IEEE Trans Biomed Eng. 1995;42:1174–1184. doi: 10.1109/10.476124. [DOI] [PubMed] [Google Scholar]
- 10.Wikswo JP, Lin S-F, Abbas RA. Virtual electrodes in cardiac tissue: A common mechanism for anodal and cathodal stimulation. Biophys J. 1995;69:2195–2210. doi: 10.1016/S0006-3495(95)80115-3. [DOI] [PMC free article] [PubMed] [Google Scholar]
- 11.Sepulveda NG, Roth BJ, Wikswo JP. Current injection into a two-dimensional anisotropic bidomain. Biophys J. 1989;55:987–999. doi: 10.1016/S0006-3495(89)82897-8. [DOI] [PMC free article] [PubMed] [Google Scholar]
- 12.Sidorov VY, Woods MC, Baudenbacher P, Baudenbacher F. Examination of stimulation mechanism and strength–interval curve in cardiac tissue. Am J Physiol. 2005;289:H2602–H2615. doi: 10.1152/ajpheart.00968.2004. [DOI] [PubMed] [Google Scholar]
- 13.Joung B, Park H-W, Maruyama M, Tang L, Song J, Han S, et al. Intracellular calcium and the mechanism of anodal supernormal excitability in Langendorff perfused rabbit ventricles. Circ J. 2011;75:834–843. doi: 10.1253/circj.cj-10-1014. [DOI] [PMC free article] [PubMed] [Google Scholar]
- 14.Kandel SM, Roth BJ. The dip in the anodal strength-interval curve in cardiac tissue. BMES 2012 Annual Meeting Atlanta GA. 2012 Oct;:24–27. [Google Scholar]
- 15.Luo CH, Rudy Y. A dynamic model of the cardiac ventricular action potential. I. Simulations of ionic currents and concentration changes. Circ Res. 1994;74:1071–1096. doi: 10.1161/01.res.74.6.1071. [DOI] [PubMed] [Google Scholar]
- 16.Roth BJ. Electrical conductivity values used with the bidomain model of cardiac tissue. IEEE Trans Biomed Eng. 1997;44:326–328. doi: 10.1109/10.563303. [DOI] [PubMed] [Google Scholar]
- 17.Beeler GW, Reuter H. Reconstruction of the action potential of ventricular myocardial fibres. J Physiol (Lond.) 1977;268:177–210. doi: 10.1113/jphysiol.1977.sp011853. [DOI] [PMC free article] [PubMed] [Google Scholar]
- 18.Roth BJ, Wikswo JP. Electrical stimulation of cardiac tissue: A bidomain model with active membrane properties. IEEE Trans Biomed Eng. 1994;41:232–240. doi: 10.1109/10.284941. [DOI] [PubMed] [Google Scholar]
- 19.Roth BJ. Artifacts, assumptions, and ambiguity: Pitfalls in comparing experimental results to numerical simulations when studying electrical stimulation of the heart. Chaos. 2002;12:973–981. doi: 10.1063/1.1496855. [DOI] [PubMed] [Google Scholar]
- 20.Ranjan R, Chiamvimonvat N, Thakor NV, Tomaselli GF, Marban E. Mechanism of anode break stimulation in the heart. Biophys J. 1998;74:1850–1863. doi: 10.1016/S0006-3495(98)77895-6. [DOI] [PMC free article] [PubMed] [Google Scholar]
- 21.Ranjan R, Tomaselli GF, Marban E. A novel mechanism of anode-break stimulation predicted by bidomain modeling. Circ Res. 1999;84:153–156. doi: 10.1161/01.res.84.2.153. [DOI] [PubMed] [Google Scholar]
- 22.Roth BJ, Chen J. Mechanism of anode break excitation in the heart: The relative influence of membrane and electrotonic factors. J Biol Systems. 1999;7:541–552. [Google Scholar]
- 23.Luo CH, Rudy Y. A model of the ventricular cardiac action potential. Depolarization, repolarization, and their interaction. Circ Res. 1991;68:1501–1526. doi: 10.1161/01.res.68.6.1501. [DOI] [PubMed] [Google Scholar]
- 24.Henderson SA, Goldhaber JI, So JM, Han T, Motter C, Ngo A, et al. Functional adult myocardium in the absence of Na+-Ca2+ exchange: Cardiac-specific knockout of NCX1. Circ Res. 2004;95:604–611. doi: 10.1161/01.RES.0000142316.08250.68. [DOI] [PubMed] [Google Scholar]
- 25.Pott C, Ren X, Tran DX, Yang M-J, Henderson S, Jordan MC, et al. Mechanism of shortened action potential duration in Na+-Ca2+ exchanger knockout mice. Am J Physiol. 2006;292:C968–C973. doi: 10.1152/ajpcell.00177.2006. [DOI] [PubMed] [Google Scholar]
- 26.Roos KP, Jordan MC, Fishbein MC, Ritter MR, Friedlander M, Chang HC, et al. Hypertrophy and heart failure in mice overexpressing the cardiac sodium-calcium exchanger. J Cardiac Failure. 2007;13:318–329. doi: 10.1016/j.cardfail.2007.01.004. [DOI] [PMC free article] [PubMed] [Google Scholar]
- 27.Wang J, Chan TO, Zhang X-Q, Gao E, Song J, Koch WJ, et al. Induced overexpression of Na+/Ca2+ exchanger transgene: Altered myocyte contractility, [Ca2+] transients, SR Ca2+ contents, and action potential duration. Am J Physiol. 2009;297:H590–H601. doi: 10.1152/ajpheart.00190.2009. [DOI] [PMC free article] [PubMed] [Google Scholar]
- 28.Jordan MC, Henderson SA, Han TY, Fishbein MC, Philipson KD, Roos KP. Myocardial function with reduced expression of the sodium-calcium exchanger. J Cardiac Failure. 2010;16:786–796. doi: 10.1016/j.cardfail.2010.03.012. [DOI] [PMC free article] [PubMed] [Google Scholar]
- 29.Rousseau E, Smith JS, Meissner G. Ryanodine modifies conductance and gating behavior of single Ca-2+ release channel. Am J Physiol. 1987;253:C364–C368. doi: 10.1152/ajpcell.1987.253.3.C364. [DOI] [PubMed] [Google Scholar]
- 30.Lai FA, Misra M, Xu L, Smith HA, Meissner G. The ryanodine receptor-Ca-2+ release channel complex of skeletal-muscle sarcoplasmic-reticulum – evidence for a cooperatively coupled, negatively charged homotetramer. J Biol Chem. 1989;264:16776–16785. [PubMed] [Google Scholar]
- 31.Clerc L. Directional differences of impulse spread in trabecular muscle from mammalian heart. J. Physiol. (London) 1976;255:335–346. doi: 10.1113/jphysiol.1976.sp011283. [DOI] [PMC free article] [PubMed] [Google Scholar]
- 32.Roberts D, Hersch LT, Scher AM. Influence of cardiac fiber orientation on wavefront voltage, conduction velocity and tissue resistivity. Circ Res. 1979;44:701–712. doi: 10.1161/01.res.44.5.701. [DOI] [PubMed] [Google Scholar]
- 33.Roberts D, Scher AM. Effect of tissue anisotropy on extracellular potential fields in canine myocardium in situ. Circ Res. 1982;50:342–351. doi: 10.1161/01.res.50.3.342. [DOI] [PubMed] [Google Scholar]
- 34.O’hara T, Rudy Y. Quantitative comparison of cardiac ventricular myocyte electrophysiology and response of drugs in human and nonhuman species. Am J Physiol. 2012;302(5):H1023–H1030. doi: 10.1152/ajpheart.00785.2011. [DOI] [PMC free article] [PubMed] [Google Scholar]
- 35.Maruyama M, Joung B, Tang L, Shinohara T, On YK, et al. Diastolic Intracellular Calcium-Membrane Voltage Coupling Gain and Postshock Arrhythmias Role of Purkinje Fibers and Triggered Activity. Circ Res. 2010;106:399–408. doi: 10.1161/CIRCRESAHA.109.211292. [DOI] [PMC free article] [PubMed] [Google Scholar]


