Abstract
Introduction
Esophageal multiple intraluminal impedance (MII) measurement has been in used to detect gastroesophageal reflux and bolus transport. It is not clear if MII can detect changes in luminal cross sectional area (CSA) during bolus transport.
Aims
Intraluminal ultrasound (US) images, MII and high resolution manometry (HRM) were recorded simultaneously to determine temporal relationship between CSA and impedance during esophageal bolus transport and to define the relationship between peak distension and nadir impedance.
Methods
Studies were conducted in five healthy subjects. MII, HRM and US images were recorded 6 cm above LES. Esophageal distensions were studied during swallows and injections of 0.5 N saline bolus into the esophagus.
Results
Temporal change in esophageal CSA correlates with changes in impedance (r value: mean ± SD = −0.80 ± 0.08, range: −0.94 to −0.66). Drop in impedance during distension occurs as a two step process; initial large drop associated with onset of CSA increase, followed by a small drop during which majority of the CSA increase occurs. Peak CSA and nadir impedance occur within 1 s of each other. Increase in swallow and injection volumes increased the CSA, had no effect on large drop but increased the small drop amplitude. We observed a significant correlation between peak CSA and nadir impedance (r = − 0.90, p<0.001) and a better correlation between peak CSA and inverse impedance (r = 0.94, p<0.001).
Conclusion
Further studies are needed to confirm that intraluminal impedance recordings may be used to measure luminal CSA during esophageal bolus transport.
Keywords: Esophageal peristalsis, multiple intra luminal esophageal impedance, esophageal cross section area, esophageal distension
INTRODUCTION
Multiple intraluminal impedance (MII) recording of the esophagus has been used to detect gastroesophageal reflux (GER) and bolus transport for almost two decades (1, 2). Since MII measurement is not related to acidity of the GER, it is an effective tool to record neutral pH and air reflux, both of which can’t be detected by pH monitoring (3, 4). Impedance recordings can also detect movement of esophageal bolus and its clearance. Concurrently performed contrast fluoroscopy and intraluminal impedance recordings show that arrival of bolus head on the impedance electrodes correlates with the onset of fall in impedance, nadir impedance with peak distension during bolus transport and return of impedance to 50 % of baseline with the bolus clearance (2, 3). The time between the onset of fall (50 %) and return (50 %) of impedance to baseline is referred to as the bolus clearance time (5). Since the recognition of bolus head on fluoroscopy and its arrival onto the impedance electrodes in the esophagus is somewhat subjective, the precise relationship between luminal CSA and changes in impedance values during esophageal bolus transport may not be completely accurate. Furthermore, US imaging studies show that the bolus during peristaltic transport is shaped like an “American football”, i.e., tapered at the two ends, and not a tear drop (clubbed head) as assumed in the prior studies (6).
Based on the physical principles, impedance value is directly proportional to the resistivity of conductive medium (tissue or solution) in between the electrodes and the distance between electrodes, and inversely to the cross sectional area (CSA) of the tube. In fact, techniques of impedance planimetry and functional luminal imaging probe (FLIP) (7, 8) rely on the relationship between CSA and impedance value to measure esophageal CSA in-vivo. In both of the above techniques, impedance electrodes are positioned inside a balloon/bag that is filled with an electrolyte solution of known resistivity. In case of MII technique, impedance electrodes are located in the esophageal lumen and not in a balloon or a bag. Recent studies suggest that the nadir impedance measured by MII technique is inversely related to the diameter of the upper esophageal sphincter (9). However, there is no information available on the temporal correlation between changes in the esophageal CSA and impedance during peristaltic bolus transport using MII.
The goals of our studies therefore were to determine, 1) the temporal correlation between changes in luminal CSA and changes in impedance during esophageal distension induced by swallow and direct injection of fluid into the esophagus, and 2) the relationship between peak distension and nadir impedance values during swallows and injections of different bolus volumes in the esophagus. We conducted both in-vivo and in-vitro studies to achieve the above aims.
METHODS & EXPERIMENTAL DESIGN
In-Vitro Studies
These studies were conducted by placing the impedance catheter in plastic tubes of known diameters. Tubes were filled with 0.5 and 1 N saline. Nadir impedance values were noted. Several observations were made for each tube and mean value for each tube cross sectional area was determined using micrometer and confirmed by volume of water over a known length of the tube.
In-Vivo Studies
Subjects & Study Protocol
These studies were conducted in 5 healthy volunteers (4 men, age = 29 ± 5.3 years). Normal subjects responded to advertisement and were monetarily reimbursed for their participation. Study protocol was approved by the “University of California San Diego Institutional Review Board for the Protection of Humans” and each individual gave written consent prior to enrollment in the study. Subjects fasted and stopped smoking for at least 6 hours prior to the commencement of study. A custom designed 8 F, HRM catheter equipped with solid-state pressure transducers and impedance electrodes (1.6 cm apart) (Unisensor AG, Attikon, Switzerland) was used for these studies. Pressure and impedance recordings were made on a digital physiological recorder and proprietory software (Medical Measurement System, Enschede, The Netherlands). Pressure and impedance data were acquired at a temporal resolution of 20 Hz. An US catheter (6 F, 15 MHz, Boston Scientific Instruments, Boston, MA, USA) was taped with the HRM catheter in such a manner that the US transducer was positioned in the middle of the 2 adjcent pressure transducers and the corresponding two impedance elctrodes, so as to avoid the pressure transducer from shadowing the US image. A 6 F silicon tube for injections in the esophagus was also taped to the HRM impedance catheter, 5 cm proximal to the ultrasound transducer (Figure 1A).
Figure 1.

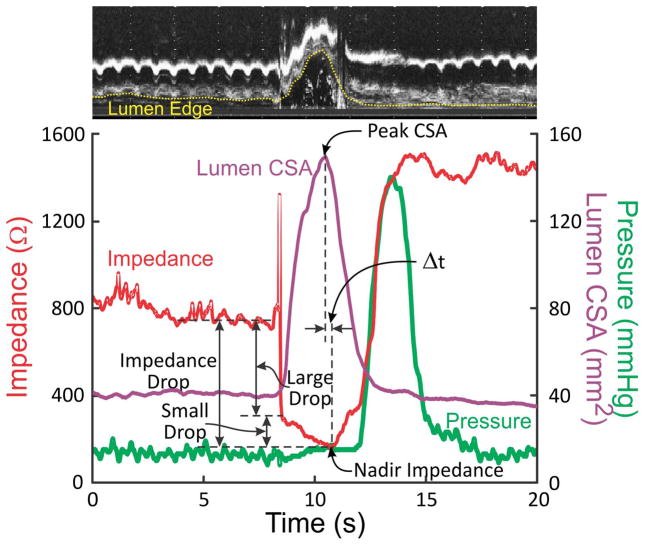
(A) Schematic of the catheter assembly. (B) Temporal correlation between changes in luminal CSA and changes in impedance values. A B-mode US image is shown on the top of the graph and it shows changes in luminal CSA over time on one side of the US probe. Note an increase in impedance coincides with the passage of air through the esophagus, followed by a large drop in impedance with the onset of increase in luminal CSA, which was followed by a slow fall in impedance associated with the increase in the luminal CSA. Peak cross sectional area coincides approximately with the nadir impedance.
Both, nasal cavity and oropharynx were anestheized using 1 % lodocaine gel and 1 % bezocaine spray and the catheter assembly was introduced via nose into the esophagus and positioned with the US transducer located 6 cm above the LES. Simultaneous esophageal pressures, US images and intraluminal impedance signals were acquired. Approximately 10–20 % of the circumference of the esophagus was not observed in the US images due to shadowing by the HRM catheter.
Following placement of the probes, an accomodation period of 10 minutes was allowed. Subjects were positioned in the supine postion and data acquired during swallows of 5, 10 and 15 ml of 0.5 N saline, spaced at 60 s intervals. Swallows with each volume were repeated at least five times. After swallows, 5, 10 and 15 ml of 0.5 N saline was injected directly into the esophagus through the injection catheter, five times each at 60 s intervals. At the completion of each injection, subjects were instructed to swallow, to clear the esophagus of the bolus. In two subjects, additional swallows and injections of 5, 10 and 15 ml of 1 N saline (using the protocol described earlier) were performed.
US images were recored on a VHS tape recorder. Pressure, impedance and US recordings were synchronized using a time encoder (analog time clock on the video images at a resolution of one hundredth of a second). In addition, all events were also synchronized using simultaneous event markers on the two recorders.
Data Analysis
US images were digitized at video rates (30 images/s) using a video capture card (Pinnacle express; Mountain View, CA, USA) interfaced to a personal computer using Adobe Premiere 6.0 program (Adobe Systems; Mountain View, CA, USA). US images were captured in AVI format and exported as B-mode images using Adobe Premiere at 30 f/s. For calculating the maximum CSA the corresponding B-mode US image was selected. Mucosa and liquid interface was marked manually using Sigma Scan Pro (Jandel Scientific, San Rafael, CA, USA) to calculate esophageal luminal CSA. Linear regression analysis was used to derive the correlation coefficient between peak luminal CSA and nadir impedance for different volumes of swallows and injections.
Data were analyzed only for those events where the US image quality was adequate to define the luminal edges in most of the M-mode images. The B-mode US images were converted into sixteen qui-spaced M-mode images (every 22.5°). Esophageal lumen edge was manually drawn in each of the sixteen M-mode images for calculating the time-dependent change of luminal CSA. In all M-mode images, the radial distance between the center of the image and the luminal edges were determined. Area of the triangular region encompassed by the two adjacent radial lines was calculated (area = 0.5 × R1 × R2 x sin α, where R1 and R2 are two adjacent radial distances and α = 22.5° is the angle between them). Total lumen CSA was obtained as the sum of 16 triangular areas. Expected luminal CSA at baseline while the esophageal lumen is collapsed should be approximately 10 mm2 based on the size of the two US and HRM catheters used. The impedance and esophageal CSA value in each swallow and injection derived from M-mode US images were temporally correlated from 1 s before the onset of swallow to 1 s after the end of esophageal contraction wave. Following variables were analyzed: large impedance drop from baseline, small impedance drop from end of large impedance drop to nadir impedance, impedance drop from baseline, percent drop in large and small impedance, nadir impedance value, peak CSA value, time of nadir impedance, time of peak CSA and the time interval between the peak CSA and the nadir impedance (see figure 1B).
Statistical Analysis
Data are reported as mean ± standard error of mean (SEM) except when stated otherwise. Data were analyzed using one-way ANOVA (parametric and nonparametric) and Student’s paired or unpaired t-test where appropriate. Correlation between luminal CSA and impedance as well as inverse of impedance values were analyzed using Pearson correlation coefficient. Statistical significance was defined as p < 0.05.
RESULTS
Temporal Correlation Between Esophageal Distension & Impedance
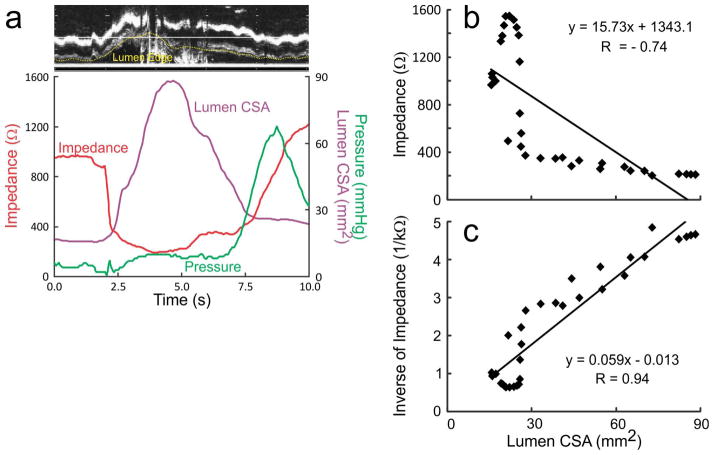
A total of 54 events (27 swallows and 27 injections, nineteen 5 ml, sixteen 10 ml and nineteen 15 ml) were analyzed for temporal correlation between luminal CSA and impedance value due to the laborious nature of data analysis. Figures 1B, 2A and 2B show the temporal correlation between changes in esophageal impedance value, esophageal CSA measured by US image analysis and esophageal pressure recorded by manometry. These plots show that there is an initial rapid and large drop in impedance that corresponds with either the onset or a small increase in the luminal CSA, followed by a large increase in the luminal CSA during which there is an additional decrease in the impedance, albeit of small amplitude, small drop. Drop in impedance during large drop are significantly larger in amplitude (70–90 %) compared to the small drop (mean 18 %, range: 10–30 %) (Figures 1A, 2A and 2B). There was a statistically significant but weak correlation between the peak CSA and fall in total impedance (r = 0.48, p < 0.01). On the other hand, there were significant correlations between luminal CSA and impedance value during the entire period of swallow-induced distension and in all five subjects (mean r value ± SD = 0.80 ± 0.08, range from −0.94 to −0.66) (table 1) (Figures 2A and 2B).
Figure 2.
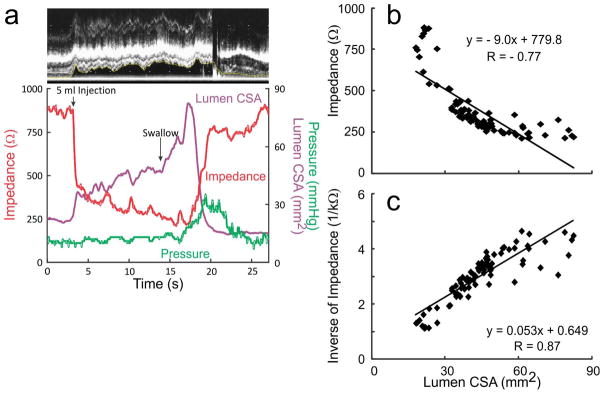
(A) (a) An example of temporal correlation between changes in the lumen CSA, impedance and pressure with a 5ml swallow. (b) It shows the correlation between changes in luminal CSA and changes in impedance during the entire distension period. (c) It shows the increased r value when inverse of impedance was plotted against the luminal CSA.
(B) (a) An example of record between the temporal correlation between changes in the lumen CSA, impedance and pressure during esophageal injection followed by a swallow. (b) Correlation between impedance strongly correlated with lumen CSA. (c) Correlation analysis between lumen CSA and inverse impedance with stronger r values compared to impedance.
Table 1.
Correlation coefficient values (mean ± SD and range) are tabulated between impedance and lumen CSA and inverse impedance and CSA for different swallow and injection volumes.
| Impedance vs CSA | Inverse of Impedance vs CSA | |||
|---|---|---|---|---|
| Mean ± SD | Range | Mean ± SD | Range | |
| 5 ml SW | −0.77 ± 0.06 | −0.84 to −0.68 | 0.86 ± 0.05 | 0.76 to 0.89 |
| 10 ml SW | −0.82 ± 0.07 | −0.88 to −0.72 | 0.88 ± 0.02 | 0.86 to 0.92 |
| 15 ml SW | −0.81 ± 0.10 | −0.94 to −0.72 | 0.90 ± 0.06 | 0.82 to 0.95 |
| 5 ml INJ | −0.75 ± 0.08 | −0.82 to −0.66 | 0.75 ± 0.12 | 0.63 to 0.87 |
| 10 ml INJ | −0.85 ± 0.03 | −0.88 to −0.82 | 0.88 ± 0.03 | 0.86 to 0.92 |
| 15 ml INJ | −0.82 ± 0.04 | −0.87 to −0.78 | 0.87 ± 0.03 | 0.83 to 0.91 |
CSA= cross sectional area; SW= swallow; INJ= injection.
The peak esophageal distension during swallow (peak CSA) was reasonably aligned with the nadir impedance, difference between the two (Δt) of ≤ 1 second during 63 % of instances. In the remainder Δt was between 1.0–1.5, 1.5–2.0 and 2.0–2.5 s in 17 %, 13 % and 7 % of the instances, respectively. Mean interval between peak esophageal CSA and nadir impedance for all sequences is 0.86 ± 0.09 s.
Effect of Bolus Volume on the Temporal Correlation between Esophageal Distension & Impedance
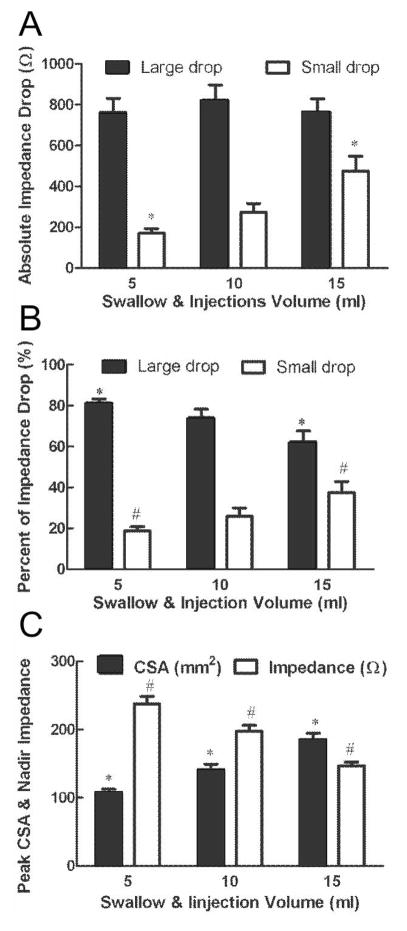
Temporal correlation between qualitative changes in impedance and esophageal CSA during esophageal bolus transport is not altered by changes in bolus volume. Quantitatively, mean amplitude of large drop in impedance is similar for varying bolus volumes but there is an increase in the amplitude of small drop with the increase in the bolus volumes (Figure 3A). The percent of large drop in impedance to the total drop in impedance decreased as the bolus volumes increased. On the other hand, the percent small drop impedance increased as the bolus volumes increased (Figure 3B).
Figure 3.
(A) Correlation between increase in volume and value of large and small drop in impedance. Large drop in impedance was not affected by increase in bolus volume. On the other hand, small drop increased with the increase in bolus volume (*p<0.01). (B) As bolus volume increased, the ratio of small drop to total drop increased and ratio of large drop to total drop decreased (*p=0.004, #p=0.004). (C) Mean peak CSA and nadir impedance value at different swallow and injection volumes. Peak CSA increased as swallows and injections volume increased. On the other hand, nadir impedance decreased with the increase in CSA.
Relationship between Peak Luminal CSA & Nadir Impedance
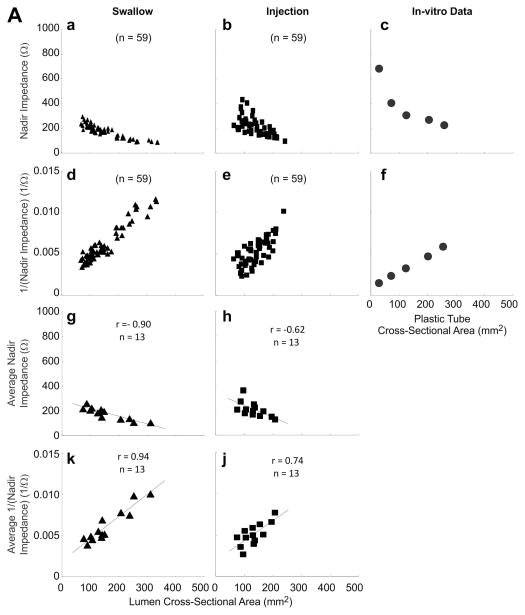
A total of 118 events (59 swallows and 59 injections, 38 events of 5 ml, 40 events of 10 ml and 40 events of 15 ml) were analyzed for correlation between peak luminal CSA and nadir impedance. Peak CSA and nadir impedance values were 145.0 ± 5.4 mm2 and 193 ± 6 Ω, respectively. Increase in peak CSA due to increase in bolus volume resulted in lower nadir impedance values (Figure 3C). An inverse relationship between nadir impedance and peak CSA (Figure 4A panels a, b, c, g and h) was observed with both, swallow and injection related esophageal distensions (r = −0.90 and −0.62 both p < 0.001 in panels g and h). Panels a, b, d and e show plot of all 59 swallows and 59 injections data points. Since there were different number of swallows and injections of each volume in different subjects, the average impedance and inverse of impedance was calculated so as to have only one mean value of each bolus volume from each subject. These 13 average values are plotted in panels; g, h, k and j. Regression analysis was only performed on data in later panels. Data in panels a, b, d and e are shown so as to appreciate the distribution of all of the raw data points.
Figure 4.
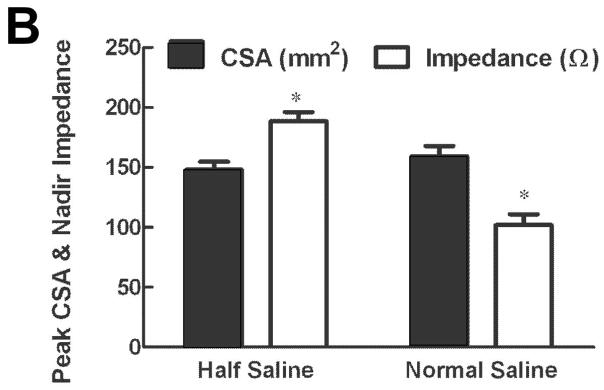
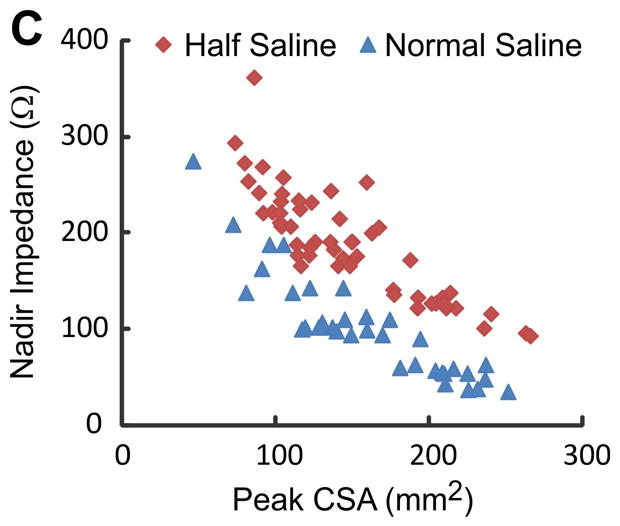
(A) Relationship between peak CSA, nadir impedance and inverse of impedance or conductance: First and third rows show the relationship with impedance (panels a, b, c, g and h) and second and fourth rows with conductance (panels d, e, f, k and j) for all of the swallows, injections and plastic tubes. Data points shown in triangles are from swallows, squares are from bolus injections and circles from the in-vitro experiments where impedance values were measured in plastic tubes of known dimensions. Note, that the r values are higher with conductance (inverse impedance) compared to impedance. (B) Mean peak CSA and nadir impedance value with two concentrations of saline. Note that the peak CSA was not different but the nadir impedance values are smaller with the 1N saline compared to 0.5 N saline (*p<0.001). (C) Graph shows the scatter plot of peak luminal CSA and nadir impedance value with half saline and normal saline group. Nadir impedance values were significantly lower in normal saline group without difference in peak CSA value between both groups.
Figure 4A panels d, e, f, k and j show the relationship between inverse of impedance and CSA. It reveals that there is a better correlation between inverse impedance and CSA compared to CSA and impedance. Also shown in these figures is the data obtained from in-vitro experiments where impedance was measured in plastic tubes of known CSA filled with 0.5 N saline (panels c and f). It shows that in-vivo nadir impedance values for the comparable CSA are slightly larger than the in-vitro measurements (Figure 4A panels a, b, g and h are higher than data in panel c).
Effect of Electrolyte Concentration on Nadir Impedance
Total of 90 events in two subjects (54 with 0.5 N saline and 36 with 1 N saline) were analyzed to compare peak CSA and nadir impedance with two concentrations of saline. There was no significant difference in peak CSA between the two saline concentrations (Mean: 148 ± 7 mm2 and 159 ± 9 mm2, respectively). However, nadir impedance is lower value with the 1 N saline compared with 0.5 N saline (average 102 ± 9 and 188 ± 7 Ω, respectively) (Figure 4B and 4C).
DISCUSSION
In summary, our data shows the following: 1) during swallow-induced primary peristalsis and esophageal-distension induced by direct injection of bolus into the esophagus, the major drop in impedance occurs with a small increase in the luminal CSA. On the other hand, large increase in the luminal CSA causes only a small drop in the esophageal impedance. 2) Peak esophageal distension occurs in close temporal correlation with nadir impedance. 3) A higher esophageal CSA correlates with the lower nadir impedance values and there is an inverse but linear correlation between the nadir impedance and the peak CSA. 4) We found a stronger correlation between the inverse of impedance (conductance) and luminal CSA than between impedance and luminal CSA. These observations suggest that impedance measurement may be a relatively simple technique to measure the luminal distension during esophageal bolus transport in healthy subjects.
Original studies by Silny (1, 2) and Sifrim (3) investigated the correlation between changes in impedance during esophageal bolus transport in humans and cats using fluoroscopy. They observed that arrival of the bolus head on the impedance electrodes coincided with the onset of drop in impedance, and nadir impedance corresponds with maximal or peak distension during the passage of bolus. Omari et al also used fluoroscopy to determine changes in impedance and upper esophageal sphincter opening in humans and observed that bolus head arrival correlates with a drop in esophageal impedance (10). Limitation of single plane fluoroscopy is, as was the case in Sifrim (3) and Omari (10) studies, that one can’t quantitate the esophageal CSA in fluoroscopic images. Furthermore, detection of bolus head on fluoroscopic images is subjective and may not allow precise determination of the arrival time on to impedance electrodes. In an earlier study, we found that single plane fluoroscopy does not detect changes in the esophageal CSA/distension accurately during peristalsis (11).
Esophageal US imaging is ideally suited to measure the luminal CSA at a rapid rate (30 Hz) and in earlier reported studies we used it to measure esophageal distension during bolus transport in the esophagus and GER events (12, 13). In the current study, we found that impedance drop during bolus transport occurs as a two-step process, a large drop that occurs at the onset of esophageal distension and a small drop that correlates with the increase in the CSA. The peak CSA coincides with the nadir impedance. We suspect that the large drop in impedance is due to the initial arrival of saline or a very small volume of bolus on the two impedance electrodes, and small drop is related to esophageal distension. Ours is the first study that describes two phases of impedance drop during distension and an inverse but linear correlation between changes in impedance and esophageal CSA. We propose small drop in impedance is really a marker of the degree of esophageal distension during bolus transport. All of the previously reported studies assumed that the esophageal bolus shape is that of a tear drop with a clubbed distal end (largest diameter with biggest CSA) that tapers to a gradually narrow proximal end (6) (Figures 1B & 2A). However, based on the US images it is clear that bolus travels in the esophagus in the shape of an “American football” with narrow regions at cranial and caudal ends with a maximal diameter in the middle of the bolus. Figure 1B, clearly shows the shape of bolus at a given location and its relationship with the changes in impedance. The narrow distal end of bolus causes a large drop or the major drop in impedance that is followed by a slow small drop in impedance during actual esophageal distension; and the peak CSA is closely aligned with the nadir impedance. Our study is in close agreement with a recent study by Costa et al who found a close correlation between distension measured by video imaging and MII in an ex-vivo model of peristaltic reflex (14) in the guinea pig colon.
Based on electrical engineering principles, one would expect that peak CSA should temporally correlate with the nadir impedance value. During 2/3rd of instances the time lag between the peak CSA and nadir impedance was less than one second. However, in significant minority there was disassociation between the two, ranging from 1–2.5 seconds. The lack of precise temporal alignment between peak CSA and nadir impedance may be due to several reasons; 1) Impedance was measured from two electrodes located 1.6 cm apart, (average impedance over a 1.6 cm length of the esophagus) but US image records CSA at a single level of the esophagus. 2) M-mode US image was measured based on 16 points around the esophageal perimeter, which are not continuous point. Therefore, it reflected a close approximation to the CSA but not an exact measure. 3) At times air artifact made it difficult to find the precise nadir impedance point.
Using US imaging at two different locations in the esophagus, we found that esophageal distension during swallow-induced bolus transport is an important marker of the inhibitory phase of the peristaltic reflex (11). Measuring esophageal distension with US image analysis is expensive (equipment and labor cost) and data analysis are time consuming. Furthermore, with one US transducer one can only measure distension at one location in the esophagus. On the other hand, impedance measurements are relatively inexpensive and can be performed at closely spaced intervals over the entire length of the esophagus at the same time. We believe that MII measurements can detect changes in the esophageal CSA fairly accurately and may provide useful information on the inhibitory phase of peristaltic reflex. Studies show that patients with spastic motor disorder of the esophagus have impaired inhibitory innervation as measured by impaired relaxation of the artificial high-pressure zone (15, 16). However, those studies have only been performed in a limited number of patients as they are not practical. On the other hand, MII measurements can be easily performed in the routine clinical setting along with the HRM. The catheters, hardware and software for conducting these studies are already available through several companies (GIVEN Imaging, Sandhill Scientific and Medical Measurement System). We suggest that future studies should investigate if lack of or impaired esophageal distension during peristalsis is the cause of unexplained dysphagia (also known as functional dysphagia). Along these lines, Omari et al have observed an inverse correlation between the diameter of upper esophageal sphincter and nadir impedance in patients with swallowing disorders related to poor opening of the upper esophageal sphincter (9). Meyers and Omari have also developed a computer algorithm to predict patients undergoing fundoplication who may develop dysphagia following surgery (17). Nadir impedance value during swallow-induced bolus transport in the esophagus is an important variable in their algorithm. Our data shows that conductance, i.e., inverse of impedance correlates better with the CSA than the impedance. Latter is expected based on the impedance equation, which is same as the resistance and is equal to distance between the electrodes multiplied by resistivity of the conducting medium between the electrodes and divided by cross sectional area of the conductive medium.
In summary, our study shows that impedance measurements provide good estimates of esophageal distension during peristalsis. Since esophageal distension may be an important marker of the inhibition phase of the peristaltic reflex (11), simultaneous HRM and impedance measurement can provide information on contraction and relaxation phases of the esophageal peristaltic reflex. Furthermore, it may allow one to investigate if reduced distensibility of the esophagus during bolus transport plays an important role in the genesis of esophageal dysphagia.
Acknowledgments
Financial Support: This work was supported by a NIH Grant DK060733& the Inje Research and Scholarship Foundation in 2012
Footnotes
Conflict of Interest: None of the authors have any conflict of interest.
Author Contributions:
JHK: Experimental design, data acquisition & analysis, manuscript writing
RKM: Conceived the project, designed experiments, data acquisition, data analysis and manuscript writing
NP: Data acquisition and analysis
ML: Data acquisition
VB: Method development, data analysis, figures creation, manuscript writing
References
- 1.Silny J. Intraluminal multiple electric impedance procedure for measurement of gastrointestinal motility. Neurogastroenterol Motil. 1991;3:151–162. [Google Scholar]
- 2.Nguyen HN, Silny J, Albers D, et al. Dynamics of esophageal bolus transport in healthy subjects studied using multiple intraluminal impedancometry. Am J Physiol. 1997;273:G958–964. doi: 10.1152/ajpgi.1997.273.4.G958. [DOI] [PubMed] [Google Scholar]
- 3.Sifrim D, Silny J, Holloway RH, Janssens JJ. Patterns of gas and liquid reflux during transient lower oesophageal sphincter relaxation: a study using intraluminal electrical impedance. Gut. 1999;44:47–54. doi: 10.1136/gut.44.1.47. [DOI] [PMC free article] [PubMed] [Google Scholar]
- 4.Simren M, Silny J, Holloway R, Tack J, Janssens J, Sifrim D. Relevance of ineffective oesophageal motility during oesophageal acid clearance. Gut. 2003;52:784–790. doi: 10.1136/gut.52.6.784. [DOI] [PMC free article] [PubMed] [Google Scholar]
- 5.Sifrim D, Castell D, Dent J, Kahrilas PJ. Gastro-oesophageal reflux monitoring: review and consensus report on detection and definitions of acid, non-acid, and gas reflux. Gut. 2004;53:1024–1031. doi: 10.1136/gut.2003.033290. [DOI] [PMC free article] [PubMed] [Google Scholar]
- 6.Mittal RK, Padda B, Bhalla V, Bhargava V, Liu J. Synchrony between circular and longitudinal muscle contractions during peristalsis in normal subjects. Am J Physiol Gastrointest Liver Physiol. 2006;290:G431–438. doi: 10.1152/ajpgi.00237.2005. [DOI] [PubMed] [Google Scholar]
- 7.Gregersen H, Djurhuus JC. Impedance planimetry: a new approach to biomechanical intestinal wall properties. Dig Dis. 1991;9:332–340. doi: 10.1159/000171320. [DOI] [PubMed] [Google Scholar]
- 8.McMahon BP, Frokjaer JB, Liao D, Kunwald P, Drewes AM, Gregersen H. A new technique for evaluating sphincter function in visceral organs: application of the functional lumen imaging probe (FLIP) for the evaluation of the oesophago-gastric junction. Physiol Meas. 2005;26:823–836. doi: 10.1088/0967-3334/26/5/019. [DOI] [PubMed] [Google Scholar]
- 9.Omari TI, Ferris L, Dejaeger E, Tack J, Vanbeckevoort D, Rommel N. Upper esophageal sphincter impedance as a marker of sphincter opening diameter. Am J Physiol Gastrointest Liver Physiol. 2012;302:G909–913. doi: 10.1152/ajpgi.00473.2011. [DOI] [PubMed] [Google Scholar]
- 10.Omari TI, Rommel N, Szczesniak MM, et al. Assessment of intraluminal impedance for the detection of pharyngeal bolus flow during swallowing in healthy adults. Am J Physiol Gastrointest Liver Physiol. 2006;290:G183–188. doi: 10.1152/ajpgi.00011.2005. [DOI] [PubMed] [Google Scholar]
- 11.Abrahao L, Jr, Bhargava V, Babaei A, Ho A, Mittal RK. Swallow induces a peristaltic wave of distension that marches in front of the peristaltic wave of contraction. Neurogastroenterol Motil. 2011;23:201–207. e110. doi: 10.1111/j.1365-2982.2010.01624.x. [DOI] [PubMed] [Google Scholar]
- 12.Tipnis NA, Rhee PL, Mittal RK. Distension during gastroesophageal reflux: effects of acid inhibition and correlation with symptoms. Am J Physiol Gastrointest Liver Physiol. 2007;293:G469–474. doi: 10.1152/ajpgi.00019.2007. [DOI] [PubMed] [Google Scholar]
- 13.Rhee PL, Liu J, Puckett JL, Mittal RK. Measuring esophageal distension by high-frequency intraluminal ultrasound probe. Am J Physiol Gastrointest Liver Physiol. 2002;283:G886–892. doi: 10.1152/ajpgi.00107.2002. [DOI] [PubMed] [Google Scholar]
- 14.Costa M, Wiklendt L, Arkwright JW, et al. An experimental method to identify neurogenic and myogenic active mechanical states of intestinal motility. Front Syst Neurosci. 2013;7:7. doi: 10.3389/fnsys.2013.00007. [DOI] [PMC free article] [PubMed] [Google Scholar]
- 15.Sifrim D, Janssens J, Vantrappen G. Failing deglutitive inhibition in primary esophageal motility disorders. Gastroenterology. 1994;106:875–882. doi: 10.1016/0016-5085(94)90745-5. [DOI] [PubMed] [Google Scholar]
- 16.Sifrim D, Jafari J. Deglutitive inhibition, latency between swallow and esophageal contractions and primary esophageal motor disorders. J Neurogastroenterol Motil. 2012;18:6–12. doi: 10.5056/jnm.2012.18.1.6. [DOI] [PMC free article] [PubMed] [Google Scholar]
- 17.Myers JC, Nguyen NQ, Jamieson GG, et al. Susceptibility to dysphagia after fundoplication revealed by novel automated impedance manometry analysis. Neurogastroenterol Motil. 2012;24:812–e393. doi: 10.1111/j.1365-2982.2012.01938.x. [DOI] [PubMed] [Google Scholar]


