Abstract
Tissue displacements required for mechanical property reconstruction in magnetic resonance elastography (MRE) are acquired in a magnetic resonance imaging (MRI) scanner, therefore, anatomical information is available from other imaging sequences. Despite its availability, few attempts to incorporate prior spatial information in the MRE reconstruction process have been reported. This paper implements and evaluates soft prior regularization (SPR), through which homogeneity in predefined spatial regions is enforced by a penalty term in a nonlinear inversion strategy. Phantom experiments and simulations show that when predefined regions are spatially accurate, recovered property values are stable for SPR weighting factors spanning several orders of magnitude, whereas inaccurate segmentation results in bias in the reconstructed properties that can be mitigated through proper choice of regularization weighting. The method was evaluated in vivo by estimating viscoelastic mechanical properties of frontal lobe gray and white matter for five repeated scans of a healthy volunteer. Segmentations of each tissue type were generated using automated software, and statistically significant differences between frontal lobe gray and white matter were found for both the storage modulus and loss modulus (p < 10−6). Provided homogeneous property assumptions are reasonable, SPR produces accurate quantitative property estimates for tissue structures which are finer than the resolution currently achievable with fully distributed MRE.
Keywords: Brain, magnetic resonance elastography (MRE), nonlinear inversion, soft prior
I. Introduction
Magnetic resonance elastography (MRE) is an emerging quantitative imaging modality which estimates the distribution of tissue mechanical properties in vivo [1]. Considerable success has been reported for liver, where estimates of the average storage modulus have successfully predicted the stage of hepatic fibrosis [2]–[5]. MRE has also been applied to breast [6], [7], brain [8]–[12], muscle [13], [14], and the soft palate [15]. Although MRE is capable of capturing spatially heterogeneous material properties, the in vivo spatial resolution achieved to date has been limited. As a result, average values of properties over large regions of tissue have been reported in nearly all in vivo studies published in the current literature. Bulk averages of MRE brain tissue properties have shown promise in detecting diffuse neurological conditions such as hydrocephalus [16], multiple sclerosis [17], and Alzheimer's disease [18]. While MRE has been successful in detecting focal lesions in some applications, quantitative accuracy of the stiffness measures is less certain [9], [19]. Techniques which improve the accuracy of local property estimates will serve to increase the sensitivity of diagnostic criteria based on mechanical properties, as demonstrated by studies on breast cancer [6], [7] and meningiomas [20].
Noise in the displacement measurements, modelling inconsistencies and MR artifacts contribute to errors in the estimated properties which reduce the utility of the property images. Methods to mitigate these negative effects are available, for example, more sophisticated mechanical models [21], [22] may reduce the modelling mismatch, and filtering techniques can suppress the effect of noise [23]. Other approaches involve reducing the degrees-of-freedom in the inverse problem [24], [25] or applying additional constraints through regularization [26], [27]. One type of regularization not yet explored by the majority of MRE inversions is incorporation of spatial priors in the material property estimation process. Since MRE motion data is collected in a magnetic resonance imaging (MRI) scanner, a wealth of additional imaging sequences and contrast mechanisms are available to identify anatomical features that can be incorporated in the MRE inversion.
A form of spatial prior has been investigated in ultrasound elastography where a generalized Tikhonov regularization scheme was implemented to favor mechanical property solutions which were close to an assumed distribution generated from B-mode or strain images [28], [29]. These methods required a priori estimates of the property values, which were generated from known tissue properties and relative strain levels. The properties of gelatin phantoms estimated with the generalized Tikhonov approach were more accurate compared to estimates when no spatial information was supplied [28]. A disadvantage of this approach to supplying spatial information is that assumed property values can bias the results, and if accurate properties are already available, the reason to use elastography is diminished.
Another approach to supplying spatial information is known as “hard priors,” where a number of predefined regions are assigned a single uniform material property value [29]. A priori quantitative property information is not required, and the stability and speed of the parameter estimation improves because the number of unknowns in the inverse problem is decreased. However, segmentation errors can be problematic because constant regional properties are strictly enforced. Intra-vascular ultrasound elastography using hard priors based on deformable curves has been proposed to mitigate segmentation errors [30], though geometrical constraints such as nonintersecting boundaries can be difficult to enforce in regions of irregular shape.
Other model based imaging modalities have reported success using a soft prior regularization (SPR) technique which favors constant material properties within predefined spatial regions without requiring initial quantitative estimates of property values [31]–[34]. Thus, these methods are not influenced by the initial property estimates (provided values are sufficiently close to truth to achieve convergence), avoiding the potential bias from assumed property values. However, bias occurs when regions are incorrectly segmented and force tissues with heterogeneous properties to be homogeneous, although the effect is probably similar to the spatial averaging of properties over larger regions commonly performed in MRE [35], and judicious selection of the SPR weighting can allow the algorithm to adjust for segmentation errors. Further, not all material property estimates need to be associated with a region, and values within structures where homogeneous properties are not expected can remain fully distributed.
This work implements and evaluates the SPR technique described by Golnabi et al. [31] for nonlinear inversion (NLI) MRE. Simulated data is used to show that SPR improves quantitative accuracy of property estimates of finely detailed structures, and the effect of the weighting factor and missegmentation is investigated in phantoms. Some initial in vivo results are also presented for segmentations of gray and white matter of the frontal lobe.
A. Methods
1) Nonlinear Inversion MRE
Nonlinear inversion (NLI) techniques minimize an objective function that quantifies the difference between the measured displacements and a computational model of the tissue by updating an estimate of the mechanical property distribution. Applying SPR adds a term to the objective function which penalizes mechanical property variation within previously defined spatial regions that are presumed to be homogeneous. The subzone method [36] is used to reduce the significant computational load of the iterative solution of large 3-D problems, where the problem is divided into smaller partitions (subzones) which are processed in parallel. The global property distribution solution is then constructed from the union of all subzone estimates.
The objective function which is minimized on each subzone is given by
| (1) |
Here, the first term quantifies the displacement error, in which Nm is the number of measurements and um(k) denotes the complex-valued harmonic amplitude of the kth displacement measurement. uc(k)(θ) is the displacement sampled at measurement point k from a computational model with a given mechanical property distribution, θ [25], and | ... | denotes the absolute value of a complex-valued number. A finite element implementation of the heterogeneous viscoelastic form of the time-harmonic Navier's equation is used to calculate uc(θ)
| (2) |
where μ is the complex-valued viscoelastic shear modulus (μ = μs + iμl), λ is the second Lamé parameter (assumed to be real-valued), ρ is the density, ω is the excitation frequency, T represents tensor transposition, and is the complex-valued harmonic displacement amplitude. A large value of λ is used together with a stabilized incompressible finite element solution of (2) to model a nearly incompressible material [37], and ρ is held constant at the density of water. The viscoelastic model used in this work reconstructs the storage modulus, μs, and loss modulus, μl, so for ns unknown μs values and nl unknown μlvalues, θ is a vector of length ns + nlgiven by
| (3) |
which represents multiple mechanical property parameters that can be expressed with differing spatial resolutions [25]. The level of attenuation in a viscoelastic material can be quantified through the damping ratio, ξ
| (4) |
A value ξ < 1 of results in an oscillatory decay response to a step input, whereas ξ > 1 leads to a decay without oscillation [38].
The second term in (1) penalizes variation within prescribed regions. αsp is a scalar weighting factor (referred to as the SPR weighting), and (L) is a soft prior matrix generated using a predefined segmentation identifying specific features. For a given segmentation, a material property point, i, is assigned to a region Ri. If Ri = 0, the material property point is not associated with any region and remains fully distributed. The number of material property points in region, Ri, is denoted by N(Ri). (L) is then defined as
| (5) |
where Ls and Ll are ns × ns and nl × nl submatrices, respectively. Each row and column position is associated with a corresponding material property point, terms are defined by
| (6) |
This approach allows different segmentations or different discretizations for each property parameter [25]. In this work, μs and μl were treated the same, therefore, Ls = Ll. The third condition in (6) differs slightly from Golnabi [31]: the denominator of the L term is N(Ri) – 1 so that the soft prior term in (1) is zero when all regions have constant properties.
Equation (1) is minimized on each subzone separately using the L-BFGS-B Quasi–Newton implementation [39], [40]; therefore, constant material properties inside a region are only enforced on the subzone level. Inter-subzone variation of a region is not penalized; hence, property variation at the scale of the subzones (usually ~ 25 mm) is possible which provides a degree of protection against missegmentation or low frequency spatial variation of properties within a region. A truly mechanically homogenous region reconstructed using NLI with SPR should exhibit little property variation over multiple subzones.
Spatial filtering (SF) is required to stabilize the progress of the iterative reconstruction [36]. The SF approach adopted for SPR involves convolution with a Gaussian smoothing kernel after every iteration, so that the spatially filtered material property, θsf(i), is calculated using
| (7) |
where σ is the width of the Gaussian filter, rj is the Euclidean distance of point j from point i, Nn is the number of material property points meeting neighborhood criteria, and . The neighborhood criteria include material property points meeting the conditions
| (8) |
which ensures region boundaries are not blurred by the smoothing operation, but retains the stabilization of points not assigned to a region. SPR with all material property points assigned to simple regions has a very strong regularization effect which renders SF unnecessary; however, SPR segmentations where fine details are present or when some material property points are included in region 0, still benefit from SF.
2) Simulated Brain Data
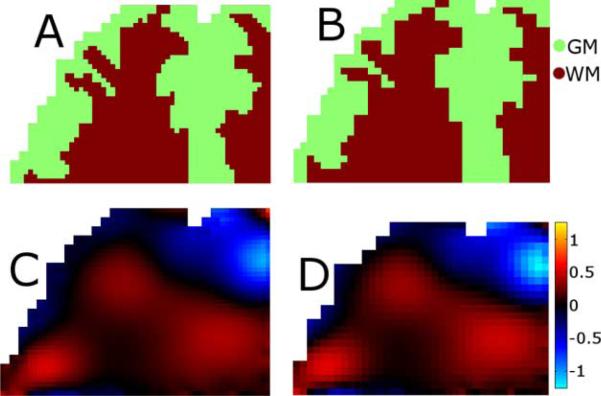
The utility of SPR for accurate estimation of the mechanical properties of fine tissue structures was demonstrated using a simulation of human brain tissue. A segmentation of gray and white matter from an anatomical MRI scan was used to create a high resolution (1.3 mm) 3-D finite element model (27 node quadratic hexahedral elements) of one quadrant of a human brain, allowing the incorporation of sharp discontinuities in mechanical properties resulting from the mesh definition of finely-detailed gray/white matter boundaries. Exterior brain surfaces were modeled as stress free whereas BCs on surfaces which cut through the brain were generated by interpolating the in vivo MRE displacement measurements. The tissue was modeled as a nearly incompressible viscoelastic solid (2), mechanical properties were assigned as μ = 2.2 + 2.2i kPa for gray matter and μ = 2.8 + 2.2i kPa for white matter with a large value for λ such that the Poisson's ratio was 0.4999. Tissue density of 1000 kgm−3 and an actuation frequency of 50 Hz were used to match in vivo conditions. MRE measurement of tissue displacements was simulated by sampling the high resolution displacement field at a 2 mm isotropic resolution with the addition of various levels of Gaussian noise. Nearest neighbor interpolation of the high resolution property distribution provided the MR-based tissue segmentations for SPR. Fig. 1 shows an example slice of the high resolution mechanical property and displacement fields, as well as the corresponding 2 mm sampling of these distributions. MRE reconstructions were performed with and without SPR under simulated displacement noise levels between 0% and 10%, and the recovered mechanical property values for each tissue class were compared to the true values assigned in the simulation.
Fig. 1.
Example slice of the 3-D simulated brain experiment. The 1.3 mm resolution gray (GM) and white matter (WM) distribution in A was used to generate a high resolution displacement field, one component of which is shown in C. High-resolution field was then sampled at 2 mm to simulate MRE data acquisition, the resulting gray and white matter segmentation is shown in B, and the MRE displacement field in D. Finite element meshing process does not allow elements to extend outside the mask and results in some erosion of the boundaries.
3) Data Collection
A phantom was constructed from a 100 × 75 × 40 mm block of Mori-nu soft silken tofu (Morinaga, Torrance, CA, USA), with two 19 mm cylindrical porcine skin gelatin inclusions (type A, 300 bloom, Sigma-Aldrich; St. Louis, MO, USA). The upper and lower inclusions used 5% and 10% gelatin concentrations by weight, respectively. The phantom was harmonically actuated at 100 Hz, and MRE motion data was collected using a Philips 3T Achieva scanner (Philips Medical Systems, Best, The Netherlands) with a single-shot, spin-echo echo-planar imaging sequence with added motion sensitizing gradients [41]. A 64 × 64 data matrix was acquired over a 128 mm field-of-view, and eighteen 1.8 mm slices were sampled with a 0.2 mm gap. All three motion components were measured with eight equally spaced phase offsets over a period of the time-harmonic motion.
Six repeat MRE examinations of a healthy 24-year-old male volunteer were performed on a Siemens 3T Allegra scanner (Siemens Medical Solutions; Erlangen, Germany). Three-dimensional, full-vector field displacement data at 50 Hz was acquired using a multi-shot, variable-density spiral imaging sequence. The resulting displacement data had an isotropic 2 × 2 × 2 mm3 spatial resolution, and the full acquisition details are found in Johnson et al. [9]. Additionally, a T1-weighted anatomical MPRAGE scan was acquired for registration and segmentation. Scan 5 was discarded because the octahedral shear strain SNR did not meet a signal quality threshold of 3.0 [42].
4) Phantom Validation
The background and each inclusion of the phantom were manually segmented from the MR magnitude images and supplied to the SPR mechanical property reconstruction algorithm. Values of αsp ranging from 10−13 to 10−9 were used to investigate the sensitivity of the reconstruction to the regularization weighting. All other forms of regularization commonly employed in NLI (including spatial filtering [36] and total variation minimization [26]) were disabled to isolate the effect of SPR in the phantom experiments. A fully distributed reconstruction using αsp with a spatial filter width of σ = 1.5 mm and total variation minimization weighting of 5 × 10⁻¹⁶ was also performed for comparison.
The phantom was then deliberately segmented incorrectly to investigate the impact of segmentation errors. Half of the lower 10% gelatin inclusion was included in the region corresponding to the tofu background, and a false segmentation was added to the background region. Mechanical property reconstructions with αsp ranging from 10−13 to 10−9 were performed to explore the bias introduced by segmentation errors.
Fig. 2 shows a representative slice of the phantom MR magnitude image along with correct and incorrect segmentations used in each of the phantom experiments. The low MR signal intensity in the inclusion is not representative of its true size; pouring of the warm liquid gel into the tofu to form the inclusions resulted in higher MR signal around the boundary. The segmentation used the true size of the inclusion, which is visible as a brighter ring on the MR magnitude image in Fig. 2.
Fig. 2.
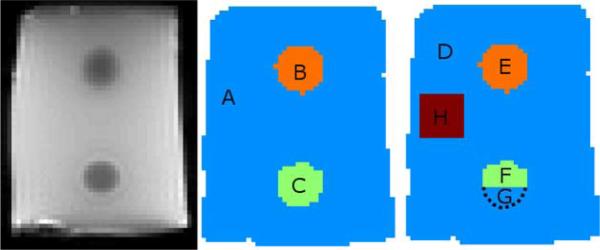
MR magnitude image of the phantom (left) with the correct (center) and incorrect (right) segmentation. Background is silken soft tofu, the upper inclusion is 5% gelatin, and the lower inclusion is 10% gelatin. Each region utilized by the SPR is indicated by a different color, and regions where average property values are reported are designated with letters. Region G is the portion of the lower inclusion that is incorrectly included as part of the background. Region H is a false segmentation of the background.
Segmentation errors can result in regions which are too large or too small. The segmentation of the 10% gelatin inclusion was eroded and dilated using a variety of kernels to produce a series of inclusion size segmentations ranging from 23% to 217% of the true inclusion volume, and the resulting mechanical property estimates from SPR with αsp = 10−10 were plotted.
5) Application to Brain
Commonly, results reported in brain MRE involve averaging of properties over the entire brain [8] or over gray and white matter separately after segmentation [43], effectively treating these regions as homogeneous. However, the brain has a complicated mechanical structure including fluid-filled ventricles, finely detailed gray/white matter boundaries, and anisotropic white matter tracts such as the corpus callosum and corona radiata. Different regions and structures of the cerebrum have been shown to exhibit distinct mechanical properties [44], [45]; using SPR on large classes of tissue such as gray and white matter may not be appropriate because some property inhomogeneity within each class is expected. To evaluate SPR, we have isolated the frontal lobe where gray and white matter regions are expected to be more homogeneous [46].
Segmentation was performed using T1-weighted anatomical images with FSL (FMRIB www.fmrib.ox.ac.uk/fsl, [47]). Images were skull-stripped with the BET tool [48], and then gray matter, white matter, and cerebrospinal fluid were segmented using the FAST tool [49]. The ICBM-152 template was registered to the T1-weighted images using the FLIRT tool [50] for segmentation of the frontal lobe through the MNI structural atlas [51]. T1-weighted images were registered to the magnitude images of each MRE dataset using FLIRT, and masks for each tissue type were created with a partial volume threshold of 0.5. Application of this transform also registered the MNI atlas to the individual mechanical property maps, where the frontal lobe for each dataset was segmented with a 0.5 probability threshold.
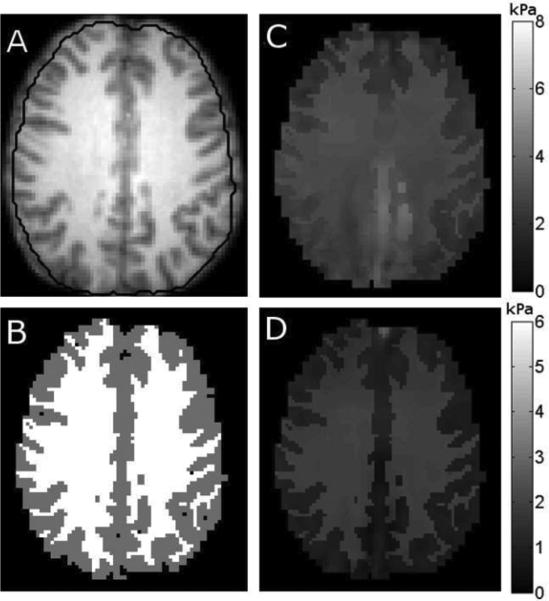
A reconstruction using SPR with all of the cortical gray and white matter assigned to regions was performed to illustrate the negative effect of heterogeneous properties associated with the same region. Each of the five repeated brain datasets was also reconstructed using SPR with the frontal lobe gray and white matter assigned to regions, and the rest of the brain included in region 0 (no SPR). Values αsp of between 10−12 and 10−9 produced similar regional property estimates. A value of 10−10 was selected for the brain studies in this paper based on the phantom experiments and visual inspection of the mechanical property images. Regional descriptions with complex boundaries such as gray and white matter benefit from spatial filtering, all brain reconstructions used a spatial filter width of σ = 1.5 mm and no total variation minimization. The repeatability of the recovered regional mechanical properties for multiple scans of the same subject was determined for SPR and compared to fully distributed reconstructions (no SPR).
B. Results
1) Simulation Results
Fig. 3 presents recovered property images from the simulation experiment shown in Fig. 1, and demonstrates that SPR preserves sharp discontinuities in mechanical properties, and achieves accurate recovery of mechanical properties of fine tissue structures. The improved contrast recovery is illustrated by the plots in Fig. 4; blurring of the tissue boundaries results in a loss of contrast when SPR is not utilized.
Fig. 3.
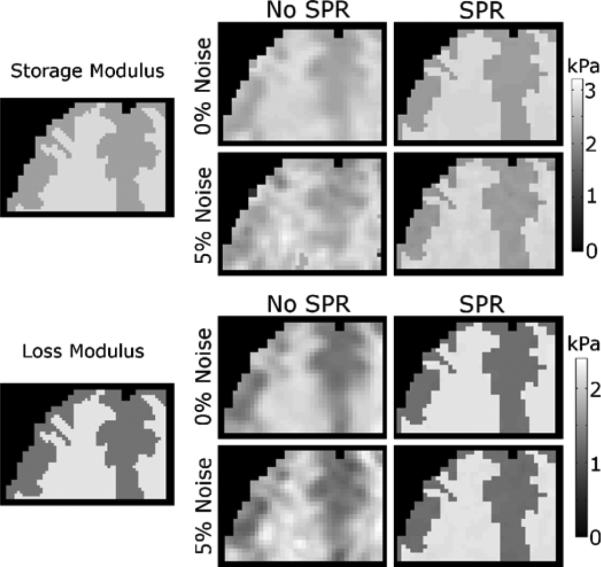
Representative slice of MRE reconstructions with simulated data (see Fig. 1). Left column of images shows the high resolution property distribution used to generate the simulated displacement data. Other columns show reconstructions without SPR (center) and with SPR (right). Images computed from displacement data with 0% and 5% added noise are shown for the storage modulus (upper images) and loss modulus (lower images).
Fig. 4.
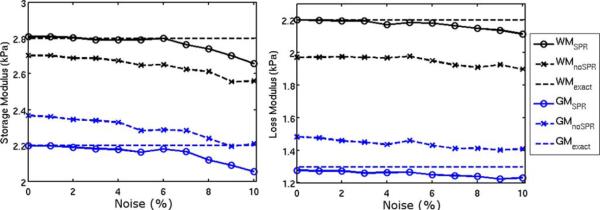
Recovered storage and loss modulus values as a function of simulated MR measurement noise (mean values over each region). True property values used to generate the simulated displacements are indicated by dotted lines.
2) Phantom Results
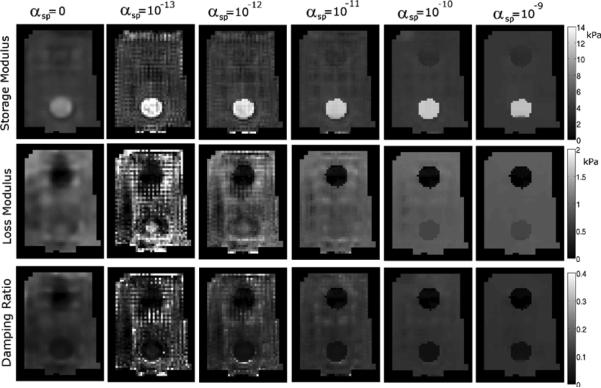
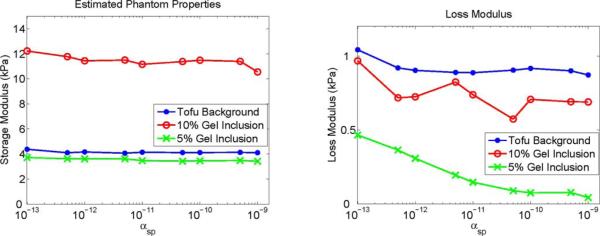
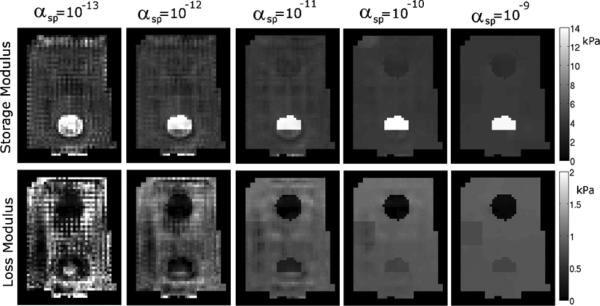
A representative slice of the recovered mechanical properties of the phantom using the correct SPR segmentation is shown in Fig. 5 for a range of αsp values, and Fig. 6 plots the mean estimated properties for each phantom material as a function of αsp, illustrating that the soft prior storage modulus is not sensitive to the SPR weighting. The loss moduli of the inclusions varies with αsp; low μl values in gelatin are typically difficult to accurately recover because of limited sensitivity. Fig. 7 presents a similar series of mechanical property images using the incorrect segmentation shown in Fig. 2—the upper half of the inclusion is defined as its own region while the lower half is included in the background. Fig. 8(a) compares the estimated property values of the 10% gelatin inclusion generated using SPR with and without segmentation errors. Mean values of the upper and lower halves of the inclusion are plotted. Fig. 7 and the left plot in Fig. 8 illustrate that careful choice of αsp values allows the algorithm to correct for segmentation errors (although some bias still remains). A more quantitative illustration of bias produced by segmentation errors is shown in the right plot of Fig. 8, where the recovered mechanical properties of the 10% gelatin inclusion are given as a function of the ratio of the segmented and true inclusion sizes. Tables I and II present the mechanical property values of the phantom regions indicated in Fig. 2 for a range of αsp values between 0 and 10−9.
Fig. 5.
Representative slice of the recovered properties from a tofu phantom with an accurate SPR segmentation. Each column shows results generated with the indicated value of αsp. At low αsp values the property solutions become noisy due to insufficient regularization because spatial filtering and total variation minimization are disabled in these cases. When αsp = 0, standard spatial filtering and total variation minimization weights were used.
Fig. 6.
Property values of each phantom material using SPR with the correct segmentation as a function of αsp.
Fig. 7.
Representative slice of the recovered properties from a tofu phantom with errors in the SPR segmentation (see Fig. 2). Each column shows results generated with the value of αsp indicated.
Fig. 8.

Plots illustrating the effect of segmentation errors on recovered properties. Left: Mean properties of the 10% gelatin inclusion as a function of αsp. The “full segmentation,” “half segmentation: correct,” and “half segmentation: missed” labels correspond to regions A, F, and G, respectively, in Fig. 2. Right: Effect of segmentation size errors on the estimated properties of the 10% gel inclusion with SPR. The recovered inclusion storage and loss moduli are given on the left and right axes, respectively, and the relative inclusion size is the ratio of the segmented inclusion volume to the true volume.
TABLE I.
Reconstructed Storage Modulus of a Tofu/Gelatin Phantom. Columns Correspond to the Mean Values for the Regions Indicated in Fig. 2. Values Listed in the First Row (αsp = 0) Use Spatial Filtering and Total Variation Minimization for Stability. All Other Rows Use Only SPR With the Specified αsp Value
| Storage Modulus Values (kPa) | ||||||||
|---|---|---|---|---|---|---|---|---|
| α sp | A | B | C | D | E | F | G | H |
| 0* | 4.10 | 3.64 | 7.34 | 4.17 | 3.64 | 7.63 | 6.88 | 3.94 |
| 1e-13 | 4.37 | 3.70 | 12.22 | 4.49 | 3.71 | 13.63 | 7.71 | 4.07 |
| 1e-12 | 4.16 | 3.60 | 11.44 | 4.22 | 3.60 | 13.54 | 5.69 | 3.95 |
| 1e-11 | 4.13 | 3.40 | 11.15 | 4.16 | 3.46 | 13.60 | 4.87 | 3.85 |
| 1e-10 | 4.11 | 3.45 | 11.49 | 4.14 | 3.44 | 14.57 | 4.48 | 3.86 |
| 1e-09 | 4.10 | 3.41 | 10.55 | 4.13 | 3.40 | 13.71 | 4.34 | 3.86 |
TABLE II.
Reconstructed Loss Modulus of a Tofu/Gelatin Phantom.Columns Correspond to the Mean Values for the Regions Indicated in Fig. 2. Values Listed in the First Row (αsp = 0) Use Spatial Filtering and Total Variation Minimization for Stability.All Other Rows Use Only SPR With the Specified αsp Value
| Loss Modulus Values (kPa) | ||||||||
|---|---|---|---|---|---|---|---|---|
| α sp | A | B | C | D | E | F | G | H |
| 0* | 0.88 | 0.39 | 0.67 | 0.88 | 0.39 | 0.65 | 0.72 | 0.80 |
| 1e-13 | 1.04 | 0.47 | 0.97 | 0.11 | 0.47 | 0.55 | 1.05 | 0.95 |
| 1e-12 | 0.90 | 0.31 | 0.72 | 0.90 | 0.31 | 0.18 | 0.76 | 0.81 |
| 1e-11 | 0.89 | 0.15 | 0.74 | 0.88 | 0.15 | 0.33 | 0.78 | 0.77 |
| 1e-10 | 0.92 | 0.07 | 0.71 | 0.91 | 0.07 | 0.69 | 0.82 | 0.76 |
| 1e-09 | 0.87 | 0.04 | 0.69 | 0.88 | 0.06 | 0.69 | 0.84 | 0.77 |
3) Brain Results
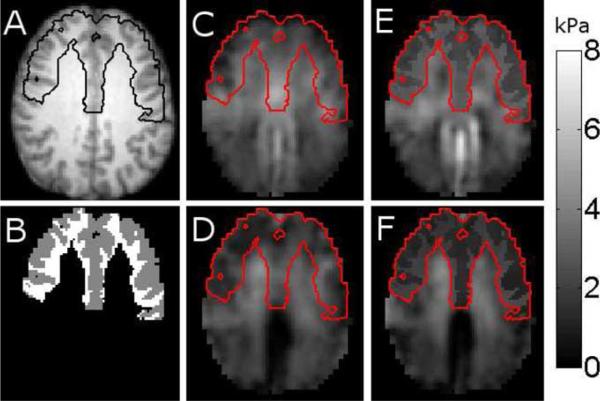
Fig. 9 presents a representative slice of a brain reconstruction using SPR with the cortical gray and white matter assigned to two homogeneous property regions, demonstrating that assigning these large tissue classes to a single region does not produce homogeneous property estimates in regions spanning multiple subzones. Fig. 10 shows the same slice with the frontal lobe gray and white matter assigned to regions while the rest of the brain is assigned to region 0 (no SPR), which produces a better result where contrast between gray and white matter is detected, and the regions exhibit homogeneous properties despite spanning several subzones. Fig. 11 shows that the mean recovered properties of each frontal lobe tissue type have low variation over five repeated scans of the same subject. The mean and standard deviation of the frontal lobe tissue properties across the five scans are given in Table III.
Fig. 9.
Representative slice of brain properties with an inappropriate application of SPR, where all of the white matter and cortical gray matter is assigned to regions. A shows the T1 weighted image with the reconstruction mask marked, B shows the gray and white matter segmentation, C is the storage modulus, and D is the loss modulus.
Fig. 10.
Representative slice of brain properties estimated using fully distributed reconstruction and SPR when the white and gray matter of the frontal lobe were assigned to two regions, and the rest of the tissue was included in region 0 (no SPR). A shows the T1 weighted image with the frontal lobe boundary marked, B shows the gray and white matter segmentation of the frontal lobe. C and D are the reconstructed storage and loss moduli, respectively, for fully distributed reconstruction. E and F are the reconstructed storage and loss moduli when SPR is applied to the frontal lobe. The boundary of the frontal lobe is marked in red on the mechanical property images.
Fig. 11.
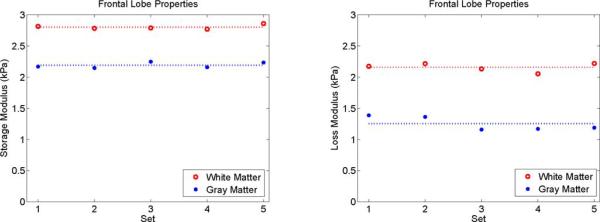
Property values of the gray and white matter of the frontal lobe using SPR for repeated scans of the same subject. Means across the five scans are indicated with dotted lines. Statistically significant differences between frontal lobe gray and white matter were found for both storage modulus (p = 8×10⁻⁸) and loss modulus (p = 3 × 10⁻⁷).
TABLE III.
Frontal Lobe Gray Matter (GM) and White Matter (WM) Properties Estimated Using SPR and Fully Distributed (FD) Reconstruction. Values Are Reported as the Mean (x̄) and Standard Deviation (σ) of Each Region Across 5 Repeated Scans of the Same Subject (Storage Modulus, μs, and Loss Modulus, μs, Both Given in Units of kPa). The Coefficient of Variation (CoV) Is Calculated as a Percentage Using CoV = (σ)/(x̄) × 100
| Tissue Type | x̄spr | x̄fd | σ spr | σ fd | CoVspr | CoVfd |
|---|---|---|---|---|---|---|
| GM - μs | 2.234 | 2.3251 | 0.050 | 0.0603 | 2.25 | 2.59 |
| WM - μs | 2.799 | 2.6438 | 0.047 | 0.0787 | 1.67 | 2.98 |
| GM - μl | 1.300 | 1.2847 | 0.111 | 0.0781 | 8.50 | 6.08 |
| WM - μl | 2.198 | 1.6344 | 0.068 | 0.0853 | 3.09 | 5.22 |
C. Discussion
SPR allows recovery of accurate property values when anatomical information is available. The simulation experiment detailed in Fig. 1 models the fine structure of the gray-white matter interface of the brain using a high resolution property distribution to generate simulated data, which is then sampled at MR resolution to simulate finite resolution MRE measurement of a continuous displacement field. Figs. 3 and 4 show that without SPR reconstructed storage and loss moduli are blurred across tissue interfaces, which causes loss of mechanical property contrast when compared to the true values, whereas supplying spatial information through SPR recovers sharp property boundaries and accurate contrast. Simulated motion noise causes a downward trend in modulus values with and without SPR, however, at noise levels of approximately 5% expected in MRE quantitative accuracy is not significantly affected.
The SPR performs well when the segmentation supplied to create the L matrix in (6) is accurate. Fig. 6 indicates that the values of the recovered mechanical properties for a phantom are stable over a wide range of regularization weights. The loss modulus of the softer gelatin inclusion did exhibit variation with Correspond to the Mean Values for the Regions Indicated in Fig. 2. Values Listed in the First Row (αsp = 0) Use Spatial Filtering and Total Variation Minimization for Stability. All Other Rows Use Only SPR With the Specified αsp Value, likely due to the small magnitude of energy loss in soft gelatin which challenges the sensitivity of the inversion. The values of loss moduli have proportionally higher variation compared to storage moduli due to their smaller magnitude. Tables I and II show that in absolute terms the variation of both moduli in the background material is on the order of 0.2 kPa for 10−12 ≤ αsp ≤ 10−9.
Fig. 5 demonstrates that the property maps become smoother as the regularization weighting increases, as expected. Gelatin has substantially lower motion attenuation than tofu, which is clearly indicated in the damping ratio images. Reconstructions using standard NLI MRE regularization (spatial filtering and total variation minimization) and no SPR (see parts of Fig. 5 and Tables I and II) show reduced contrast in the inclusions because spatial filtering blurs edges and total variation minimization penalizes gradients in the property distribution. SPR does not penalize contrast, therefore, recovered property values are more likely to be indicative of the true properties. Interestingly, these simulation and phantom experiments show that SPR preserves regional homogeneity even though property uniformity is preferred only on the subzone scale which is larger than the geometrical contouring evident in the structural segmentations.
When SPR is applied with accurate spatial information, the recovered mechanical property estimates for tofu and gelatin phantoms are consistent over a wide range of regularization weighting factors and across multiple subzones, indicating that the regional property values are a robust estimate of the true properties. Figs. 7 and 8 illustrate the effects of segmentation errors. If part of a structure is missing from the segmentation, decreasing αsp allows the missing piece to appear while retaining smoothness in the truly homogeneous regions. Fig. 7 has the lower half of the inclusion visible when αsp ≤ 10−11, and the left plot of Fig. 8 shows the property values of the lower and upper halves of the inclusion moving toward the correct value as αsp → 0, until instability arises from insufficient regularization which degrades the solution when αsp < 10−13. Errors in the size of a segmented inclusion create bias. The right plot of Fig. 8 indicates that segmentations with an incorrect inclusion size lead to errors in the reconstructed storage modulus because the stiffness of the inclusion changes to compensate for the spatial phase shift of the shear waves caused by the incorrect segmentation. The loss modulus is not as sensitive because of its lower contrast between the inclusion and the background in this phantom. The false segmentation in a homogeneous region (region H in Fig. 2) does not appear significantly different from the rest of the background in the reconstructions shown in Fig. 7 and values reported in Tables I and II. These results suggest that a cautious approach, in which as many anatomical structures as possible are differentiated in the SPR segmentation, is likely to produce more accurate property estimates compared to simply grouping large classes of tissue in a single region.
Segmentation of tissue types is complicated in vivo, and anatomical structures segmented from conventional MR images may not have homogeneous mechanical properties. Variations in the cytostructure can lead to changes in cell stiffness without affecting cellular function. For example, changes in cell stiffness have been observed in response to mechanical loading, and the loading experienced by a given tissue type is dependent on location; therefore, some variation in properties across a tissue can be expected [52]. The subzone approach to NLI inversion with SPR can mitigate errors resulting from slow variation in tissue properties over large regions because the soft prior constraint is applied over the portion of a tissue region defined by the subzone; hence, property variation at the subzone scale (≈25 mm) is not penalized. Fig. 9 illustrates this concept. Choosing all white or gray matter in the brain as a single region is not appropriate because structures such as the corpus callosum, cerebral falx, and corona radiata are very likely to have different mechanical properties relative to the surrounding tissue. The subzone soft prior algorithm allows the mechanical properties to vary at larger spatial scales so that these structures are differentiated. Even with mitigation from sub-zoning, SPR must be deployed judiciously. Tissues with substantial spatial variation in properties should not be assigned to a single region. A more detailed segmentation which delineates each substructure with different mechanical properties would be required to avoid bias resulting from inaccurate spatial information, or tissues where a homogeneous assumption is not valid can be assigned to region 0 and remain fully distributed in terms of their MRE property parameter estimates. Johnson et al. have recently demonstrated that the shear modulus of the corpus callosum and corona radiata exhibit significant spatial variation which correlates with variations in the tissue microstructure detailed in the literature and measured using DTI [53]. Applying SPR to these structures does not improve the reconstructed properties, as would be expected from an inappropriate application of SPR.
White and gray matter in the frontal lobe of the brain is a more appropriate application of SPR because of its more homogeneous properties relative to tissue classes containing other complex structures where the tissue property estimates can remain distributed. SPR performed well in this initial in vivo experiment on healthy brain. Fig. 10 shows that the frontal lobe gray and white matter images were homogeneous despite spanning multiple subzones suggesting that the tissue classes are approximately homogeneous mechanically. Fig. 11 and Table III show statistically significant differences between frontal lobe gray and white matter mechanical properties using SPR with five repeated scans of the same healthy volunteer. The storage and loss moduli of white matter (μs = 2.80 kPa, μl = 2.20 kPa) was found to be significantly greater than gray matter (μs = 2.23 kPa, μl = 1.30 kPa) with p < 10−6, which agrees with the findings of the majority of MRE brain publications to date [9], [12], [54], [55], although, two papers using a curl based direct inversion MRE algorithm have reported the opposite contrast [11], [43]. Greater contrast is detected between the two tissue classes using SPR compared to fully distributed reconstruction because blurring of the tissue interface is eliminated. Differentiation of gray and white matter is relatively poor in the fully distributed property images in Fig. 10; the spatial resolution of MRE that can be achieved currently is not sufficient to capture the fine structure. Spatial information provided by SPR is beneficial in this case.
The variability over multiple scans of the same subject is codified by the coefficient of variation (CoV) in Table III. SPR reconstruction produces a lower CoV than fully distributed reconstructions for the storage modulus of both white matter (1.67% versus 2.98%) and gray matter (2.25% versus 2.59%). The CoV of SPR loss modulus reconstructions is also better for white matter (3.09% versus 5.22%), but not for gray matter (8.50% versus 6.08%), where greater variability may be due to the lower level of attenuation compared to white matter. Accurately estimating localized homogeneous tissue properties (such as frontal lobe gray and white matter) using SPR appears to be a promising avenue for investigating the progression of brain disorders such as hydrocephalus, multiple sclerosis and Alzheimer's disease.
II. Conclusion
This study demonstrates MRE reconstruction using SPR, which involves a priori segmentation of one or more classes of tissue into regions where homogeneous properties are expected. The nonlinear inversion algorithm is modified to favor homogeneous properties within a region through the addition of a penalty term in the objective function minimized during property parameter estimation. SPR performs well in simulations, phantoms and in vivo when the segmentation is accurate. Property estimates are stable over a wide range of regularization weightings, and the reconstruction process requires no prior information on the quantitative property values of predefined regions. Segmentation errors cause bias in the property estimates; however, proper choice of regularization weighting can mitigate the effects. SPR was used to demonstrate significant differences between the mechanical properties of the gray and white matter of the frontal lobe of the brain. Although SPR must be applied judiciously to avoid bias from segmentation errors, it appears to be a promising tool to accurately measure the mechanical properties of fine tissue structures where homogeneous properties can reasonably be expected to exist.
Acknowledgment
Collection of brain MRE data was supported by the Biomedical Imaging Center at the Beckman Institute for Advanced Science and Technology, University of Illinois at Urbana-Champaign.
The development of the SPR algorithm was supported by a grant from the National Institutes of Health (R01CA159324-02).
Contributor Information
Matthew McGarry, Thayer School of Engineering, Dartmouth College, Hanover, NH 03755 USA.
Curtis L. Johnson, University of Illinois at Urbana-Champaign, Urbana, IL 61801 USA.
Bradley P. Sutton, University of Illinois at Urbana-Champaign, Urbana, IL 61801 USA.
Elijah E. W. Van Houten, Université de Sherbrooke, Sherbrooke, QC, J1K 2R1 Canada.
John G. Georgiadis, University of Illinois at Urbana-Champaign, Urbana, IL 61801 USA.
John B. Weaver, Thayer School of Engineering, Dartmouth College, Hanover, NH 03755 USA Dartmouth-Hitchcock Medical Center, Lebanon, NH 03756 USA..
Keith D. Paulsen, Thayer School of Engineering, Dartmouth College, Hanover, NH 03755 USA Dartmouth-Hitchcock Medical Center, Lebanon, NH 03756 USA..
References
- 1.Muthupillai R, Lomas DJ, Rossman PJ, Greenleaf JF, Manduca A, Ehman RL. Magnetic resonance elastography by direct visualization of propagating acoustic strain waves. Science. 1995 Sep.269:1854–1857. doi: 10.1126/science.7569924. [DOI] [PubMed] [Google Scholar]
- 2.Huwart L, et al. Magnetic resonance elastography for the noninvasive staging of liver fibrosis. Gastroenterology. 2008;135(1):32–40. doi: 10.1053/j.gastro.2008.03.076. [DOI] [PubMed] [Google Scholar]
- 3.Ehman RL. Science to practice: Can MR elastography be used to detect early steatohepatitis in fatty liver disease. Radiology. 2009;253(1):1. doi: 10.1148/radiol.2531091040. [DOI] [PubMed] [Google Scholar]
- 4.Asbach P, Klatt D, Hamhaber U, Braun J, Somasundaram R, Hamm B, Sack I. Assessment of liver viscoelasticity using multifrequency MR elastography. Magn. Reson. Med. 2008;60(2):373–379. doi: 10.1002/mrm.21636. [DOI] [PubMed] [Google Scholar]
- 5.Chen J, Talwalkar JA, Yin M, Glaser KJ, Sanderson SO, Ehman RL. Early detection of nonalcoholic steatohepatitis in patients with nonalcoholic fatty liver disease by using MR elastography. Radiology. 2011;259(3):749–756. doi: 10.1148/radiol.11101942. [DOI] [PMC free article] [PubMed] [Google Scholar]
- 6.Sinkus R, Siegmann K, Xydeas T, Tanter M, Claussen C, Fink M. MR elastography of breast lesions: Understanding the solid/liquid duality can improve the specificity of contrast-enhanced MR mammography. Magn. Reson. Med. 2007;58(6):1135–1144. doi: 10.1002/mrm.21404. [DOI] [PubMed] [Google Scholar]
- 7.Siegmann KC, Xydeas T, Sinkus R, Kraemer B, Vogel U, Claussen CD. Diagnostic value of MR elastography in addition to contrast-enhanced MR imaging of the breast-initial clinical results. Eur. Radiol. 2010 Feb.20(2):318–325. doi: 10.1007/s00330-009-1566-4. [DOI] [PubMed] [Google Scholar]
- 8.Sack I, Beierbach B, Wuerfel J, Klatt D, Hamhaber U, Papazoglou S, Martus P, Braun J. The impact of aging and gender on brain viscoelasticity. NeuroImage. 2009 Jul.46(3):652–657. doi: 10.1016/j.neuroimage.2009.02.040. [DOI] [PubMed] [Google Scholar]
- 9.Johnson CL, McGarry MDJ, Van Houten EEW, Weaver JB, Paulsen KD, Sutton BP, Georgiadis JG. Magnetic resonance elastography of the brain using multi-shot spiral readouts with self-navigated motion correction. Magn. Reson. Med. 2013 Aug.70(2):404–412. doi: 10.1002/mrm.24473. [DOI] [PMC free article] [PubMed] [Google Scholar]
- 10.Weaver JB, Pattsion AJ, Mcgarry MDJ, Perreard IM, Swienckowski JG, Eskey CJ, Lollis SS, Paulsen KD. Brain mechanical property measurement using MRE with intrinsic activation. Phys. Med. Biol. 2012;57:7275–7287. doi: 10.1088/0031-9155/57/22/7275. [DOI] [PMC free article] [PubMed] [Google Scholar]
- 11.Green MA, Bilston LE, Sinkus R. In vivo brain viscoelastic properties measured by magnetic resonance elastography. NMR Biomed. 2008;21(7):755–764. doi: 10.1002/nbm.1254. [DOI] [PubMed] [Google Scholar]
- 12.Kruse SA, Rose GH, Glaser KJ, Manduca A, Felmlee JP, Jack CR, Ehman RL. Magnetic resonance elastography of the brain. Neuroimage. 2008;39(1):231–237. doi: 10.1016/j.neuroimage.2007.08.030. [DOI] [PMC free article] [PubMed] [Google Scholar]
- 13.Green MA, Sinkus R, Gandevia SC, Herbert RD, Bilston LE. Measuring changes in muscle stiffness after eccentric exercise using elastography. NMR Biomed. 2012;25(6):852–858. doi: 10.1002/nbm.1801. [DOI] [PubMed] [Google Scholar]
- 14.Papazoglou S, Rump J, Braun J, Sack I. Shear wave group velocity inversion in MR elastography of human skeletal muscle. Magn. Reson. Med. 2006;56(3):489–497. doi: 10.1002/mrm.20993. [DOI] [PubMed] [Google Scholar]
- 15.Cheng S, Gandevia SC, Green M, Sinkus R, Bilston LE. Viscoelastic properties of the tongue and soft palate using MR elastography. J. Biomechan. 2011;44(3):450–454. doi: 10.1016/j.jbiomech.2010.09.027. [DOI] [PubMed] [Google Scholar]
- 16.Streitberger K, Wiener E, Hoffmann J, Freimann FB, Klatt D, Braun J, Lin K, McLaughlin J, Sprung C, Klingebiel R, Sack I. In vivo viscoelastic properties of the brain in normal pressure hydrocephalus. NMR Biomed. 2010 Jul.:385–392. doi: 10.1002/nbm.1602. 2010. [DOI] [PubMed] [Google Scholar]
- 17.Wuerfel J, Paul F, Beierbach B, Hamhaber U, Klatt D, Papazoglou S, Zipp F, Martus P, Braun J, Sack I. MR-elastography reveals degradation of tissue integrity in multiple sclerosis. Neuroimage. 2010;49(3):2520–2525. doi: 10.1016/j.neuroimage.2009.06.018. [DOI] [PubMed] [Google Scholar]
- 18.Murphy MC, Huston J, Jack CR, Glaser KJ, Manduca A, Felmlee JP, Ehman RL. Decreased brain stiffness in Alzheimer's disease determined by magnetic resonance elastography. J. Magn. Reson. Imag. 2011 Jul.498:494–498. doi: 10.1002/jmri.22707. [DOI] [PMC free article] [PubMed] [Google Scholar]
- 19.Doyley MM, Weaver JB, Van Houten EEW, Kennedy FE, Paulsen KD. Thresholds for detecting and characterizing focal lesions using steady-state MR elastography. Med. Phys. 2003;30:495. doi: 10.1118/1.1556607. [DOI] [PubMed] [Google Scholar]
- 20.Murphy MC, Huston J, Glaser KJ, Manduca A, Meyer FB, Lanzino G, Morris JM, Felmlee JP, Ehman RL. Preoperative assessment of meningioma stiffness using magnetic resonance elastography: Clinical article. J. Neurosurg. 2012:1–6. doi: 10.3171/2012.9.JNS12519. [DOI] [PMC free article] [PubMed] [Google Scholar]
- 21.Perriñez PR, Kennedy FE, Van Houten EEW, Weaver JB, Paulsen KD. Modeling of soft poroelastic tissue in time-harmonic MR elastography. IEEE Trans. Biomed. Eng. 2009;56(3):598–608. doi: 10.1109/TBME.2008.2009928. [DOI] [PMC free article] [PubMed] [Google Scholar]
- 22.Bayly PV, Clayton EH, Genin GM. Experimental imaging data for the development and validation of brain biomechanics models. Annu. Rev. Biomed. Eng. 2012;14(1) doi: 10.1146/annurev-bioeng-071811-150032. [DOI] [PMC free article] [PubMed] [Google Scholar]
- 23.Manduca A, Lake DS, Kruse SA, Ehman RL. Spatio-temporal directional filtering for improved inversion of MR elastography images. Med. Image Anal. 2003;7(4):465–473. doi: 10.1016/s1361-8415(03)00038-0. [DOI] [PubMed] [Google Scholar]
- 24.McGee KP, Lake D, Mariappan Y, Hubmayr RD, Manduca A, Ansell K, Ehman RL. Calculation of shear stiffness in noise dominated magnetic resonance elastography data based on principal frequency estimation. Phys. Med. Biol. 2011;56:4291. doi: 10.1088/0031-9155/56/14/006. [DOI] [PMC free article] [PubMed] [Google Scholar]
- 25.Mcgarry MDJ, Van Houten EEW, Johnson CL, Sutton BP, Georgiadis JG, Weaver JB, Paulsen KD. Multi-resolution MR elastography using non-linear inversion. Med. Phys. 2012;39(10):6388–6396. doi: 10.1118/1.4754649. [DOI] [PMC free article] [PubMed] [Google Scholar]
- 26.Zhang Y, Oberai AA, Barbone PE, Harari I. Solution of the time-harmonic viscoelastic inverse problem with interior data in two dimensions. Int. J. Num. Methods Eng. 2012;92(13):1100–1116. [Google Scholar]
- 27.Garteiser P, Doblas S, Van Beers BE, Vilgrain V, Sinkus R. Physical boundary conditions reconstruction: A novel method to determine viscoelastic parameters from magnetic resonance elastography data. Proc. Int. Soc. Mag. Reson. Med. 2011:3482. [Google Scholar]
- 28.Doyley MM, Srinivasan S, Dimidenko E, Soni N, Ophir J. Enhancing the performance of model-based elastography by incorporating additional a priori information in the modulus image reconstruction process. Phys. Med. Biol. 2006;51(1):95–112. doi: 10.1088/0031-9155/51/1/007. [DOI] [PubMed] [Google Scholar]
- 29.Richards MS, Doyley MM. Investigating the impact of spatial priors on the performance of model-based IVUS elastography. Phys. Med. Biol. 2011;56:7223. doi: 10.1088/0031-9155/56/22/014. [DOI] [PMC free article] [PubMed] [Google Scholar]
- 30.Baldewsing RA, Mastik F, Schaar JA, Serruys PW, van der Steen AFW. Youngs modulus reconstruction of vulnerable atherosclerotic plaque components using deformable curves. Ultrasound Med. Biol. 2006;32(2):201–210. doi: 10.1016/j.ultrasmedbio.2005.11.016. [DOI] [PubMed] [Google Scholar]
- 31.Golnabi AH, Meaney PM, Geimer SD, Paulsen KD. Comparison of no-prior and soft-prior regularization in biomedical microwave imaging. J. Med. Phys./Assoc. Med. Physicists India. 2011;36(3):159. doi: 10.4103/0971-6203.83482. [DOI] [PMC free article] [PubMed] [Google Scholar]
- 32.Meaney PM, Zhou T, Goodwin D, Golnabi A, Attardo EA, Paulsen KD. Bone dielectric property variation as a function of mineralization at microwave frequencies. Int. J. Biomed. Imag. 2012:1–9. doi: 10.1155/2012/649612. [DOI] [PMC free article] [PubMed] [Google Scholar]
- 33.Yalavarthy PK, Pogue BW, Dehghani H, Carpenter CM, Jiang S, Paulsen KD. Structural information within regularization matrices improves near infrared diffuse optical tomography. Opt. Exp. 2007;15(13):8043–8058. doi: 10.1364/oe.15.008043. [DOI] [PubMed] [Google Scholar]
- 34.Brooksby B, Jiang S, Dehghani H, Pogue BW, Paulsen KD, Weaver J, Kogel C, Poplack SP. Combining near-infrared tomography and magnetic resonance imaging to study in vivo breast tissue: Implementation of a Laplacian-type regularization to incorporate magnetic resonance structure. J. Biomed. Opt. 2005;10:051504. doi: 10.1117/1.2098627. [DOI] [PubMed] [Google Scholar]
- 35.Li BN, Chui CK, Ong SH, Numano T, Washio T, Homma K, Chang S, Venkatesh S, Kobayashi E. Modeling shear modulus distribution in magnetic resonance elastography with piecewise constant level sets. Magn. Reson. Imag. 2012;30(3):390–401. doi: 10.1016/j.mri.2011.09.015. [DOI] [PubMed] [Google Scholar]
- 36.Van Houten EEW, Paulsen KD, Miga MI, Kennedy FE, Weaver JB. An overlapping subzone technique for MR-based elastic property reconstruction. Magn. Reson. Med. 1999;42:779–786. doi: 10.1002/(sici)1522-2594(199910)42:4<779::aid-mrm21>3.0.co;2-z. [DOI] [PubMed] [Google Scholar]
- 37.Zienkiewicz OC, Taylor RL. The Finite Element Method. Vol. 1. Butterworth-Heinemann; Oxford, U.K.: 2000. [Google Scholar]
- 38.Cook RD, Malkus DG, Plesha ME, Witt RJ. Concepts and Applications of Finite Element Analysis. Wiley; New York: 2007. [Google Scholar]
- 39.Byrd RH, Lu P, Nocedal J, Zhu C. A limited memory algorithm for bound constrained optimization. SIAM J. Sci. Comput. 1995;16(5):1190–1208. [Google Scholar]
- 40.Zhu C, Byrd RH, Lu P, Nocedal J. Algorithm 778: L-BFGS-B: Fortran subroutines for large-scale bound-constrained optimization. ACM Trans. Math. Software. 1997;23(4):550–560. [Google Scholar]
- 41.Weaver JB, Van Houten EEW, Miga MI, Kennedy FE, Paulsen KD. Magnetic resonance elastography using 3-D gradient echo measurements of steady-state motion. Med. Phys. 2001;28:1620. doi: 10.1118/1.1386776. [DOI] [PubMed] [Google Scholar]
- 42.McGarry MDJ, Van Houten EEW, Perriñez PR, Pattison AJ, Weaver JB, Paulsen KD. An octahedral shear strain-based measure of SNR for 3-D MR elastography. Phys. Med. Biol. 2011;56:N153. doi: 10.1088/0031-9155/56/13/N02. [DOI] [PMC free article] [PubMed] [Google Scholar]
- 43.Zhang J, Green MA, Sinkus R, Bilston LE. Viscoelastic properties of human cerebellum using magnetic resonance elastography. J. Biomechan. 2011;44(10):1909–1913. doi: 10.1016/j.jbiomech.2011.04.034. [DOI] [PubMed] [Google Scholar]
- 44.van Dommelen JAW, van der Sande TPJ, Hrapko M, Peters GWM. Mechanical properties of brain tissue by indentation: Interregional variation. J. Mechan. Behav. Biomed. Mater. 2010 Jan.3(2):158–166. doi: 10.1016/j.jmbbm.2009.09.001. [DOI] [PubMed] [Google Scholar]
- 45.Prange MT, Margulies SS. Regional, directional, and age-dependent properties of the brain undergoing large deformation. J. Biomechan. Eng. 2002 Jan.124(2):244–252. doi: 10.1115/1.1449907. [DOI] [PubMed] [Google Scholar]
- 46.Toga AW, Thompson PM, Mori S, Amunts K, Zilles K. Towards multimodal atlases of the human brain. Nature Rev. Neurosci. 2006;7(12):952–966. doi: 10.1038/nrn2012. [DOI] [PMC free article] [PubMed] [Google Scholar]
- 47.Jenkinson M, Beckmann CF, Behrens TE, Woolrich MW, Smith SM. FSL. NeuroImage. 2012 Aug.62(2):782–790. doi: 10.1016/j.neuroimage.2011.09.015. [DOI] [PubMed] [Google Scholar]
- 48.Smith SM. Fast robust automated brain extraction. Human Brain Mapp. 2002;17(3):143–155. doi: 10.1002/hbm.10062. [DOI] [PMC free article] [PubMed] [Google Scholar]
- 49.Zhang Y, Brady M, Smith S. Segmentation of brain MR images through a hidden Markov random field model and the expectation-maximization algorithm. IEEE Trans. Med. Imag. 2001 Jan.20(1):45–57. doi: 10.1109/42.906424. [DOI] [PubMed] [Google Scholar]
- 50.Jenkinson M, Bannister P, Brady M, Smith S. Improved optimization for the robust and accurate linear registration and motion correction of brain images. NeuroImage. 2002 Oct.17(2):825–841. doi: 10.1016/s1053-8119(02)91132-8. [DOI] [PubMed] [Google Scholar]
- 51.Mazziotta J, Toga A, Evans A, Fox P, Lancaster J, Zilles K, Woods R, Paus T, Simpson G, Pike B, Holmes C, Collins L, Thompson P, Mac-Donald D, Iacoboni M, Schormann T, Amunts K, Palomero-Gallagher N, Geyer S, Parsons L, Narr K, Kabani N, Le Goualher G, Boomsma D, Cannon T, Kawashima R, Mazoyer B. A probabilistic atlas and reference system for the human brain: International consortium for brain mapping (ICBM) Phil. Trans. R. Soc. Ser. B—Biol. Sci. 2001 Aug.356(1412):1293–1322. doi: 10.1098/rstb.2001.0915. [DOI] [PMC free article] [PubMed] [Google Scholar]
- 52.Janmey PA, McCulloch CA. Cell mechanics: Integrating cell responses to mechanical stimuli. Annu. Rev. Biomed. Eng. 2007;9:1–34. doi: 10.1146/annurev.bioeng.9.060906.151927. [DOI] [PubMed] [Google Scholar]
- 53.Johnson CL, McGarry MDJ, Gharibans AA, Weaver JB, Paulsen KD, Wang H, Olivero WC, Sutton BP, Georgiadis JG. Local mechanical properties of white matter structures in the human brain. NeuroImage. 2013;79:145–152. doi: 10.1016/j.neuroimage.2013.04.089. [DOI] [PMC free article] [PubMed] [Google Scholar]
- 54.Pattison AJ, Lollis SS, Perriņez PR, Perreard IM, McGarry MDJ, Weaver JB, Paulsen KD. Time-harmonic magnetic resonance elastography of the normal feline brain. J. Biomechan. 2010;43(14):2747–2752. doi: 10.1016/j.jbiomech.2010.06.008. [DOI] [PMC free article] [PubMed] [Google Scholar]
- 55.McCracken PJ, Manduca A, Felmlee J, Ehman RL. Mechanical transient-based magnetic resonance elastography. Magn. Reson. Med. 2005;53(3):628–639. doi: 10.1002/mrm.20388. [DOI] [PubMed] [Google Scholar]


