

Abstract
Objective
To validate an automated cerebellar segmentation method based on active shape and appearance modeling and then segment the cerebellum on images acquired from adolescents with histories of prenatal alcohol exposure (PAE) and non-exposed controls (NC).
Methods
Automated segmentations of the total cerebellum, right and left cerebellar hemispheres, and three vermal lobes (anterior, lobules I–V; superior posterior, lobules VI–VII; inferior posterior, lobules VIII–X) were compared to expert manual labelings on 20 subjects, studied twice, that were not used for model training. The method was also used to segment the cerebellum on 11 PAE and 9 NC adolescents.
Results
The test–retest intraclass correlation coefficients (ICCs) of the automated method were greater than 0.94 for all cerebellar volume and mid-sagittal vermal area measures, comparable or better than the test–retest ICCs for manual measurement (all ICCs > 0.92). The ICCs computed on all four cerebellar measurements (manual and automated measures on the repeat scans) to compare comparability were above 0.97 for non-vermis parcels, and above 0.89 for vermis parcels. When applied to patients, the automated method detected smaller cerebellar volumes and mid-sagittal areas in the PAE group compared to controls (p < 0.05 for all regions except the superior posterior lobe, consistent with prior studies).
Discussion
These results demonstrate excellent reliability and validity of automated cerebellar volume and mid-sagittal area measurements, compared to manual measurements. These data also illustrate that this new technology for automatically delineating the cerebellum leads to conclusions regarding the effects of prenatal alcohol exposure on the cerebellum consistent with prior studies that used labor intensive manual delineation, even with a very small sample.
Keywords: Cerebellum, Segmentation, Vermis, Alcohol, Fetal alcohol spectrum disorders (FASD)
Highlights
-
•
Cerebellum is automatically segmented using active appearance modeling.
-
•
Excellent reliability and validity of automated vs. manual measurements
-
•
Cerebellum is automatically segmented in children prenatally exposed to alcohol.
-
•
Automated cerebellar measures are smaller in children prenatally exposed to alcohol.
-
•
Prenatal alcohol results are consistent with prior studies using manual labeling.
1. Introduction
The cerebellum is involved in postural control, gait, balance, and coordination of bilateral movements. Recent work has demonstrated that the neocerebellum, comprising of the lateral hemispheres, vermal lobules VI–VII, and the dentate nucleus, is involved in cognitive tasks, such as executive function (Berman et al., 1995; Raichle et al., 1994; Schlosser et al., 1998), verbal fluency (Appollonio et al., 1993), verb generation (Fiez et al., 1996), working memory (Fiez et al., 1996), and source memory (Tamagni et al., 2010). Moreover, the cerebellum is of special interest to the study of brain development since it has been shown to have greater vulnerability to damage in the perinatal period (Tam et al., 2011). Despite the clear evidence that the cerebellum underlies cognitive and motor functions and is vulnerable during neurodevelopment, very few human neuroimaging studies have measured cerebellar volumes in part due to the paucity and limitations of automated cerebellar segmentation algorithms. Instead, imaging studies of the human cerebellum have relied on manual segmentation to delineate the cerebellar hemispheres and vermis.
Manual segmentation has problems when used in large scale imaging studies, as it is slow, and error-prone, and consistency between operators is difficult to obtain and maintain. A few automatic or semi-automatic cerebellar segmentation algorithms have been published (Cerasa et al., 2009; Hwang et al., 2011; Powell et al., 2008; van der Lijn et al., 2012; Weier et al., 2012; Zhao et al., 2010), but these methods (including Freesurfer) only provide a delineation of the total cerebellum or cerebellar hemispheres (and not the cerebellar vermis). Given that the cerebellar vermis has been repeatedly implicated in diseases such as alcoholism (Andersen, 2004; Baker et al., 1999; Cavanagh et al., 1997), fetal alcohol spectrum disorders (Archibald et al., 2001; Maier et al., 1999; O'Hare et al., 2005; Ramadoss et al., 2007; Sowell et al., 1996), and autism (Brambilla et al., 2003; Scott et al., 2009; Webb et al., 2009), these existing cerebellar segmentation methods that do not delineate the vermis are highly limited for clinical research.
Many techniques exist to divide a medical image into regions with similar properties such as gray level, color, texture, brightness and contrast. Medical image segmentation based on texture features has been explored, but has never gained popularity (Haralick et al., 1973). Early techniques based on gray level features such as histogram thresholding, edge based segmentation, and region based segmentation generally do not perform well on images with complex anatomy such as the brain (Sharma and Aggarwal, 2010). Segmentation of the cerebellum is especially challenging, because the cerebellar foliations are < 0.5 mm, leading to extensive partial voluming within the cerebellum at the standard 1 mm3 resolution of T1-weighted images. Therefore, any segmentation method that seeks to delineate more than the outer cerebellar boundary must use prior knowledge. The state of the art and most popular methods for medical image segmentation are atlas based approaches (e.g., Freesurfer) and model based approaches (e.g., deformable models, active shape and appearance modeling), both of which use prior knowledge of the structure to be segmented. Atlas based segmentation relies on appropriate atlas formation and selection, and accurate registration of the image to be segmented to the atlas. At least two atlases of normal adult human brain anatomy include delineation of the cerebellar vermis and lobes (Diedrichsen et al., 2009; Rohlfing et al., 2010), and may be used to parcellate the cerebellum. In our experience, atlas-based methods do not provide reliable estimation of cerebellar volumes or mid-sagittal areas (test–retest reliabilities range from 0.15 to 0.70, work in progress) and are better suited for integration with functional imaging methods to identify anatomical regions where functional activation occurs, which is the use recommended by the developers of these atlases. Therefore, we have developed a Bayesian implementation of active appearance modeling for measurement of cerebellum volume. In this model the structure of the cerebellum and its subparcels is assumed to have a repetitive form of geometry that can be modeled probabilistically from hand-delineated examples. The probabilistic model of cerebellar geometry can be used to enforce a strong prior during segmentation, where candidate segmentations matching the model are more likely to be chosen as the correct parcellation.
Accurate automated cerebellar segmentation would be valuable in the study of clinical samples, such as fetal alcohol spectrum disorders (FASD). Although not all children with histories of prenatal exposure to alcohol meet the diagnostic criteria for fetal alcohol syndrome (FAS) (Kuehn et al., 2012), many with heavy exposure exhibit functional abnormalities. Children with FASD show difficulties with cognitive processes that may be related to alcohol-induced cerebellar dysfunction, including memory, verbal learning, and executive functions (Mattson et al., 2011, 2013; Vaurio et al., 2011). Alcohol's negative impact on cerebellar development is also likely to contribute to deficits in motor behaviors observed in children, adolescents and adults prenatally exposed to alcohol, such as longer reaction times, slower movement, problems generating isometric and isotonic forces, bimanual coordination, and postural balance (Connor et al., 2006; Debaere et al., 2004; Nguyen et al., 2013a, b; Roebuck et al., 1998a, b; Simmons et al., 2010, 2012). Moreover, neuropathology documented in animal and clinical research has repeatedly shown that the cerebellum is particularly sensitive to early exposure to alcohol (Bauer-Moffett and Altman, 1975; Goodlett et al., 1990a, b; Hamre and West, 1993; Phillips and Cragg, 1982; Thomas et al., 1998), specifically the cerebellar vermis (Clarren et al., 1978; Goodlett et al., 1990a; Jones et al., 1973; Peiffer et al., 1979; Wisniewski et al., 1983). MRI studies of children prenatally exposed to alcohol report reduced volume of the cerebellar hemispheres and vermis (Autti-Ramo et al., 2002; Mattson et al., 1992, 1994). Previous quantitative cerebellar imaging studies in FASD have used manual tracings to detect smaller cerebellar mid-sagittal vermis area (O'Hare et al., 2005; Sowell et al., 1996) or total cerebellar volumes (Bookstein et al., 2006).
In this paper, we use T1-weighted images to automatically segment the cerebellum using a novel algorithm under continuing development by Neurobehavioral Research, Inc. (NRI) under an SBIR Phase I grant. We demonstrate that our automated cerebellar segmentation has high validity when compared to gold-standard manual delineation obtained from Neuromorphometrics, Inc., a small business originating from the Center for Morphometric Analysis at the Massachusetts General Hospital, whose manual delineations have been used to validate accepted image processing tools such as Freesurfer and FSL. In addition, we demonstrate the clinical validity of our algorithm by using it to segment the cerebellum on a sample of adolescents prenatally exposed to alcohol (PAE) and age-matched controls. Based on previous studies that manually delineated the cerebellum, we expected that PAE children would show smaller total cerebellar volumes and smaller mid-sagittal vermal areas of the anterior lobe (vermis lobules I–V) and posterior inferior lobe (vermis lobules VIII–X).
2. Methods
2.1. Cerebellar Analysis Toolkit (CATK) overview
CATK functions as a fully-automated T1 MRI cerebellum delineation and parcellation tool. An active profile–appearance modeling (AAM; Patenaude, 2007; Cootes, 2000; Cootes et al., 2001) framework is used and the toolkit is currently capable of parcellating the cerebellum into five structures: left and right hemispheres, and three vermal lobes (I–V, VI–VII, and VIII–X), although further development is planned to extend the algorithm to segmentation of the left and right cerebellar nuclei. The CATK is based on statistical shape and appearance models learned from a training set of examples hand-delineated by Neuromorphometrics, Inc. The advantage of this is that strong prior knowledge about the cerebellum inherent in the data (such as the overall shape of the cerebellar vermal lobes) is taken into account during segmentation, resulting in a segmentation method that enforces smoothness according to probable variations specific to the structures. Fig. 1 shows a broad overview of the components of the algorithm. The basic components are: data preparation (e.g., intensity normalization, pose correction, cerebellum localization), statistical model generation, and model fitting (for new samples).
Fig. 1.
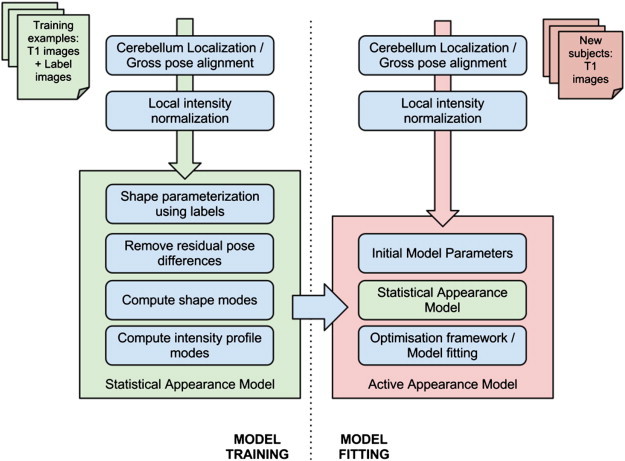
Overview of CATK (Cerebellar Automated Toolkit).
2.1.1. CATK description
To create the statistical shape model, the training images are first linearly aligned using a 9 degrees of freedom model (rotation, translation, and scale) (Woods et al., 1998a,b) with the ICBM-152 template. Shapes are parameterized by a point distribution model (Cootes, 2000; Cootes et al., 2001) derived from stellar meshes. Once training images are aligned, projecting rays from a central point to a label boundary implicitly provides vertex correspondence. For subparcels (like the hemispheres and vermal lobes), multiple projection centers are used to maximize correspondence with the ground truth labels while allowing the covariance between related surfaces to be modeled. For example, the three lobes of the vermis are modeled by a single statistical model containing three surfaces. While the spherical assumption limits the topology of the mesh, modeling errors are minimal for the designated structures, and a number of computational benefits are provided. For instance, the connectivity of the points is implicit which allows fast conversion to triangular mesh surfaces, and models can be easily re-sampled at multiple resolutions which enables both coarse and refined fitting. The ability to control the shape dimension in this way is a significant advantage for statistical modeling as it impacts directly on the number of examples required to obtain good shape parameterization. The point distribution model projects each high-dimensional shape vector (i.e. the raw vertices) into a low-dimensional eigenspace, having at maximum as many principal modes as examples in the training set. Similarly, a statistical intensity model is generated by sampling 1-D profiles normal to the surface at each vertex.
Using this statistical model, new images are parcellated by using the template alignment (rotation, translation, and scale) to initialize the position of the average shape, and then applying a three-stage iterative procedure: The first stage refines the initial position while keeping the shape parameters fixed, after which the second stage adjusts the vertices by maximizing the correlation between observed and reference intensity profiles subject to the closest set of shape parameters. This allows the surface to adapt to new examples while ensuring that they exist within the subspace of possible shapes. Finally, a refinement stage uses conjugate gradient optimization to maximize the conditional intensity–shape distribution using a Bayesian formulation. Owing to its poor lateral boundary distinction, an additional refinement step is applied to central vertices of the vermis in order to improve the accuracy of sagittal area measurements.
2.1.2. CATK training and validation
Expert manual cerebellar labels were obtained from Neuromorphometrics, Inc. (http://www.neuromorphometrics.com) on 63 unique subjects, 20 of whom were imaged and labeled in two separate imaging studies. The 43 subjects without repeat data were used for model training, and the 20 subjects studied twice were used for validation of the model. The average age of the 43 subjects used for training was 44 ± 30 years (range 5–96 years), with 13 children (age 5–17 years), 19 adults (age 18–70 years), and 11 elderly (age 71–96 years). There were 21 males and 22 females in the training set, and only one training subject was left-handed. The average age of the 20 subjects used for validation was 23 ± 4 years (range 19–34 years). There were 8 men and 12 women in the validation set, and all validation subjects were right-handed. Neuromorphometrics uses protocols for defining neuroanatomical regions and custom software that were developed originally as part of the Center for Morphometric Analysis at the Massachusetts General Hospital (Harvard Medical School), and all labels were verified by a neuroanatomy expert. Neuromorphometrics provided labeling for the total cerebellum, left and right cerebellar hemispheres and nuclei, and three cerebellar vermis lobes (lobules I–V, VI–VII, and VIII–X).
2.2. Clinical application in FASD
Two groups of children between the ages of 10 and 18 were included in this study: 13 children with histories of heavy prenatal alcohol exposure (PAE group) and 9 non-exposed control children (NC group). Children were drawn from a larger study of the behavioral teratogenicity of alcohol and were recruited via several mechanisms including professional or self-referral and community outreach. Inclusion in this study required having English as the primary language, no history of head trauma, serious medical condition, or MRI contraindications (e.g., non-removable metallic implants, claustrophobia).
Inclusion in the PAE group required a documentation of heavy maternal alcohol consumption during pregnancy, defined as 4 or more alcoholic drinks per single occasion at least once per week, or 14 or more drinks per week on average. Whenever possible, exposure was confirmed using medical history, birth records, social services records, or maternal report. However, direct maternal report was not common as many of these children no longer resided with their biological families. Thus, precise details about alcohol consumption (i.e., dose and timing) were often unavailable. In these cases, mothers were reported to be “alcoholic” or alcohol abusing or dependent in pregnancy. In addition to psychometric testing and questionnaire screening, a diagnosis of FAS was determined by Dr. Kenneth Lyons Jones, a dysmorphologist, using a standardized assessment (Jones et al., 2006; Mattson et al., 2010). FAS was diagnosed in the presence of structural abnormality (i.e., two or more of the following facial features: short palpebral fissure length, smooth philtrum, thin vermillion border) and either growth deficiency (height or weight ≤ 10%) or microcephaly (occipital–frontal circumference ≤ 10%). Based on this screening process, 6 alcohol-exposed children received a diagnosis of FAS. Children in the NC group were excluded if greater than minimal prenatal alcohol exposure was reported (i.e., < 1 absolute alcoholic drink/day prior to pregnancy recognition). As the majority of children in this group reside with their biological mothers, teratogenic exposure was determined through direct maternal report. Children in the NC group were screened for prenatal alcohol exposure through a telephone interview process and completion of a parent questionnaire that elicited information concerning alcohol consumption during pregnancy.
Informed consent and assent were obtained from the legal guardians and participants in accordance with the Institutional Review Boards of San Diego State University (SDSU) and the University of California San Diego (UCSD). Following informed consent all children were scanned at the UCSD Keck Center for Functional MRI on a 3T General Electric Signa Excite using an 8 channel head coil. T1-weighted 3D images were acquired for 17 subjects with the following parameters: TR, 8 ms; TE, 3.0 ms; flip angle, 12°; matrix, 256 × 256 × 192; FOV, 240 × 240 mm; total acquisition time, 7 min and 4 s. For the remaining five subjects, the following scanning parameters were used: TR, 8 ms; TE, 3.1 ms, flip angle, 8°; matrix, 256 × 256 × 192, FOV 256 × 256 mm; acquisition time, 7 min and 24 s. Final reconstructed voxel size for all images was 1 × 1 × 1 mm.
2.3. Statistics
2.3.1. CATK algorithm validation
Intraclass correlation coefficients (ICCs) were used to measure the consistency or reproducibility of the manual cerebellar measurements compared to the CATK generated automated cerebellar measurement. ICCs were computed on the manual labelings of the 20 subjects with two separate scan sessions to assess the test–retest reliability of manual delineation (ICCs above 0.8 are considered excellent), and also on the CATK applied to the two separate scan session data to determine CATK test–retest reliability. ICCs were also computed over all four measurements (two manual, two CATK) on each cerebellar structure (total cerebellum, right and left hemispheres, three vermal lobes), to assess the agreement between manual and automated measures. We also computed the mean Dice Coefficient for each cerebellar measure for the two scan sessions of the same 20 subjects used to compute ICCs. The Dice Coefficient is a spatial overlap measure between CATK and gold-standard labeling, with 100% being perfect (Crum et al., 2005). Lastly, we computed the RMS mesh error (0 is perfect) between the CATK contours and manual contours.
2.3.2. Clinical application
ANOVA was used to compare the PAE and NC groups on measures of total cerebellar volume, left and right cerebellar hemisphere volumes, and mid-sagittal vermis lobe areas (anterior, superior posterior, posterior inferior). Microcephaly is a prominent feature of prenatal alcohol exposure. As a result, we hypothesized that all cerebellar size measures would be related to overall head size, but might be different between groups. We used the cranium size index calculated by FSL's SIENAX (Smith et al., 2002) for our measure of head size, as we have previously shown it to be an excellent surrogate for intracranial vault volume (Fein et al., 2004). Pearson correlations were used to assess the relationships between cranium size and cerebellar size in each group. Linear modeling was then used to determine if group differences in cerebellar size measures could be completely explained by head size and vice-versa.
3. Results
3.1. CATK algorithm validation
The test–retest ICCs for CATK were greater than 0.94 for all cerebellar volume and mid-sagittal vermal area measures, comparable or better than the test–retest ICCs for manual measurement (all ICCs > 0.92). The ICCs computed on all four cerebellar measurements (manual and CATK measures on the repeat scans) to compare comparability between measurements were above 0.97 for non-vermis parcels, while vermal mid-sagittal area ICCs were 0.90 for vermis I–V, 0.89 for vermis VI–VII, and 0.91 for vermis VIII–X. We obtained mean Dice overlaps of 90% for the full cerebellum and 91% for the hemispheres, and 72–79% for the vermal lobe volumes. The somewhat lower Dice Coefficients for the vermal lobes are attributed to their much smaller overall volume and difficulty estimating the lateral border. The mean Dice overlaps for the vermis mid-sagittal areas are much improved, ranging from 82 to 88%. The RMS mesh error (0 is perfect), which is not affected by overall volume, between the CATK contours and manual contours ranged from 1.2 to 1.8 voxels for all regions. Fig. 2 shows the excellent agreement between manual delineation and CATK automated delineation for total cerebellum volume and total vermis area, and Fig. 3 shows a side-by-side comparison of CATK and manual marking for a representative subject. These results demonstrate that CATK is an appropriate and validated method for cerebellar segmentation that has comparable accuracy to hand delineation.
Fig. 2.
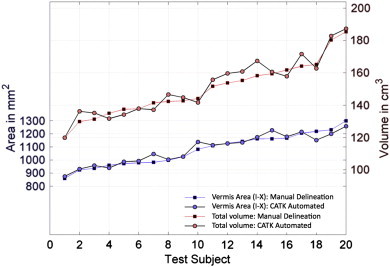
Comparison of manual delineation and automated delineation using the CATK on 20 subjects who were not used in training, for total cerebellar volume and total cerebellar vermis area.
Fig. 3.
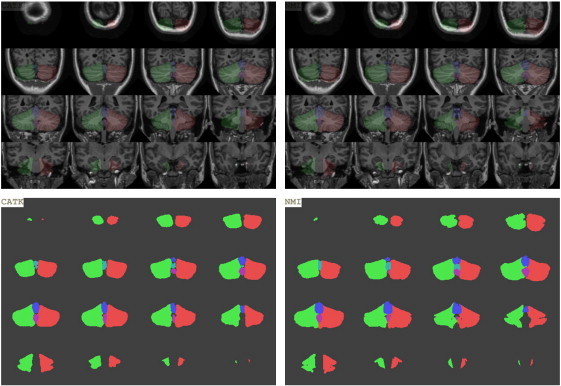
Illustration of automated delineation using CATK (left panel) and manual delineation (right panel) on a representative subject who was not used in training, for left and right cerebellar hemispheres and all vermal lobes. Top panel shows an overlay onto the T1-weighted image, while the bottom panel shows each parcel. Green: left cerebellum, red: right cerebellum, blue: vermis anterior lobe (lobules I–V), cyan: vermis superior posterior lobe (lobules VI–VII), magenta: vermis inferior posterior lobe (lobules VIII–X). (For interpretation of the references to colors in this figure legend, the reader is referred to the web version of this article.)
Fig. 4 shows three examples demonstrating CATK's fitting of 3D parcels to participants from this study. Good cerebellar parcellation is achieved on the adolescents, despite the majority of the training samples being adult or elderly subjects. In particular, CATK leads to good estimates of the cerebellum and vermis, even when the scans are of poor quality (Fig. 4, bottom panel).
Fig. 4.
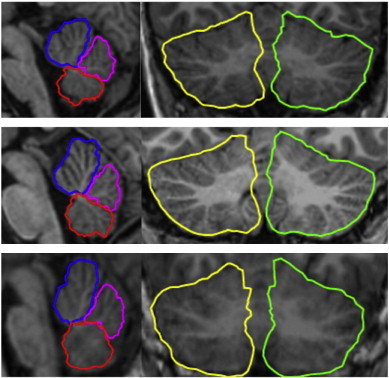
3D parcellation of: vermis anterior lobe (lobules I–V) blue; vermis superior posterior lobe (lobules VI–VII) magenta; vermis inferior posterior lobe (lobules VIII–X) red; hemispheres, yellow and green. The top and bottom panels show delineation in patients with histories of prenatal exposure to alcohol, the middle panel is from an age-matched control. The bottom example shows a good fit even for a scan of poor quality. (For interpretation of the references to colors in this figure legend, the reader is referred to the web version of this article.)
3.2. Clinical application to FASD
Thirteen PAE children and nine NC children had both complete motor assessments and structural imaging, and were included in the study. Two children with PAE had cerebellar herniation, an anatomical anomaly that was not well-delineated by CATK, and were excluded from further analysis of cerebellar measures. The remaining sample demographics were: 11 PAE (3 girls), 13.2 ± 2.4 years; 9 NC (3 girls), 12.8 ± 2.1 years.
When comparing the 11 PAE to 9 NC, the PAE group had smaller mean total cerebellum (10% smaller volume, p = 0.07), left cerebellar hemisphere volume (11% smaller, p = 0.05), and right cerebellar hemisphere volume (10% smaller, p = 0.07). The PAE group also had significantly smaller vermal mid-sagittal areas for the anterior lobe (19% smaller, p = 0.006) and the posterior inferior lobe (16% smaller, p = 0.002). Table 1 shows cerebellar volumes and mid-sagittal areas for the PAE and NC groups.
Table 1.
Cerebellar size measures for participants with prenatal alcohol exposure (PAE, n = 11) and normal controls (NC, n = 9). Bold values indicate p < 0.10.
| Region | PAE | NC | Group p-value |
Group p-value when covarying for cranium size ∗ group |
|---|---|---|---|---|
| Total volume | 125080 ± 18777 | 139251 ± 13048 | 0.072 | 0.051 |
| L hemisphere volume | 56533 ± 8158 | 63380 ± 6019 | 0.051 | 0.023 |
| R hemisphere volume | 57124 ± 8650 | 63823 ± 6088 | 0.066 | 0.022 |
| Anterior vermis (I–V) area | 355 ± 69 | 436 ± 49 | 0.006 | 0.038 |
| Superior posterior vermis (VI–VII) area | 223 ± 41 | 215 ± 24 | 0.631 | 0.901 |
| Inferior posterior vermis (VIII–X) area | 280 ± 37 | 334 ± 27 | 0.002 | 0.007 |
Head size was significantly smaller in the PAE group compared to the NC group (13% smaller, p = 0.01). Pearson correlations assessed the relationship between head size and cerebellar measures in each group separately. Within the PAE group, head size was highly correlated with all cerebellar size measures (r = 0.56–0.91, p < 0.001–0.08) except the mid-sagittal areas of the superior posterior lobe (r = 0.40, p = 0.22) and inferior posterior lobe (r = 0.50, p = 0.12). Within the NC group, head size was not significantly correlated with any cerebellar size measure (all p > 0.31) except the inferior posterior lobe (r = − 0.70, p = 0.04).
Linear modeling showed that differences in head size between groups disappeared when covarying for any cerebellar size measure. Linear modeling showed that the significance of the group differences in cerebellar volume measures (total cerebellum, left and right hemispheres) and mid-sagittal vermal areas (anterior and posterior inferior) remained or were enhanced after covarying for head size, as shown by the last column in Table 1.
4. Discussion
We present a novel, automated method for segmentation of the total cerebellum, left and right cerebellar hemispheres, and three lobes of the cerebellar vermis (lobules I–V, VI–VII, and VIII–X). We trained our method using 43 subjects ranging in age from 5 to 96, and showed impressive results when tested on a group of subjects ages 19–34 (who were not part of the training set). These results demonstrate excellent reliability and validity of CATK volume and mid-sagittal area measurements, compared to manual measurements. Our results also demonstrate excellent validity of CATK voxel classifications.
CATK worked without modification on all subjects reported in this paper. Like any automated segmentation method, however, it is not foolproof. In our recent experience applying the method to more than 300 scans of adults and adolescents, the method failed on less than 5% of images. Generally the errors were due to preprocessing failures of head orientation correction and cerebellum isolation. The major cause appeared to be due to errors in the original data where incorrect orientation labels were assigned in the image headers. Both types of errors result in obvious failures easily detected by the user. In some of our test cases used for validation, small regions of cerebral cortex are included in our cerebellar segmentation; despite this our validity measures were excellent. These errors in segmentation may limit the ease to which CATK can be integrated with whole brain analyses.
ANOVA analyses detected smaller cerebellar volumes and mid-sagittal areas, automatically measured using CATK, in PAE compared to controls. These results are in agreement with prior reports of smaller cerebellum in FAS and with previous studies that observed smaller mid-sagittal areas of the anterior lobe and posterior inferior lobes measured manually (O'Hare et al., 2005; Sowell et al., 1996). As with previous reports, we did not detect smaller mid-sagittal area in the superior inferior lobe (lobules VI–VII). The consistency of our results with manual tracing in a disease group adds to the validity of our automated cerebellar delineation method.
Compared to normal controls, we also found that children prenatally exposed to alcohol showed a smaller overall head size. Most cerebellar size measures were related to overall head size within the PAE group but not the NC group, such that group differences in overall head size were explained by cerebellar size measures. However, group differences in the cerebellar measures were not completely explained by head size, as shown by the last column of Table 1. These results suggest that 1) PAE-related microcephaly is strongly related to cerebellar hemispheric volumes, and 2) smaller cerebellar measures in FASD are not fully explained by microcephaly, and suggest an additional direct effect of prenatal alcohol exposure on the cerebellum.
A limitation of the current study is that we did not measure alcohol consumption in the adolescent sample studied. Given this, we cannot rule out the possibility that alcohol drinking in the PAE sample might be associated with the smaller cerebellar measurements in that group vs. controls (Lisdahl et al., 2013). However, the mean age of the participants was only 13 years, so it is possible that current drinking, if any, was minimal among all the children since only a small percentage of children have begun regular drinking before age 14 (Hingson et al., 2006). This analysis was also limited by the sample size, underscoring the need to replicate our results in a larger sample with a more inclusive age range than studied here. Even so, the findings of smaller head size, cerebellum volume, and mid-sagittal vermis areas were remarkably consistent with prior studies of independent samples, suggesting that our subjects were a representative sample of this population.
In conclusion, these data illustrate that our new technology for automatically delineating the cerebellum found specific volumetric reductions in a FASD sample that are consistent with prior studies that used labor intensive manual delineation. Further work will use CATK to delineate the cerebellum on a larger sample, and associate cerebellar size measures with measures of motor and cognitive function, to determine the effect of alcohol-related cerebellar damage on function.
Acknowledgments
This work was supported by the National Institutes of Health grants R43 AA021945, U01 AA014834, R01 AA019605, R01 AA010417, and T32 AA013525.
Footnotes
This is an open-access article distributed under the terms of the Creative Commons Attribution-NonCommercial-No Derivative Works License, which permits non-commercial use, distribution, and reproduction in any medium, provided the original author and source are credited.
References
- Andersen B.B. Reduction of Purkinje cell volume in cerebellum of alcoholics. Brain Res. 2004;1007:10–18. doi: 10.1016/j.brainres.2004.01.058. [DOI] [PubMed] [Google Scholar]
- Appollonio I.M., Grafman J., Schwartz V., Massaquoi S., Hallett M. Memory in patients with cerebellar degeneration. Neurology. 1993;43:1536–1544. doi: 10.1212/wnl.43.8.1536. [DOI] [PubMed] [Google Scholar]
- Archibald S.L., Fennema-Notestine C., Gamst A., Riley E.P., Mattson S.N., Jernigan T.L. Brain dysmorphology in individuals with severe prenatal alcohol exposure. Dev. Med. Child Neurol. 2001;43:148–154. [PubMed] [Google Scholar]
- Autti-Ramo I., Autti T., Korkman M., Kettunen S., Salonen O., Valanne L. MRI findings in children with school problems who had been exposed prenatally to alcohol. Dev. Med. Child Neurol. 2002;44:98–106. doi: 10.1017/s0012162201001748. [DOI] [PubMed] [Google Scholar]
- Baker K.G., Harding A.J., Halliday G.M., Kril J.J., Harper C.G. Neuronal loss in functional zones of the cerebellum of chronic alcoholics with and without Wernicke's encephalopathy. Neuroscience. 1999;91:429–438. doi: 10.1016/s0306-4522(98)90664-9. [DOI] [PubMed] [Google Scholar]
- Bauer-Moffett C., Altman J. Ethanol-induced reductions in cerebellar growth of infant rats. Exp. Neurol. 1975;48:378–382. doi: 10.1016/0014-4886(75)90164-8. [DOI] [PubMed] [Google Scholar]
- Berman K.F., Ostrem J.L., Randolph C., Gold J., Goldberg T.E., Coppola R., Carson R.E., Herscovitch P., Weinberger D.R. Physiological activation of a cortical network during performance of the Wisconsin card sorting test: a positron emission tomography study. Neuropsychologia. 1995;33:1027–1046. doi: 10.1016/0028-3932(95)00035-2. [DOI] [PubMed] [Google Scholar]
- Bookstein F.L., Streissguth A.P., Connor P.D., Sampson P.D. Damage to the human cerebellum from prenatal alcohol exposure: the anatomy of a simple biometrical explanation. Anat. Rec. B New Anat. 2006;289:195–209. doi: 10.1002/ar.b.20114. [DOI] [PubMed] [Google Scholar]
- Brambilla P., Hardan A., di Nemi S.U., Perez J., Soares J.C., Barale F. Brain anatomy and development in autism: review of structural MRI studies. Brain Res. Bull. 2003;61:557–569. doi: 10.1016/j.brainresbull.2003.06.001. [DOI] [PubMed] [Google Scholar]
- Cavanagh J.B., Holton J.L., Nolan C.C. Selective damage to the cerebellar vermis in chronic alcoholism: a contribution from neurotoxicology to an old problem of selective vulnerability. Neuropathol. Appl. Neurobiol. 1997;23:355–363. [PubMed] [Google Scholar]
- Cerasa A., Messina D., Nicoletti G., Novellino F., Lanza P., Condino F., Arabia G., Salsone M., Quattrone A. Cerebellar atrophy in essential tremor using an automated segmentation method. AJNR Am. J. Neuroradiol. 2009;30:1240–1243. doi: 10.3174/ajnr.A1544. [DOI] [PMC free article] [PubMed] [Google Scholar]
- Clarren S.K., Alvord E.C., Jr., Sumi S.M., Streissguth A.P., Smith D.W. Brain malformations related to prenatal exposure to ethanol. J. Pediatr. 1978;92:64–67. doi: 10.1016/s0022-3476(78)80072-9. [DOI] [PubMed] [Google Scholar]
- Connor P.D., Sampson P.D., Streissguth A.P., Bookstein F.L., Barr H.M. Effects of prenatal alcohol exposure on fine motor coordination and balance: a study of two adult samples. Neuropsychologia. 2006;44:744–751. doi: 10.1016/j.neuropsychologia.2005.07.016. [DOI] [PubMed] [Google Scholar]
- Cootes T. Oxford University Press; Oxford: 2000. An Introduction to Active Shape Models, in Image Processing and Analysis. [Google Scholar]
- Cootes T.F., Edwards G.J., Taylor C.J. Active appearence models. Trans. Pattern Anal. Mach. Intell. 2001;23:681–685. [Google Scholar]
- Crum W.R., Camara O., Rueckert D., Bhatia K.K., Jenkinson M., Hill D.L. Generalised overlap measures for assessment of pairwise and groupwise image registration and segmentation. Med. Image Comput. Comput. Assist. Interv. 2005;8:99–106. doi: 10.1007/11566465_13. [DOI] [PubMed] [Google Scholar]
- Debaere F., Wenderoth N., Sunaert S., Van Hecke P., Swinnen S.P. Cerebellar and premotor function in bimanual coordination: parametric neural responses to spatiotemporal complexity and cycling frequency. Neuroimage. 2004;21:1416–1427. doi: 10.1016/j.neuroimage.2003.12.011. [DOI] [PubMed] [Google Scholar]
- Diedrichsen J., Balsters J.H., Flavell J., Cussans E., Ramnani N. A probabilistic MR atlas of the human cerebellum. Neuroimage. 2009;46:39–46. doi: 10.1016/j.neuroimage.2009.01.045. [DOI] [PubMed] [Google Scholar]
- Fein G., Di Sclafani V., Taylor C., Moon K., Barakos J., Tran H., Landman B., Shumway R. Controlling for premorbid brain size in imaging studies: T1-derived cranium scaling factor vs. T2-derived intracranial vault volume. Psychiatry Res. 2004;131:169–176. doi: 10.1016/j.pscychresns.2003.10.003. [DOI] [PubMed] [Google Scholar]
- Fiez J.A., Raife E.A., Balota D.A., Schwarz J.P., Raichle M.E., Petersen S.E. A positron emission tomography study of the short-term maintenance of verbal information. J. Neurosci. 1996;16:808–822. doi: 10.1523/JNEUROSCI.16-02-00808.1996. [DOI] [PMC free article] [PubMed] [Google Scholar]
- Goodlett C.R., Hamre K.M., West J.R. Regional differences in the timing of dendritic outgrowth of Purkinje cells in the vermal cerebellum demonstrated by MAP2 immunocytochemistry. Brain Res. Dev. Brain Res. 1990;53:131–134. doi: 10.1016/0165-3806(90)90133-j. [DOI] [PubMed] [Google Scholar]
- Goodlett C.R., Marcussen B.L., West J.R. A single day of alcohol exposure during the brain growth spurt induces brain weight restriction and cerebellar Purkinje cell loss. Alcohol. 1990;7:107–114. doi: 10.1016/0741-8329(90)90070-s. [DOI] [PubMed] [Google Scholar]
- Hamre K.M., West J.R. The effects of the timing of ethanol exposure during the brain growth spurt on the number of cerebellar Purkinje and granule cell nuclear profiles. Alcohol. Clin. Exp. Res. 1993;17:610–622. doi: 10.1111/j.1530-0277.1993.tb00808.x. [DOI] [PubMed] [Google Scholar]
- Haralick R., Shanmugam K., Distein I. Textural features for image classification. IEEE Trans. Syst. Man Cybern. 1973;SMC-3:610–621. [Google Scholar]
- Hingson R.W., Heeren T., Winter M.R. Age at drinking onset and alcohol dependence: age at onset, duration, and severity. Arch. Pediatr. Adolesc. Med. 2006;160:739–746. doi: 10.1001/archpedi.160.7.739. [DOI] [PubMed] [Google Scholar]
- Hwang J., Kim J., Han Y., Park H. An automatic cerebellum extraction method in T1-weighted brain MR images using an active contour model with a shape prior. Magn. Reson. Imaging. 2011;29:1014–1022. doi: 10.1016/j.mri.2011.01.005. [DOI] [PubMed] [Google Scholar]
- Jones K.L., Smith D.W., Ulleland C.N., Streissguth P. Pattern of malformation in offspring of chronic alcoholic mothers. Lancet. 1973;1:1267–1271. doi: 10.1016/s0140-6736(73)91291-9. [DOI] [PubMed] [Google Scholar]
- Jones K.L., Robinson L.K., Bakhireva L.N., Marintcheva G., Storojev V., Strahova A., Sergeevskaya S., Budantseva S., Mattson S.N., Riley E.P., Chambers C.D. Accuracy of the diagnosis of physical features of fetal alcohol syndrome by pediatricians after specialized training. Pediatrics. 2006;118:e1734–e1738. doi: 10.1542/peds.2006-1037. [DOI] [PubMed] [Google Scholar]
- Kuehn D., Aros S., Cassorla F., Avaria M., Unanue N., Henriquez C., Kleinsteuber K., Conca B., Avila A., Carter T.C., Conley M.R., Troendle J., Mills J.L. A prospective cohort study of the prevalence of growth, facial, and central nervous system abnormalities in children with heavy prenatal alcohol exposure. Alcohol. Clin. Exp. Res. 2012;36:1811–1819. doi: 10.1111/j.1530-0277.2012.01794.x. [DOI] [PMC free article] [PubMed] [Google Scholar]
- Lisdahl K.M., Thayer R., Squeglia L.M., McQueeny T.M., Tapert S.F. Recent binge drinking predicts smaller cerebellar volumes in adolescents. Psychiatry Res. 2013;211:17–23. doi: 10.1016/j.pscychresns.2012.07.009. [DOI] [PMC free article] [PubMed] [Google Scholar]
- Maier S.E., Miller J.A., Blackwell J.M., West J.R. Fetal alcohol exposure and temporal vulnerability: regional differences in cell loss as a function of the timing of binge-like alcohol exposure during brain development. Alcohol. Clin. Exp. Res. 1999;23:726–734. doi: 10.1111/j.1530-0277.1999.tb04176.x. [DOI] [PubMed] [Google Scholar]
- Mattson S.N., Riley E.P., Jernigan T.L., Ehlers C.L., Delis D.C., Jones K.L., Stern C., Johnson K.A., Hesselink J.R., Bellugi U. Fetal alcohol syndrome: a case report of neuropsychological, MRI and EEG assessment of two children. Alcohol. Clin. Exp. Res. 1992;16:1001–1003. doi: 10.1111/j.1530-0277.1992.tb01909.x. [DOI] [PubMed] [Google Scholar]
- Mattson S.N., Riley E.P., Jernigan T.L., Garcia A., Kaneko W.M., Ehlers C.L., Jones K.L. A decrease in the size of the basal ganglia following prenatal alcohol exposure: a preliminary report. Neurotoxicol. Teratol. 1994;16:283–289. doi: 10.1016/0892-0362(94)90050-7. [DOI] [PubMed] [Google Scholar]
- Mattson S.N., Foroud T., Sowell E.R., Jones K.L., Coles C.D., Fagerlund A., Autti-Ramo I., May P.A., Adnams C.M., Konovalova V., Wetherill L., Arenson A.D., Barnett W.K., Riley E.P. Collaborative initiative on fetal alcohol spectrum disorders: methodology of clinical projects. Alcohol. 2010;44:635–641. doi: 10.1016/j.alcohol.2009.08.005. [DOI] [PMC free article] [PubMed] [Google Scholar]
- Mattson S.N., Crocker N., Nguyen T.T. Fetal alcohol spectrum disorders: neuropsychological and behavioral features. Neuropsychol. Rev. 2011;21:81–101. doi: 10.1007/s11065-011-9167-9. [DOI] [PMC free article] [PubMed] [Google Scholar]
- Mattson S.N., Roesch S.C., Glass L., Deweese B.N., Coles C.D., Kable J.A., May P.A., Kalberg W.O., Sowell E.R., Adnams C.M., Jones K.L., Riley E.P., CIFASD Further development of a neurobehavioral profile of fetal alcohol spectrum disorders. Alcohol. Clin. Exp. Res. 2013;37:517–528. doi: 10.1111/j.1530-0277.2012.01952.x. [DOI] [PMC free article] [PubMed] [Google Scholar]
- Nguyen T.T., Ashrafi A., Thomas J.D., Riley E.P., Simmons R.W. Children with heavy prenatal alcohol exposure have different frequency domain signal characteristics when producing isometric force. Neurotoxicol. Teratol. 2013;35:14–20. doi: 10.1016/j.ntt.2012.11.003. [DOI] [PMC free article] [PubMed] [Google Scholar]
- Nguyen T.T., Levy S.S., Riley E.P., Thomas J.D., Simmons R.W. Children with heavy prenatal alcohol exposure experience reduced control of isotonic force. Alcohol. Clin. Exp. Res. 2013;37:315–324. doi: 10.1111/j.1530-0277.2012.01896.x. [DOI] [PMC free article] [PubMed] [Google Scholar]
- O'Hare E.D., Kan E., Yoshii J., Mattson S.N., Riley E.P., Thompson P.M., Toga A.W., Sowell E.R. Mapping cerebellar vermal morphology and cognitive correlates in prenatal alcohol exposure. Neuroreport. 2005;16:1285–1290. doi: 10.1097/01.wnr.0000176515.11723.a2. [DOI] [PubMed] [Google Scholar]
- Patenaude B.M. University of Oxford; Oxford: 2007. Bayesian Statistical Models of Shape and Appearance for Subcortical Brain Segmentation. [DOI] [PMC free article] [PubMed] [Google Scholar]
- Peiffer J., Majewski F., Fischbach H., Bierich J.R., Volk B. Alcohol embryo- and fetopathy. Neuropathology of 3 children and 3 fetuses. J. Neurol. Sci. 1979;41:125–137. doi: 10.1016/0022-510x(79)90033-9. [DOI] [PubMed] [Google Scholar]
- Phillips S.C., Cragg B.G. A change in susceptibility of rat cerebellar Purkinje cells to damage by alcohol during fetal, neonatal and adult life. Neuropathol. Appl. Neurobiol. 1982;8:441–454. doi: 10.1111/j.1365-2990.1982.tb00312.x. [DOI] [PubMed] [Google Scholar]
- Powell S., Magnotta V.A., Johnson H., Jammalamadaka V.K., Pierson R., Andreasen N.C. Registration and machine learning-based automated segmentation of subcortical and cerebellar brain structures. Neuroimage. 2008;39:238–247. doi: 10.1016/j.neuroimage.2007.05.063. [DOI] [PMC free article] [PubMed] [Google Scholar]
- Raichle M.E., Fiez J.A., Videen T.O., MacLeod A.M., Pardo J.V., Fox P.T., Petersen S.E. Practice-related changes in human brain functional anatomy during nonmotor learning. Cereb. Cortex. 1994;4:8–26. doi: 10.1093/cercor/4.1.8. [DOI] [PubMed] [Google Scholar]
- Ramadoss J., Lunde E.R., Chen W.J., West J.R., Cudd T.A. Temporal vulnerability of fetal cerebellar Purkinje cells to chronic binge alcohol exposure: ovine model. Alcohol. Clin. Exp. Res. 2007;31:1738–1745. doi: 10.1111/j.1530-0277.2007.00477.x. [DOI] [PubMed] [Google Scholar]
- Roebuck T.M., Simmons R.W., Mattson S.N., Riley E.P. Prenatal exposure to alcohol affects the ability to maintain postural balance. Alcohol. Clin. Exp. Res. 1998;22:252–258. [PubMed] [Google Scholar]
- Roebuck T.M., Simmons R.W., Richardson C., Mattson S.N., Riley E.P. Neuromuscular responses to disturbance of balance in children with prenatal exposure to alcohol. Alcohol. Clin. Exp. Res. 1998;22:1992–1997. [PubMed] [Google Scholar]
- Rohlfing T., Zahr N.M., Sullivan E.V., Pfefferbaum A. The SRI24 multichannel atlas of normal adult human brain structure. Hum. Brain Mapp. 2010;31:798–819. doi: 10.1002/hbm.20906. [DOI] [PMC free article] [PubMed] [Google Scholar]
- Schlosser R., Hutchinson M., Joseffer S., Rusinek H., Saarimaki A., Stevenson J., Dewey S.L., Brodie J.D. Functional magnetic resonance imaging of human brain activity in a verbal fluency task. J. Neurol. Neurosurg. Psychiatry. 1998;64:492–498. doi: 10.1136/jnnp.64.4.492. [DOI] [PMC free article] [PubMed] [Google Scholar]
- Scott J.A., Schumann C.M., Goodlin-Jones B.L., Amaral D.G. A comprehensive volumetric analysis of the cerebellum in children and adolescents with autism spectrum disorder. Autism Res. 2009;2:246–257. doi: 10.1002/aur.97. [DOI] [PMC free article] [PubMed] [Google Scholar]
- Sharma N., Aggarwal L.M. Automated medical image segmentation techniques. J. Med. Phys. 2010;35:3–14. doi: 10.4103/0971-6203.58777. [DOI] [PMC free article] [PubMed] [Google Scholar]
- Simmons R.W., Thomas J.D., Levy S.S., Riley E.P. Motor response programming and movement time in children with heavy prenatal alcohol exposure. Alcohol. 2010;44:371–378. doi: 10.1016/j.alcohol.2010.02.013. [DOI] [PMC free article] [PubMed] [Google Scholar]
- Simmons R.W., Nguyen T.T., Levy S.S., Thomas J.D., Mattson S.N., Riley E.P. Children with heavy prenatal alcohol exposure exhibit deficits when regulating isometric force. Alcohol. Clin. Exp. Res. 2012;36:302–309. doi: 10.1111/j.1530-0277.2011.01625.x. [DOI] [PMC free article] [PubMed] [Google Scholar]
- Smith S.M., Zhang Y., Jenkinson M., Chen J., Matthews P.M., Federico A., De Stefano N. Accurate, robust, and automated longitudinal and cross-sectional brain change analysis. Neuroimage. 2002;17:479–489. doi: 10.1006/nimg.2002.1040. [DOI] [PubMed] [Google Scholar]
- Sowell E.R., Jernigan T.L., Mattson S.N., Riley E.P., Sobel D.F., Jones K.L. Abnormal development of the cerebellar vermis in children prenatally exposed to alcohol: size reduction in lobules I–V. Alcohol. Clin. Exp. Res. 1996;20:31–34. doi: 10.1111/j.1530-0277.1996.tb01039.x. [DOI] [PubMed] [Google Scholar]
- Tam E.W., Miller S.P., Studholme C., Chau V., Glidden D., Poskitt K.J., Ferriero D.M., Barkovich A.J. Differential effects of intraventricular hemorrhage and white matter injury on preterm cerebellar growth. J. Pediatr. 2011;158:366–371. doi: 10.1016/j.jpeds.2010.09.005. [DOI] [PMC free article] [PubMed] [Google Scholar]
- Tamagni C., Mondadori C.R., Valko P.O., Brugger P., Schuknecht B., Linnebank M. Cerebellum and source memory. Eur. Neurol. 2010;63:234–236. doi: 10.1159/000282277. [DOI] [PubMed] [Google Scholar]
- Thomas J.D., Goodlett C.R., West J.R. Alcohol-induced Purkinje cell loss depends on developmental timing of alcohol exposure and correlates with motor performance. Brain Res. Dev. Brain Res. 1998;105:159–166. doi: 10.1016/s0165-3806(97)00164-8. [DOI] [PubMed] [Google Scholar]
- van der Lijn F., de Bruijne M., Klein S., den Heijer T., Hoogendam Y.Y., van der Lugt A., Breteler M.M., Niessen W.J. Automated brain structure segmentation based on atlas registration and appearance models. IEEE Trans. Med. Imaging. 2012;31:276–286. doi: 10.1109/TMI.2011.2168420. [DOI] [PubMed] [Google Scholar]
- Vaurio L., Riley E.P., Mattson S.N. Neuropsychological comparison of children with heavy prenatal alcohol exposure and an IQ-matched comparison group. J. Int. Neuropsychol. Soc. 2011:1–11. doi: 10.1017/S1355617711000063. [DOI] [PMC free article] [PubMed] [Google Scholar]
- Webb S.J., Sparks B.F., Friedman S.D., Shaw D.W., Giedd J., Dawson G., Dager S.R. Cerebellar vermal volumes and behavioral correlates in children with autism spectrum disorder. Psychiatry Res. 2009;172:61–67. doi: 10.1016/j.pscychresns.2008.06.001. [DOI] [PMC free article] [PubMed] [Google Scholar]
- Weier K., Beck A., Magon S., Amann M., Naegelin Y., Penner I.K., Thurling M., Aurich V., Derfuss T., Radue E.W., Stippich C., Kappos L., Timmann D., Sprenger T. Evaluation of a new approach for semi-automatic segmentation of the cerebellum in patients with multiple sclerosis. J. Neurol. 2012;259:2673–2680. doi: 10.1007/s00415-012-6569-4. [DOI] [PubMed] [Google Scholar]
- Wisniewski K., Dambska M., Sher J.H., Qazi Q. A clinical neuropathological study of the fetal alcohol syndrome. Neuropediatrics. 1983;14:197–201. doi: 10.1055/s-2008-1059578. [DOI] [PubMed] [Google Scholar]
- Woods R.P., Grafton S.T., Holmes C.J., Cherry S.R., Mazziotta J.C. Automated image registration: I. General methods and intrasubject, intramodality validation. J. Comput. Assist. Tomogr. 1998:139–152. doi: 10.1097/00004728-199801000-00027. [DOI] [PubMed] [Google Scholar]
- Woods R.P., Grafton S.T., Watson J.D.G., Sicotte N.L., Mazziotta J.C. Automated image registration: II. Intersubject validation of linear and nonlinear models. J. Comput. Assist. Tomogr. 1998:153–165. doi: 10.1097/00004728-199801000-00028. [DOI] [PubMed] [Google Scholar]
- Zhao L., Ruotsalainen U., Hirvonen J., Hietala J., Tohka J. Automatic cerebral and cerebellar hemisphere segmentation in 3D MRI: adaptive disconnection algorithm. Med. Image Anal. 2010;14:360–372. doi: 10.1016/j.media.2010.02.001. [DOI] [PubMed] [Google Scholar]