

Abstract
A common application of fluorescent proteins is to label whole cells, but many red fluorescent proteins are cytotoxic when used with standard high-level expression systems. We engineered a rapidly maturing tetrameric fluorescent protein called DsRed-Express2 that shows minimal cytotoxicity. DsRed-Express2 exhibits strong and stable expression in bacterial and mammalian cells, and it outperforms other available red fluorescent proteins with regard to photostability and phototoxicity.
Fluorescent proteins can be used as whole-cell labels or as fusion tags1. Enhanced GFP (EGFP) and its monomeric derivative mEGFP are suitable for either purpose. Oligomeric red fluorescent proteins have been engineered as whole-cell labels. For example, DsRed was modified to create DsRed-Express2; eqFP578 was modified to create TurboRFP3 and Katushka4; and eqFP611 was modified to create RFP6115. Monomeric red fluorescent proteins have also been engineered. For example, DsRed-Express was modified to create DsRed-Monomer6 as well as mCherry and tdTomato7; Kusabira-Orange was modified to generate mKO28; TurboRFP was modified to generate TagRFP3 and TagRFP-S158T9; and Katushka was modified to generate mKate4.
Despite this abundance of options, the usage of red fluorescent proteins as whole-cell labels has been limited by cytotoxicity. Whole-cell labeling typically employs strong promoters, and cells containing high levels of fluorescent proteins may show growth defects and/or instability of the fluorescent protein markers10,11. We therefore set out to engineer an improved red fluorescent protein for whole-cell labeling.
Cytotoxicity was evaluated for mEGFP plus 11 red fluorescent proteins. During constitutive high-level expression in E. coli, mEGFP was well tolerated but the red fluorescent proteins showed moderate to severe cytotoxicity as judged by colony size (Supplementary Fig. 1 online). To assess cytotoxicity in HeLa cells, we expressed fluorescent proteins by transient transfection with a standard plasmid containing the strong CMV promoter. Viable fluorescent cells were analyzed by flow cytometry at daily intervals after transfection. For mEGFP, average cellular fluorescence remained nearly constant from 24 h to 120 h (Fig. 1a). By contrast, all of the red fluorescent proteins showed progressive declines in average fluorescence (Fig. 1a) due to preferential loss of the most highly expressing cells (Supplementary Fig. 2 online). Expression of red fluorescent proteins caused many cells to detach from the growth surface (data not shown), further indicating cytotoxicity.
Figure 1.
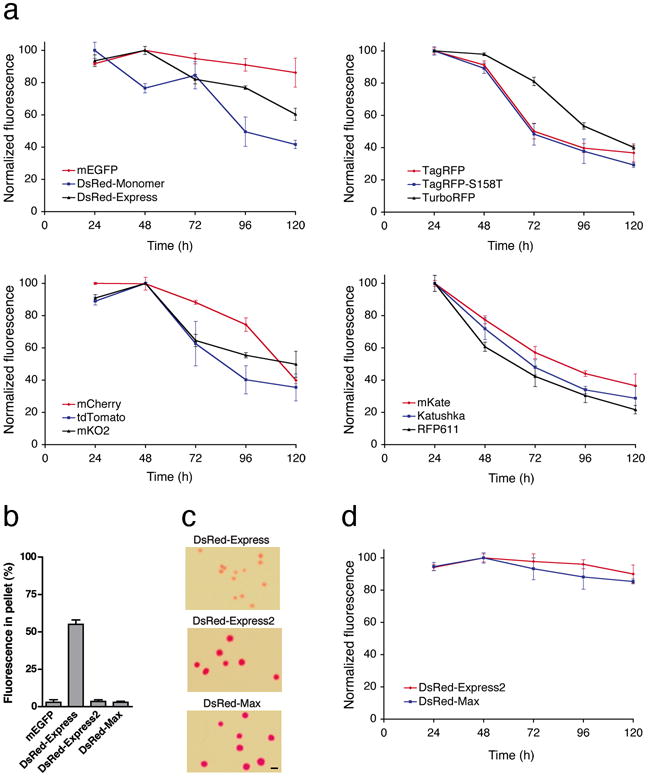
Overcoming the cytotoxicity of red fluorescent proteins. (a) Many red fluorescent proteins are cytotoxic. HeLa cells were transiently transfected for constitutive high-level expression of the indicated fluorescent proteins. At daily time points, three wells for each fluorescent protein were analyzed by flow cytometry to measure the average signal from the viable fluorescent cells. The strongest signal obtained for a given fluorescent protein was defined as 100 units. Bars represent s.e.m. For clarity, the results are shown in four separate panels. (b) Eliminating the higher-order aggregation of DsRed-Express. For each indicated fluorescent protein, percent fluorescence in the pellet from a bacterial lysate is plotted as mean and s.e.m. for eight independent replicates. The signal with mEGFP represents background in the assay. (c) The new fluorescent proteins are minimally cytotoxic in bacteria. E. coli cells were transformed with plasmids for constitutive expression of DsRed-Express, DsRed-Express2, or DsRed-Max, and were grown overnight on adjacent sectors of a Petri plate. Equally sized representative areas are shown. Scale bar, 1 mm. (d) The new fluorescent proteins are minimally cytotoxic in mammalian cells. As in (a), HeLa cells were transiently transfected for expression of DsRed-Express2 or DsRed-Max.
To generate a non-cytotoxic red fluorescent protein, we decided to modify an existing protein that showed fast maturation and high photostability. Among the 11 red fluorescent proteins tested, DsRed-Express, Katushka, and mCherry matured the fastest (Supplementary Table 1 and Supplementary Fig. 3a online). Photostability was assessed using a simple assay involving illumination through an epifluorescence microscope at a fixed light intensity (Supplementary Fig. 3b online), because this configuration mimics the typical experience for many researchers. DsRed-Express was by far the most photostable of the red fluorescent proteins (Supplementary Table 1 online). We therefore chose DsRed-Express as the starting point.
The cytotoxicity of DsRed-Express may stem from aggregation11. We measured aggregation using an assay in which bacteria expressing a fluorescent protein were lysed and centrifuged2. With DsRed-Express, >50% of the fluorescence was in the pellet (Fig. 1b). Directed evolution of the protein surface (Supplementary Figs. 4 and 5 and Supplementary Tables 2-5 online) yielded DsRed-Express2, which retained the favorable fluorescence properties of DsRed-Express but was as soluble as mEGFP during bacterial extraction (Fig. 1b).
Further mutagenesis produced DsRed-Max, which was ∼30% brighter than DsRed-Express2 while retaining high solubility (Fig. 1b). Compared to DsRed-Express2, DsRed-Max had even lower green emission (Supplementary Fig. 6 online), but was slower to mature and more photolabile (Supplementary Fig. 7 and Supplementary Table 1 online). DsRed-Max should be useful when brightness and/or pure red emission are of paramount importance.
E. coli cells constitutively expressing DsRed-Express2 or DsRed-Max produced large colonies similar to those obtained with mEGFP (Fig. 1c). Transiently transfected HeLa cells expressing DsRed-Express2 or DsRed-Max maintained nearly constant average fluorescence (Fig. 1d), and the highly expressing cells remained viable (Supplementary Fig. 2 online). Thus, with both bacterial and mammalian plasmid expression vectors, DsRed-Express2 and DsRed-Max are tolerated better than any of the other red fluorescent proteins tested.
For mammalian cells, an alternative to plasmid-based expression is retroviral transduction, which yields long-term expression at moderately high levels12. We used a commercial lentiviral system to compare DsRed-Express2 with five other red fluorescent proteins plus mEGFP. HeLa cells were transduced using the same lentiviral titer for each fluorescent protein, and then viable fluorescent cells were analyzed by flow cytometry after 3 or 10 days. At Day 3, the fluorescence signal over background was stronger for DsRed-Express2 than for any other red fluorescent protein (Fig. 2a). At Day 10, the average fluorescence intensity was nearly unchanged for mEGFP and DsRed-Express2, but had dropped substantially for the other fluorescent proteins, presumably due to loss of the most highly expressing cells. This interpretation was supported by counting the percentage of viable cells that were fluorescent. Between Day 3 and Day 10, this percentage was nearly unchanged for mEGFP and DsRed-Express2, but dropped substantially for the other fluorescent proteins (Fig. 2b). Even at Day 3, relatively few fluorescent cells were observed with DsRed-Monomer, TagRFP, and TurboRFP, possibly reflecting cytotoxicity at early stages of expression. In a separate experiment, lentivirally transduced HeLa cells containing DsRed-Express showed a lag in growth compared to cells containing DsRed-Express2 or mEGFP (Fig. 2c). Our data confirm that with standard cell culture expression vectors, fluorescent protein cytotoxicity is an important problem that can be overcome by using DsRed-Express2.
Figure 2.
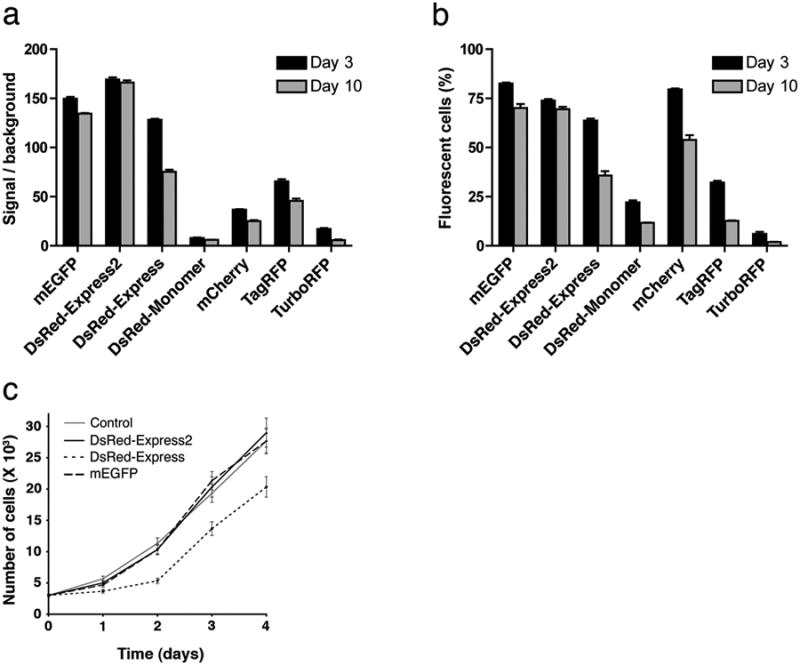
Fluorescent protein cytotoxicity after lentiviral transduction. (a) HeLa cells were transduced with lentiviruses encoding the indicated fluorescent proteins, or with a control lentivirus lacking a fluorescent protein gene. At 3 and 10 days after transduction, three wells for each fluorescent protein were analyzed by flow cytometry. Fluorescence from viable cells was detected using a 488-nm laser and a FITC filter set (mEGFP) or a 543-nm laser and a PE filter set (red fluorescent proteins). Plotted are the average fluorescence signals relative to the control lentivirus background, with s.e.m. (b) The data in (a) were used to determine the percentage of viable cells that were fluorescent. (c) In a separate experiment, cells were lentivirally transduced to express the indicated fluorescent proteins. At 3 days after transduction, fluorescent cells were sorted and grown in culture, in parallel with unsorted cells that had been transduced with a control lentivirus lacking a fluorescent protein gene. The number of cells was counted by microscopy at daily intervals. Bars indicate s.e.m.
We wanted to test DsRed-Express2 in a context where fluorescent protein cytotoxicity had previously hindered an experimental analysis. A suitable system was suggested by a report11 in which murine bone marrow cells were retrovirally transduced to express either EGFP or DsRed-Express, and were then grown in vitro under culture conditions that favored the preservation and growth of hematopoietic stem and progenitor cells. The cells containing EGFP grew robustly while those containing DsRed-Express did not. Here, murine bone marrow cells were retrovirally transduced with DsRed-Express, DsRed-Express2, or EGFP. Viable fluorescent cells were collected by flow cytometry at 87 h post-transduction (Day 0), and then individual cultures were started with 20,000 cells. For each culture we recorded the total cell number and the number of fluorescent cells after 3, 6, and 10 days. At Day 0, the cells containing DsRed-Express2 were more abundant, and were on average twice as bright as those containing DsRed-Express (Fig. 3a). The cells containing DsRed-Express2 proliferated to the same degree as those containing EGFP, but the cells containing DsRed-Express proliferated much less (Fig. 3b). These data are similar to the results with HeLa cells. We conclude that DsRed-Express2 is minimally cytotoxic in a variety of cell types.
Figure 3.
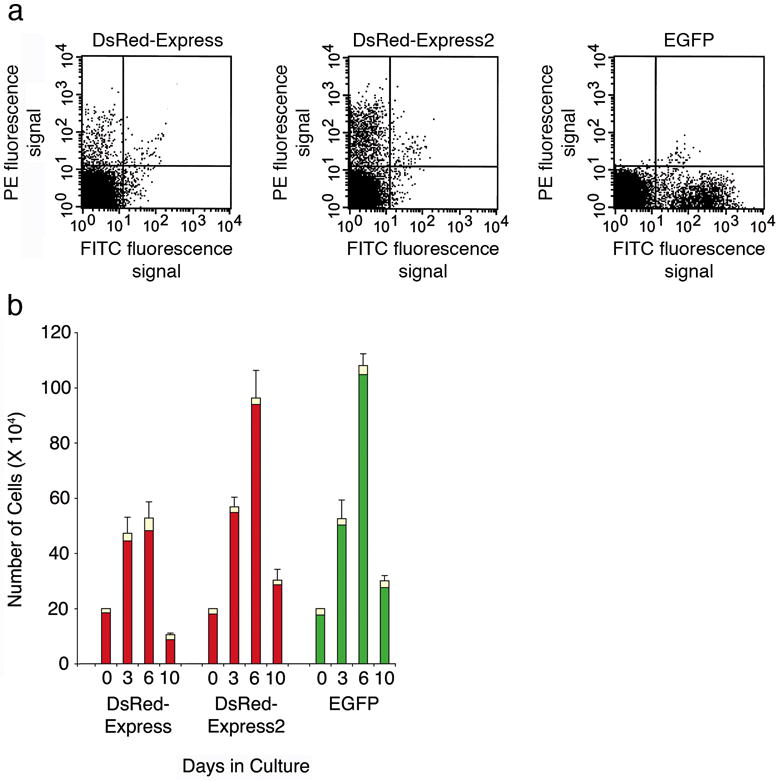
Robust growth of murine bone marrow hematopoietic stem and progenitor cells expressing DsRed-Express2. (a) Flow cytometry of retrovirally transduced cells. Mononuclear bone marrow cells were transduced with retroviral vectors encoding DsRed-Express, DsRed-Express2, or EGFP, and fluorescent cells were sorted after 87 h. Red and green fluorescence signals were detected using PE and FITC filter sets, respectively. The lines represent gates defined by analyzing untransduced cells. (b) Sorted cells from (a) were cultured under conditions favoring preservation and growth of hematopoietic stem cells, and the cultures were analyzed by flow cytometry after 3, 6, and 10 days. Bars represent mean and s.d. Green and red indicate fluorescent cell number, and yellow indicates non-fluorescent cell number. The decrease in total cell number at day 10 is not fluorescent protein-related, but reflects senescence that is routinely observed under in vitro conditions11.
DsRed-Express2 has additional advantages. It is excited efficiently by both the blue and green lasers that are routinely used in flow cytometers. In bacteria, DsRed-Express2 is expressed from the endogenous start codon much more strongly than DsRed-Express (Supplementary Fig. 4 online). Another important property is phototoxicity, which has only rarely been measured for engineered fluorescent proteins. Our results indicate that DsRed-Express2 has low phototoxicity (Supplementary Fig. 8 online). Thus, for whole-cell labeling, DsRed-Express2 is the red fluorescent protein of choice.
DsRed-Express2 is likely to be well tolerated in transgenic organisms. Although the previously available red fluorescent proteins have been used successfully to generate fluorescent animals4,13,14, those findings probably reflect a threshold effect in which a cytotoxic fluorescent protein is tolerated up to a certain concentration. We suspect that the transgenes in earlier studies were expressed at relatively low levels and may sometimes have caused residual cytotoxicity. DsRed-Express2 should facilitate the production of healthy transgenic organisms with strong and stable red fluorescence. Similar improvements can be expected when fluorescent cells are transplanted into animal hosts15. For example, when retrovirally transduced mouse hematopoietic stem cells were transplanted into mice, cells expressing EGFP were maintained while those expressing DsRed-Express were progressively lost11. This result suggests that cytotoxicity in cultured cells can predict the behavior of a fluorescent protein in vivo.
Because DsRed-Express2 and DsRed-Max are tetramers, they are best suited to labeling whole cells rather than making fusion proteins. Future modifications of the chromophore environment of these fluorescent proteins should enable us to create additional non-cytotoxic whole-cell labels.
Supplementary Material
Supplementary Figure 1 High-level expression of red fluorescent proteins is toxic to bacteria.
Supplementary Figure 2 Fluorescence intensity distributions of HeLa cells transiently transfected with fluorescent proteins.
Supplementary Figure 3 Fluorescence maturation and photobleaching kinetics of five representative red fluorescent proteins.
Supplementary Figure 4 Substitutions in codons 2-4 increase DsRed expression in E. coli.
Supplementary Figure 5 Crystal packing arrangements of DsRed tetramers.
Supplementary Figure 6 Fluorescence properties of the new DsRed variants.
Supplementary Figure 7 Photobleaching kinetics of the new DsRed variants.
Supplementary Figure 8 Phototoxicity of fluorescent proteins in E. coli and yeast.
Supplementary Table 1 Properties of red fluorescent proteins.
Supplementary Table 2 Substitutions made during the creation of DsRed-Express2 and DsRed-Max.
Supplementary Table 3 Residues targeted from crystal packing analysis.
Supplementary Table 4 Data collection and refinement statistics for DsRed-Max.
Supplementary Table 5 Protein crystal statistics for DsRed tetramers.
Acknowledgments
Thanks for technical assistance to J. Jureller and the Institute for Biophysical Dynamics NanoBiology Facility at The University of Chicago, and to The University of Chicago Flow Cytometry Facility and The Indiana University Simon Cancer Center Flow Cytometry Resource Facility. We also thank R. Tsien (University of California at San Diego) for providing mCherry and tdTomato, J. Wiedenmann (University of Ulm) for providing RFP611, S. Crosson for use of the spectrophotometer, G. Elder for helpful discussion, and members of the Glick and Keenan labs for feedback on the manuscript. This work was supported by NIH grants R01 EB008087 (to B.S.G. and R.J.K.), T32 GM007183 (to R.L.S.), and R01 HL56416, R01 HL67384, and a project in P01 HL53586 (to H.E.B.).
Footnotes
References
- 1.Shaner NC, Patterson GH, Davidson MW. J Cell Sci. 2007;120:4247–4260. doi: 10.1242/jcs.005801. [DOI] [PubMed] [Google Scholar]
- 2.Bevis BJ, Glick BS. Nat Biotechnol. 2002;20:83–87. doi: 10.1038/nbt0102-83. [DOI] [PubMed] [Google Scholar]
- 3.Merzlyak EM, et al. Nat Methods. 2007;4:555–557. doi: 10.1038/nmeth1062. [DOI] [PubMed] [Google Scholar]
- 4.Shcherbo D, et al. Nat Methods. 2007;4:741–746. doi: 10.1038/nmeth1083. [DOI] [PubMed] [Google Scholar]
- 5.Kredel S, et al. Chem Biol. 2008;15:224–233. doi: 10.1016/j.chembiol.2008.02.008. [DOI] [PubMed] [Google Scholar]
- 6.Strongin DE, et al. Protein Eng Des Sel. 2007;20:525–534. doi: 10.1093/protein/gzm046. [DOI] [PubMed] [Google Scholar]
- 7.Shaner NC, et al. Nat Biotechnol. 2005;22:1567–1572. doi: 10.1038/nbt1037. [DOI] [PubMed] [Google Scholar]
- 8.Sakaue-Sawano A, et al. Cell. 2008;132:487–498. doi: 10.1016/j.cell.2007.12.033. [DOI] [PubMed] [Google Scholar]
- 9.Shaner NC, et al. Nat Methods. 2008;5:545–551. doi: 10.1038/nmeth.1209. [DOI] [PMC free article] [PubMed] [Google Scholar]
- 10.Hadjantonakis AK, Macmaster S, Nagy A. BMC Biotechnol. 2002;2:11. doi: 10.1186/1472-6750-2-11. [DOI] [PMC free article] [PubMed] [Google Scholar]
- 11.Tao W, et al. Stem Cells. 2007;25:670–678. doi: 10.1634/stemcells.2006-0553. [DOI] [PubMed] [Google Scholar]
- 12.Cockrell AS, Kafri T. Mol Biotechnol. 2007;36:184–204. doi: 10.1007/s12033-007-0010-8. [DOI] [PubMed] [Google Scholar]
- 13.Barolo S, Castro B, Posakony JW. Biotechniques. 2004;36:436–440. 442. doi: 10.2144/04363ST03. [DOI] [PubMed] [Google Scholar]
- 14.De Gasperi R, et al. Genesis. 2008;46:308–317. doi: 10.1002/dvg.20400. [DOI] [PMC free article] [PubMed] [Google Scholar]
- 15.Hoffman RM. Nat Rev Cancer. 2005;5:796–806. doi: 10.1038/nrc1717. [DOI] [PubMed] [Google Scholar]
Associated Data
This section collects any data citations, data availability statements, or supplementary materials included in this article.
Supplementary Materials
Supplementary Figure 1 High-level expression of red fluorescent proteins is toxic to bacteria.
Supplementary Figure 2 Fluorescence intensity distributions of HeLa cells transiently transfected with fluorescent proteins.
Supplementary Figure 3 Fluorescence maturation and photobleaching kinetics of five representative red fluorescent proteins.
Supplementary Figure 4 Substitutions in codons 2-4 increase DsRed expression in E. coli.
Supplementary Figure 5 Crystal packing arrangements of DsRed tetramers.
Supplementary Figure 6 Fluorescence properties of the new DsRed variants.
Supplementary Figure 7 Photobleaching kinetics of the new DsRed variants.
Supplementary Figure 8 Phototoxicity of fluorescent proteins in E. coli and yeast.
Supplementary Table 1 Properties of red fluorescent proteins.
Supplementary Table 2 Substitutions made during the creation of DsRed-Express2 and DsRed-Max.
Supplementary Table 3 Residues targeted from crystal packing analysis.
Supplementary Table 4 Data collection and refinement statistics for DsRed-Max.
Supplementary Table 5 Protein crystal statistics for DsRed tetramers.