

Abstract
The retina contains two populations of cholinergic amacrine cells, one positioned in the ganglion cell layer (GCL) and the other in the inner nuclear layer (INL), that together comprise ∼1/2 of a percent of all retinal neurons. The present study examined the genetic control of cholinergic amacrine cell number and distribution between these two layers. The total number of cholinergic amacrine cells was quantified in the C57BL/6J and A/J inbred mouse strains, and in 25 recombinant inbred strains derived from them, and variations in their number and ratio (GCL/INL) across these strains were mapped to genomic loci. The total cholinergic amacrine cell number was found to vary across the strains, from 27,000 to 40,000 cells, despite little variation within individual strains. The number of cells was always lower within the GCL relative to the INL, and the sizes of the two populations were strongly correlated, yet there was variation in their ratio between the strains. Approximately 1/3 of that variation in cell ratio was mapped to a locus on chromosome 3, where Sex determining region Y box 2 (Sox2) was identified as a candidate gene due to the presence of a 6-nucleotide insertion in the protein-coding sequence in C57BL/6J and because of robust and selective expression in cholinergic amacrine cells. Conditionally deleting Sox2 from the population of nascent cholinergic amacrine cells perturbed the normal ratio of cells situated in the GCL versus the INL and induced a bistratifying morphology, with dendrites distributed to both ON and OFF strata within the inner plexiform layer.
Keywords: fate, migration, P2X2, QTL, starburst, variant
Introduction
Cholinergic amacrine cells are perhaps the most conspicuous of all retinal amacrine cells, by virtue of their patterned distributions in each of two distinct layers in the retina and because of their striking dendritic morphology. They comprise only a small fraction (∼5%) of amacrine cells in the mouse retina, being ∼0.5% of all retinal neurons (Jeon et al., 1998). They are positioned in the amacrine cell subdivision of the inner nuclear layer (INL) and in the ganglion cell layer (GCL), where they form independent regularly spaced retinal mosaics (Vaney et al., 1981), and the cells in each population distribute their dendrites in a characteristic “starburst” morphology in strata within the OFF and ON subdivisions of the inner plexiform layer (IPL), respectively (Famiglietti, 1983; Tauchi and Masland, 1984).
Early in development, cholinergic amacrine cells form a single stratum within the inner retina at the site of the future IPL (Prada et al., 1999; Kim et al., 2000), subsequently separating into two populations, with dendritic arbors arising from either the apical or basal side of the soma directed into the IPL (Stacy and Wong, 2003). Because cholinergic amacrine cells are generated over a period of days during retinal neurogenesis (Reese and Colello, 1992; Voinescu et al., 2009), they continue to migrate into these two cellular layers during the perinatal period, dispersing tangentially as they become inserted into the regular retinal mosaics forming therein (Galli-Resta et al., 1997). Naturally occurring cell death reduces the size of this population during this perinatal period (Galli-Resta and Novelli, 2000; Resta et al., 2005), yielding functional mosaics that contribute to the transmission of spontaneous neural activity before eye opening (Ford and Feller, 2012). They subsequently serve an entirely different function in maturity, participating in the generation of direction selectivity in certain types of retinal ganglion cells (Taylor and Smith, 2012).
The present study examined the genomic control of cholinergic amacrine cell number and positioning by determining their number in C57BL/6J and A/J inbred mouse strains and in 25 genetically distinct recombinant inbred (RI) strains derived from them. We demonstrate that cholinergic amacrine cell number is a highly heritable trait, showing substantial variation across these strains but with low intrastrain variation. Curiously, whereas the ratio of cholinergic cells in the GCL and INL is comparable in the parental strains, there is variation across the RI strains. This variation maps to a locus on chromosome 3 (Chr 3), where we identified a candidate gene, Sex determining region Y box 2 (Sox2), controlling this trait. By the conditional deletion of Sox2 from cholinergic amacrine cells, we showed a change in their relative positioning, significantly altering this ratio without affecting total number, as well as a bistratification of their dendrites in the ON and OFF strata within the IPL without affecting total dendritic length. We conclude that Sox2 function is required for the expression of phenotypes that distinguish the two subtypes of cholinergic amacrine cells.
Materials and Methods
Animals.
C57BL/6J (hereafter B6/J) mice and A/J mice, as well as mice from 25 RI strains derived from them (AXB1/PgnJ, AXB2/PgnJ, AXB4/PgnJ, AXB5/PgnJ, AXB6/PgnJ, AXB8/PgnJ, AXB10/PgnJ, AXB12/PgnJ, AXB13/PgnJ, AXB15/PgnJ, AXB18/PgnJ, AXB23/PgnJ, AXB24/PgnJ and BXA1/PgnJ, BXA2/PgnJ, BXA4/PgnJ, BXA7/PgnJ, BXA11/PgnJ, BXA12/PgnJ, BXA13/PgnJ, BXA14/PgnJ, BXA16/PgnJ, BXA17/PgnJ, BXA25/PgnJ, BXA26/PgnJ; “/PgnJ” is omitted hereafter) were obtained from The Jackson Laboratory. Each RI strain is genetically distinct, being homozygous at all loci yet having a unique complement of the A or B haplotype along each Chr. A minimum of 3 mice were analyzed in each strain, either male or female and between 3.5 and 13 weeks of age, averaging 51 d of age. The data on total cell number and on the number in the INL and GCL have been described previously for the parental strains and four RI strains (AXB4, AXB5, AXB24, and BXA26) in a study on the mosaic regularity of the cholinergic amacrine cells in the INL versus the GCL (Whitney et al., 2008). The data on cell number in the INL versus the GCL have been described previously for all strains as supplementary information in a study comparing the degree of covariation and genetic coregulation of retinal cell number across 12 different retinal cell types (Keeley et al., 2014).
The Cre-loxP recombination approach was used to generate cholinergic-specific conditional knock-out (CKO) of Sox2 using mice expressing cre recombinase under the endogenous ChAT promoter (B6;129S6-Chattm1(cre)Lowl/J) with floxed-Sox2 mice (Sox2tm1.1Lan/J) (Shaham et al., 2009). Characterization of cre activation within the retina of the ChAT-Cre mouse showed that cre expression is turned on in all cholinergic amacrine cells (Ivanova et al., 2010). The F1 offspring of these mice were bred together to generate litters containing mice that were homozygous for the floxed-Sox2 allele or for the wild-type (WT) Sox2 allele and had at least one ChAT-Cre allele for the excision of Sox2 (with one exception: a control mouse with floxed-Sox2 alleles but lacking ChAT-Cre). The addition of a transgenic cre reporter mouse with a floxed stop-cassette followed by EYFP under a constitutively active promoter (B6.129X1-Gt(ROSA)26Sortm1(EYFP)Cos/J) was used to visualize cells in which cre recombinase had been present. These three mouse lines were acquired from The Jackson Laboratory. All experiments were conducted under authorization by the Institutional Animal Care and Use Committee at University of California–Santa Barbara and in accordance with the National Institutes of Health's Guide for the Care and Use of Laboratory Animals and the ARVO Statement for the Use of Animals in Ophthalmic and Vision Research.
Tissue processing.
Each mouse was given an intraperitoneal injection of sodium pentobarbital (120 mg/kg) and was perfused intracardially with ∼2 ml of 0.9% saline followed by ∼50 ml of 4% paraformaldehyde in 0.1 m sodium phosphate buffer, pH 7.2, at 20°C. Whole retinas were dissected from the eyes, taking care to include the entirety of each retina. Retinas were rinsed in phosphate buffer and immunolabeled at 4°C using standard indirect immunofluorescence techniques. All incubation solutions included 1% Triton X-100 in PBS. Retinas were incubated in a blocking solution containing 5% normal donkey serum (Sigma) for 3 h and then rinsed with PBS. Retinas were then incubated in an affinity-purified goat polyclonal antibody to choline acetyltransferase (ChAT, 1:50; catalog catalog #AB144P; Millipore) and agitated for 3 d at 4°C. Retinas were subsequently rinsed in PBS and incubated overnight in donkey anti-goat IgG conjugated to Cy2 (1:200; Jackson ImmunoResearch Laboratories). Retinas were then rinsed in PBS followed by phosphate buffer and mounted onto clean slides using phosphate buffer under a coverslip.
Cholinergic amacrine cell quantification.
A single retina from each mouse was quantified using a 20× objective on an Olympus BHS fluorescence microscope. A Sony video camera and X-Y stage encoders linked the microscope to a computer running Bioquant Nova Prime software (R&M Biometrics). The entire retinal outline was traced, from which the retinal area was subsequently calculated. Fields were sampled from the central and peripheral retina at ∼1/3 and 2/3 of the distance from the optic nerve head to the retinal circumference, respectively. In each of the four quadrants, the cholinergic amacrine cell mosaic was sampled in both the GCL and the INL (see Fig. 1A). A total of 119 mice (parental and RI strains) were sampled in this manner; the specific number for each strain is provided in Figure 1B. Each sampled field was 0.06 mm2 in area, so the sampling of 8 fields in a retina averaging 16.7 mm2 amounts to an average sampling of ∼2.8% of the total retinal surface. The average density of cells in the four central and the four peripheral samples were independently determined for each retina (very rarely, one of the quadrants could not be sampled at either the central or peripheral locus, in which case the other three quadrants were averaged), and the mean of these central and peripheral averages was calculated and multiplied by retinal area to estimate the total number of cells in the INL and in the GCL.
Figure 1.
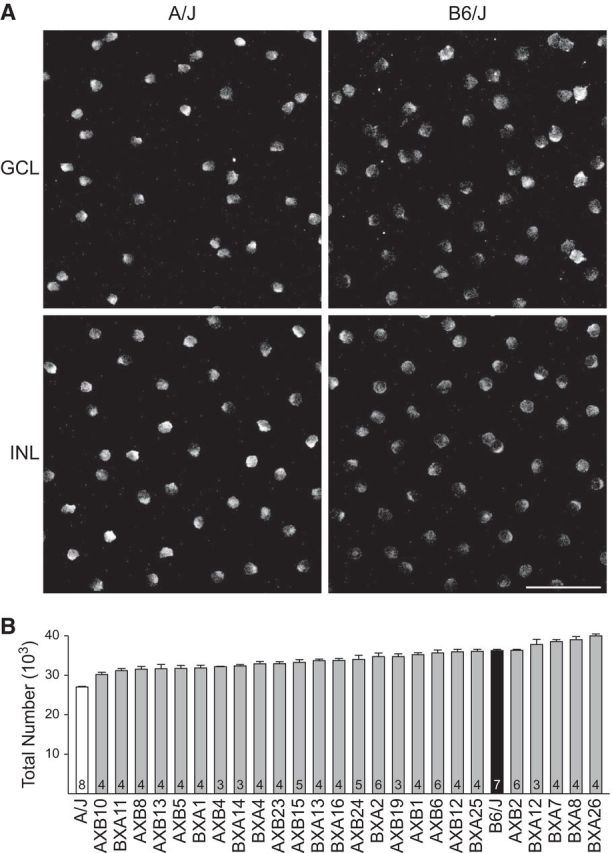
A, Cholinergic amacrine cell density, as revealed using an antibody to ChAT, varies between the two parental strains of mice, A/J and C57BL/6J (B6/J), in both the GCL and INL. Scale bar, 50 μm. B, Total number of cholinergic amacrine cells exhibits large variation across the 27 strains examined. The parental A/J and B6/J strains are shown in white and black, respectively, and the RI strains are shown in gray. Strains are ordered according to total number, exhibiting nearly a 50% increase from lowest to highest strain. Means and SEs are indicated and the n for each strain (being the number of retinas sampled) is indicated at the base of each bar.
Quantitative trail locus mapping.
We attempted quantitative trail locus (QTL) mapping using the mapping module of GeneNetwork (www.genenetwork.org), seeking genomic loci that modulate the total number of cholinergic amacrine cells, their independent numbers in the INL and the GCL, and the ratio of cholinergic amacrine cells between these two layers. We used a weighted interval mapping method that takes into account the SE of the strain means. These original data are accessible in the AXB/BXA Phenotypes database in GeneNetwork as record ID #10128 (total), #10131 (INL), #10129 (GCL), and #10130 (ratio). All megabase (Mb) position values in this paper refer to the Mouse Genome Assembly of 2007 (mm9).
QTL mapping determines the linkage between variation in phenotype with the presence of A (A/J) versus B (B6/J) alleles across the entire mouse genome, indicated by a likelihood ratio statistic (LRS). The mapping module uses a permutation test of the RI strain data to assess the probability of achieving a given LRS score by chance. It also performs a bootstrap analysis of the RI strain data, examining the robustness of the site of the peak LRS. Both procedures are described in detail in the online glossary in the help menu at www.genenetwork.org.
Interval analysis.
Several criteria were used to identify promising candidate genes, the primary one being the presence of genetic variants between the parental strains. The SNP Browser at GeneNetwork was used to query the presence of single nucleotide polymorphisms (SNPs) between the B6/J and A/J strains for the portion of the genome underlying each QTL of interest. This list was supplemented by a search for SNPs and short insertions or deletions (INDELs) using the query tools generated as part of the Mouse Genomes Project (Keane et al., 2011). Genes with variants in putative regulatory regions (3′-UTR, 5′-UTR, upstream, or downstream) or variants possibly altering protein function (e.g., missense or nonsense mutations) were identified using these two resources. Next, the expression of these genes in the mouse retina was determined using two publicly available resources for developing and mature retina. Genome-wide expression levels for the adult B6/J retina, generated by microarray analysis, are available at GeneNetwork (#GN210; Freeman et al., 2011). In addition, the mouse retina SAGE library has a large database of embryonic, early postnatal, and adult gene expression (Blackshaw et al., 2004). Last, an extensive literature search of known functions for all candidate genes with retinal expression and parental variants was conducted.
Candidate gene analysis.
Cholinergic amacrine cells in Sox2-CKO and WT retinas were immunolabeled with antibodies to ChAT, alone or in combination with antibodies to GFP (1:1000, catalog #A2131; Life Technologies), for those retinas that expressed EYFP, and imaged at four central and four peripheral sample fields with an Olympus FV1000 laser scanning confocal microscope using a 20× objective, and 0.4 or 0.1 mm2 image stacks of the GCL and INL were analyzed using Fiji image-processing software for the respective studies (cf. Fig. 6C–E and F–H). Comparable fields of the INL were also imaged in Sox2-CKO and WT retinas immunolabeled with antibodies to Isl1 (1:500, 39.4D5-b, DSHB). Sox2-CKO and Sox2-WT retinas were also immunolabeled with antibodies to ChAT, Sox2 (1:200, catalog #ab97959; Abcam), glutamine synthetase (GS, 1:500, catalog #610517; BD Biosciences), glial fibrillary acidic protein (GFAP-Cy3, 1:400, catalog #C9205; Sigma), or purinergic receptor P2X ligand-gated ion channel 2 (P2X2, 1:500, catalog #AB5244; Millipore) in either whole retinas or 150-μm-thick transverse sections. These samples were imaged with an Olympus FV1000 laser scanning confocal microscope using a 40× or 60× oil-immersion objective. All confocal images were processed for brightness and contrast in Adobe Photoshop CS5.
Figure 6.
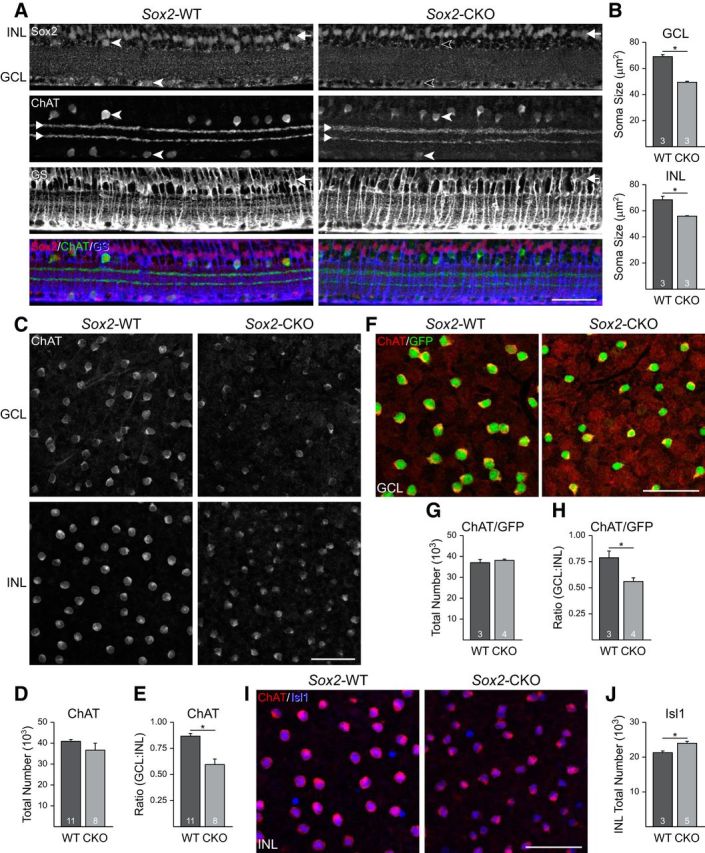
A, Sections of adult retina from Sox2-WT (left) and Sox2-CKO (right) littermates immunolabeled for Sox2, ChAT, and GS, showing the selective loss of Sox2 labeling within cholinergic amacrine cells (labeled for ChAT; cf. cells indicated with filled vs open arrowheads), but not within the Muller glia (labeled for GS; cf. rows of cells indicated by arrows at right) in the CKO. Note that the two cholinergic populations retain their characteristic stratification in the IPL (paired arrowheads at left). B, Soma size is significantly reduced in both the GCL (top) and INL (bottom) populations. C, Retinal whole mounts from adult Sox2-WT (left) and Sox2-CKO (right) littermates immunolabeled for ChAT to reveal the populations of cholinergic amacrine cells in the GCL (top) and INL (bottom). D, Total numbers of cholinergic amacrine cells are not significantly different between Sox2-WT and Sox2-CKO retinas. E, Ratio of cholinergic amacrine cells in the GCL to the INL was, however, significantly reduced. F, GFP immunolabeling of a cre-dependent EYFP reporter was used to confirm the population size of cholinergic amacrine cells, shown here for the GCL in Sox2-WT and Sox2-CKO retinas. Notice the thin rim of ChAT-immunostaining (red) surrounding the GFP reporter (green). G, H, Total numbers of cells were unchanged, whereas the ratio of cholinergic amacrine cells was significantly reduced. I, Isl1 immunofluorescence was comparable between the Sox2-WT (left) and Sox2-CKO (right) in the cholinergic amacrine cells in the INL. J, Number of Isl1-positive cells in the INL was significantly increased. Scale bar, 50 μm. n = the number of retinas sampled. *p < 0.05.
The somal areas of ChAT-immunolabeled cells were measured in whole-mount preparations for both Sox2-CKO and WT retinas. Retinas were sampled in eight quadrants, with 50 cells per field being sampled for both INL and GCL. Somas were traced using Fiji image-processing software, from which areas were determined for each layer.
Single-cell injection and morphometric analysis.
Adult Sox2-CKO and littermate control mice that carried the EYFP cre-reporter construct were euthanized with an intraperitoneal injection of Euthasol (sodium pentobarbital, 120 mg/kg, i.p.). Eyes were dissected immediately and then immersion-fixed in 4% paraformaldehyde for 30 min after removal of the cornea and lens. Whole retinas were then dissected from the eyes, rinsed in sodium phosphate buffer, and transferred to an injection well on a glass slide. Retinas were viewed with a fixed-stage Nikon Eclipse E600 microscope and individual EYFP-positive cells in the GCL were impaled with a micropipette filled with ∼5% Alexa Fluor 546 fluorescent dye. Negative current was passed for up to 5 min until the extent of the dendritic arbor was clearly filled with dye. Twelve cells were injected across two control retinas and 33 cells were injected across four CKO retinas. Retinas were subsequently stained with antibodies to GFP, which recognized the EYFP, as well as antibodies to ChAT. Each injected cholinergic amacrine cell was imaged using a Fluoview 1000 scanning confocal microscope and the following features were measured using Fiji image-processing software: (1) the areal extent of the dendritic field using a convex polygon; (2) the total length of the dendritic arbor in each layer by tracing each dendrite; (3) the number of dendritic branches; and (4) the number of dendritic crossings in which two dendrites in the same stratum within the IPL crossed one another. A “bistratification index,” the proportion of the total dendritic length positioned in the outer ChAT stratum in the IPL, was also calculated.
Statistics.
Student's t test was used for all comparisons between the Sox2-CKO and control retinas, with the exception of a single one-tailed Mann–Whitney U test used for the bistratification index.
Results
Cholinergic amacrine cell number is a polygenic trait
The total number of cholinergic amacrine cells, combining those in the INL and GCL (Fig. 1A), showed a conspicuous variation across this collection of 27 strains; the strain with the largest population was nearly 50% greater than the strain with the smallest population (Fig. 1B). The latter strain, the parental A/J strain, had 26,940 ± 167 total cells (mean and SE hereafter), whereas the former strain, BXA26, had 39,930 ± 481 cells. The BXA26 strain, as well as four other RI strains, all had total numbers of cholinergic amacrine cells greater than the B6/J parental strain, which had 36,220 ± 291 cells, 38% greater in size than A/J. Because each of the RI strains has a mosaic of the parental A and B haplotypes, the fact that the variation between the strains increases gradually rather than in only a few discrete steps indicates that this is a complex trait controlled by multiple gene variants influencing cell number. Furthermore, whereas the difference between the parental strains indicates a net effect of B alleles raising trait values, there must also be a role for A alleles at some loci increasing trait values because there are five RI strains with numbers greater than the B6/J strain.
Despite this conspicuous interstrain variation, there was minimal variation within each strain, with the coefficient of variation (SD/mean) averaging 0.04 across the strains. Such substantial interstrain variation in the presence of minimal variation within any individual strain is indicative of the heritability of this trait and can be formalized as a heritability index (h2) describing the proportion of the variance in trait values among all mice that can be attributed to an effect of strain (Hegmann and Possidente, 1981). h2 for total cholinergic amacrine cell number was 0.72, indicating that nearly 3/4 of the variation across the 119 mice examined must reflect the actions of variant genes discriminating the parental strains.
Positioning of cholinergic amacrine cells is a heritable trait
There is a general presumption that cholinergic amacrine cells are distributed as two matching populations between the GCL and INL, but a previous study reported the population in the INL to be more numerous in the C57BL/6Ncrl mouse retina (Jeon et al., 1998). We previously confirmed this imbalance for B6/J and A/J, as well as in AXB4, AXB5, AXB24, and BXA26 (Whitney et al., 2008). In the present study, we found this to be true in every one of the RI strains examined (Fig. 2A). The size of each population varied across the strains and, although there was greater variability for the INL population relative to the GCL population (Fig. 2A), the sizes of the two populations were highly correlated, with a Pearson correlation coefficient (r) of 0.82 across the collection of RI and parental strains (Fig. 2B). This correlation was maintained when considering the individual retinas (r = 0.80), where the size of the population in the INL was also larger in every one of the 119 retinas examined.
Figure 2.

A, Number of cholinergic amacrine cells in the GCL (left, lighter bar of each pair) is consistently lower that the total number in the INL (right, darker bar of each pair). Strains are ordered as in Figure 1B, with all other conventions the same, including n. B, Numbers of cholinergic amacrine cells in the two layers are highly correlated (r = 0.82). C, Ratio of the number of cholinergic amacrine cells in the GCL to the INL varies across the strains. Strains are ranked in ascending order of their GCL:INL ratio, with the n for each strain indicated in Figure 1B.
Curiously, even though the total number of cholinergic amacrine cells differed substantially between the two parental strains, the ratio of cells in the GCL to the INL was identical between them (0.86). There was, however, variation in this ratio among the RI strains, ranging from a low of 0.75 in BXA7 to a high of 0.95 in BXA12 (Fig. 2C), although this ratio trait showed slightly more variation within individual strains than did cell number (average coefficient of variation = 0.05). These data, showing a 27% increase in ratio from the lowest to highest strain, indicate a degree of genetic control in the positioning of cholinergic amacrine cells between the two layers.
Variation in cholinergic amacrine cell number maps to genomic loci on Chr 13 and Chr 16
The haplotype structure of each of these RI strains is established (Williams et al., 2001), enabling one to seek QTL, genomic loci where genetic variants influencing such traits must be present. The trait of total cell number revealed two marginally suggestive loci on Chr 13 and Chr 16 (Fig. 3A). These same loci were detected when considering only those cells in the INL, whereas no loci were revealed for the number in the GCL. The presumptive QTL on Chr 13 (112.4–123.3 Mb; peak LRS = 12.9) for total number (Fig. 3A) indicates an additive effect for two A alleles elevating total number by 3160 cells, whereas that on Chr 16 (6.3–7.4 Mb; peak LRS = 15.1) indicates an additive effect for two B alleles elevating the total number by 3339 cells. The peak on Chr 13 overlaps with a previously published QTL for horizontal cell total number, in which an SNP in the 5′ UTR of Isl1 was identified as the likely causal variant (Whitney et al., 2011b). In addition to modulating horizontal cell number, Isl1 is also known to play a role in the differentiation of cholinergic amacrine cells (Elshatory et al., 2007b). Given the low LRS for this QTL and the likely causal gene being Isl1, the genes underlying this interval were not examined further. Only a single gene underlies the QTL on Chr 16, RNA binding protein, fox-1 homolog 1 (Rbfox1). Rbfox1 is a neuron-specific RNA-binding protein that regulates alternative splicing events in neurodevelopmental disorders (Fogel et al., 2012). A search of the public mouse retinal expression and genetic variant databases shows that Rbfox1 is expressed in the developing and mature retina and has multiple SNPs in putative regulatory regions. Although the presence of a single gene at this locus makes it a compelling candidate, it was not pursued further in this study.
Figure 3.

Whole genome maps (A, B) or Chr 3 map (C) showing the linkage between phenotype with genotype. The left y-axis indicates the LRS, and the right y-axis indicates the additive effect of two alleles (red = B, green = A). A, Two marginally suggestive QTLs are detected on Chr 13 and Chr 16 associated with total cholinergic amacrine cell number. B, Variation in the ratio of cells in the GCL to the INL maps a prominent QTL on Chr 3. C, Chr 3 map showing the QTL in greater detail. Colored boxes at the top of the map represent the density of genes across Chr 3; orange histogram across the bottom indicates the density of SNPs. The inset shows the boxed region in further detail, indicating the position of Sox2 at the peak of the QTL at 34.54 Mb.
Variation in the ratio of cholinergic amacrine cells maps to a locus on Chr 3
Far more conspicuous was a QTL detected for the ratio of cholinergic amacrine cells in the two layers (GCL/INL; Fig. 3B). This mapped locus was positioned on Chr 3 from 30.1 to 39.8 Mb (Fig. 3C) and was associated with an LRS of 15.31 that surpassed the suggestive threshold of 11.18 but did not quite reach the significant threshold of 17.24. The QTL reveals an additive effect for two A alleles elevating the ratio by 0.07, an effect of ∼1/3 of the range of the variation across all strains (Fig. 2C). The QTL overlies a relatively gene-sparse region of Chr 3, which is also SNP sparse relative to the region immediately distal to it (Fig. 3C, inset). Allelic variants in a gene or genes within this region should participate in the establishment of this ratio.
Sox2 is a candidate gene for the ratio QTL on Chr 3
The genes within this interval on Chr 3 (30.1–39.8 Mb) were examined in order to identify candidate genes that may contribute to the variation in cholinergic amacrine cell ratio. Multiple criteria were used to screen potential candidates, including the presence of genetic variants between the parental strains and expression within the retina. Of the 80 genes within this interval, 33 of them met these two criteria (Table 1). An extensive search of the known functions of these 33 potential causal genes revealed a particularly promising candidate, Sox2, located at the very peak of the QTL (Fig. 3C).
Table 1.
The 33 genes within the QTL interval containing variants discriminating the parental strains and exhibiting retinal expression
| Mb position | Gene symbol | Retinal expression |
Genetic variants |
Protein function/characterization | |||
|---|---|---|---|---|---|---|---|
| Embryonic | Early postnatal | Adult | Coding | Putative regulatory | |||
| 30.510508 | Mynn | X | X | X | X | Transcriptional regulator | |
| 30.665747 | Samd7 | X | X | X | X | SAM (sterile alpha motif) domain-containing | |
| 30.795826 | Gpr160 | X | X | X | X | G-protein coupled receptor | |
| 30.951284 | Prkci | X | X | X | X | Atypical serine/threonine kinase | |
| 31.063159 | Cldn11 | X | X | X | X | Oligodendrocyte transmembrane protein | |
| 31.105423 | Slc7a14 | X | X | Multi-pass membrane protein; amino acid transport | |||
| 31.801678 | Kcnmb2 | X | X | X | Ca+2 activated potassium KCNMA1 channel subunit | ||
| 32.234128 | Zmat3 | X | X | X | X | p53 target | |
| 32.265905 | 4930429B21Rik | X | X | Uncharacterized | |||
| 32.360730 | Pik3ca | X | X | Serine/threonine kinase | |||
| 32.419533 | Zfp639 | X | X | X | X | Transcriptional repressor | |
| 32.461972 | Mfn1 | X | X | X | X | X | Transmembrane GTPase |
| 32.482596 | Gnb4 | X | X | X | X | X | G-protein, gamma unit |
| 32.833965 | Usp13 | X | X | X | X | X | Deubiquitinase |
| 32.849577 | Pex5l | X | X | X | X | Peroxisomal targeting signal receptor | |
| 33.699544 | Ttc14 | X | X | X | Tetratricopeptide repeat protein | ||
| 33.711362 | Ccdc39 | X | X | Coiled-coil domain-containing protein | |||
| 34.549973 | Sox2 | X | X | X | X | X | Transcriptional activator |
| 35.704724 | Atp11b | X | X | X | X | X | Phospholipid-transporting ATPase |
| 35.794225 | Dcun1d1 | X | X | E3 ubiquitin ligase complex component | |||
| 35.858805 | Mccc1 | X | X | X | X | 3-methylcrotonyl-CoA carboxylase subunit | |
| 35.988273 | Acad9 | X | X | X | X | X | Acyl-CoA dehydrogenase |
| 36.104059 | Exosc9 | X | X | X | X | X | RNA processing and degradation |
| 36.348107 | Anxa5 | X | X | X | X | Anticoagulant protein | |
| 36.459725 | Bbs7 | X | X | X | X | X | Ciliogenesis |
| 36.463815 | Ccna2 | X | X | X | X | X | Cell cycle control |
| 36.519505 | Trpc3 | X | X | X | X | Calcium cation channel | |
| 36.787865 | 4932438A13Rik | X | X | X | Uncharacterized | ||
| 37.207980 | Cetn4 | X | X | X | Ca2+ binding protein | ||
| 37.303905 | Nudt6 | X | X | X | Phosphohydrolases | ||
| 37.538916 | Spry1 | X | X | X | X | Fibroblast growth factor antagonist | |
| 38.349976 | Ankrd50 | X | X | Ankyrin repeat domain-containing protein | |||
| 38.851170 | Fat4 | X | X | X | Atypical cadherin | ||
Sox2 belongs to the large family of Sry-related HMG (high-mobility group) box transcription factor genes, of which there are 20 different members in both mice and humans (Kiefer, 2007). This family can be divided into multiple subgroups, and Sox2 belongs to the SoxB1 subgroup comprised of only three members (Uchikawa et al., 1999). All SoxB1 proteins are transcriptional activators and are largely expressed in the developing embryo, where they play important roles in fate determination and differentiation (Miyagi et al., 2009). Sox2, in particular, is expressed in neuronal progenitors throughout the nervous system, including the retina (Ferri et al., 2004), and is important for progenitor function and maintenance (Taranova et al., 2006; Matsushima et al., 2011). Mutations in SOX2 have been shown to cause microphthalmia and anophthlamia in humans (Fantes et al., 2003; Schneider et al., 2009), a condition that has been replicated in mice using a Sox2 hypomorphic allele (Taranova et al., 2006).
Sox2 is selectively expressed in cholinergic retinal neurons
In addition to being expressed in retinal progenitor cells, Sox2 is expressed later in development in two postmitotic retinal cell types. One is the Muller glial cell, in which it functions to maintain the radial morphology of these cells and to prevent cell-cycle reentry; without Sox2, these cells ectopically divide (Surzenko et al., 2013). The other Sox2-expressing postmitotic cell in the retina has been disputed. Initially, this other cell type was interpreted to be Neuropeptide Y amacrine cells (Le Rouëdec et al., 2002), then either Isl1-expressing amacrine cells (Das et al., 2009) or a subset of GABAergic amacrine cells including the cholinergic amacrine cells (Lin et al., 2009). Another study subsequently reported that the population of Sox2-positive cells included not only cholinergic amacrine cells and Muller glia, but also retinal astrocytes (Fischer et al., 2010). To examine this issue further, we immunolabeled mature retinal tissue with antibodies to Sox2 and ChAT, as well as GS, which is selective for Muller glial cells, and GFAP, which labels retinal astrocytes. Sections of retina confirmed the expression of Sox2 in all Muller glial cells, as well as within cholinergic amacrine cells (Fig. 4A). It is difficult to determine, in retinal sections, how specific and complete the expression of Sox2 is within a cellular population, and this may contribute to prior ambiguous descriptions of this population in the literature. Immunolabeling in retinal whole mounts, however, allows for a more accurate assessment of the degree of Sox2, GS, GFAP, and ChAT colocalization within each layer. All Sox2-positive cells in the middle portion of the INL are Muller glia, and all Muller glia are Sox2 positive (Fig. 4B). Within the amacrine cell layer (ACL) of the INL, all Sox2-positive cells are ChAT positive and every ChAT-positive cell is also Sox2 positive (Fig. 4C). In the GCL, every ChAT-positive cell is again Sox2 positive; however, there are a small number of cell bodies labeled with Sox2 that are not ChAT positive (Fig. 4D, white arrowheads). These cells are retinal astrocytes, based on their characteristic morphology (Stone and Dreher, 1987) and labeling with GFAP (Fig. 4D).
Figure 4.
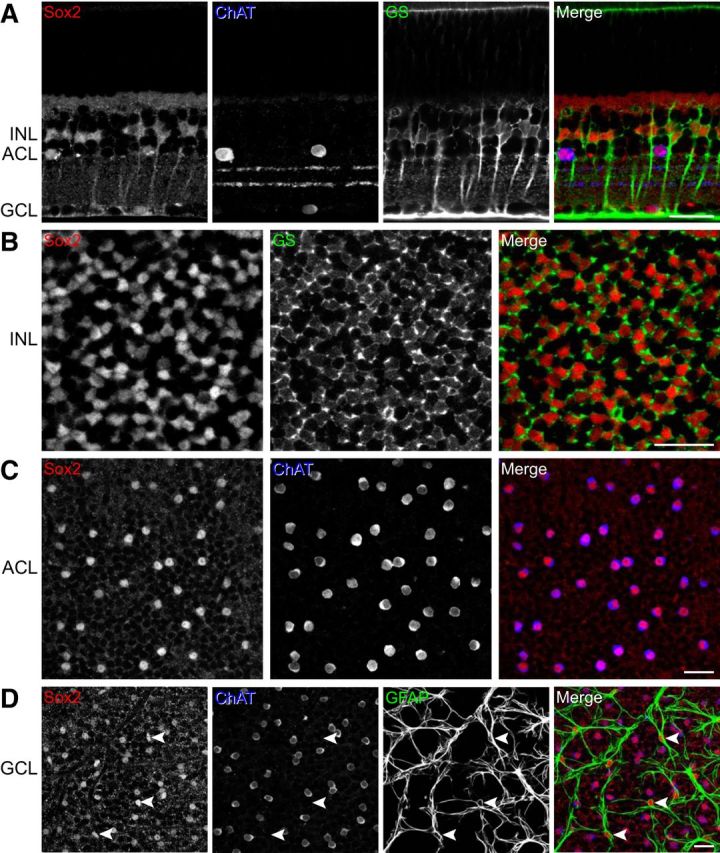
A, Sections of retina from an adult B6/J mouse immunolabeled for Sox2, ChAT, and GS, showing the coincidence of Sox2-labeling within the Muller glia (labeled for GS) and cholinergic amacrine cells (labeled for ChAT). B, Retinal whole mounts from an adult B6/J mouse similarly immunolabeled for Sox2 and GS, showing the complete and exclusive colocalization of Sox2 with GS in the middle of the INL. C, The colocalization of Sox2 with ChAT in the ACL is complete and exclusive. D, There is also a complete colocalization of Sox2 with ChAT in the GCL, but some additional cells are also Sox2 positive, confirmed to be retinal astrocytes by GFAP labeling (white arrowheads). Scale bars, 25 μm.
This analysis of Sox2 localization in the mature retina shows definitively that cholinergic amacrine cells are the only neuronal population that expresses Sox2, and this expression is found across the entire population, validating the reported expression pattern of Sox2 in the adult retina from a microarray expression analysis of multiple retinal populations (Siegert et al., 2012). Microarray analysis of gene expression for 13 retinal cell types, including cholinergic amacrine cells, was performed on postnatal day 6 mouse retinas (Gene Expression Omnibus accession #GSE35077; Kay et al., 2012). Using this dataset, one may compare the relative expression levels of all genes underlying the QTL on Chr 3. Not only did this further confirm the expression of Sox2 in developing cholinergic amacrine cells, it also showed that Sox2 is the most abundantly expressed gene from this locus in these cells (Fig. 5A). A comparison of Sox2 expression across all 13 cell types, shown normalized to the expression levels in cholinergic amacrine cells (Fig. 5B), confirms the selective expression of Sox2 as shown by immunofluorescence. Five other genes from the locus on Chr 3, with genetic variants between the parental strains and high expression levels in developing cholinergic amacrine cells, failed to show the same specificity of expression across cell types (Fig. 5B).
Figure 5.
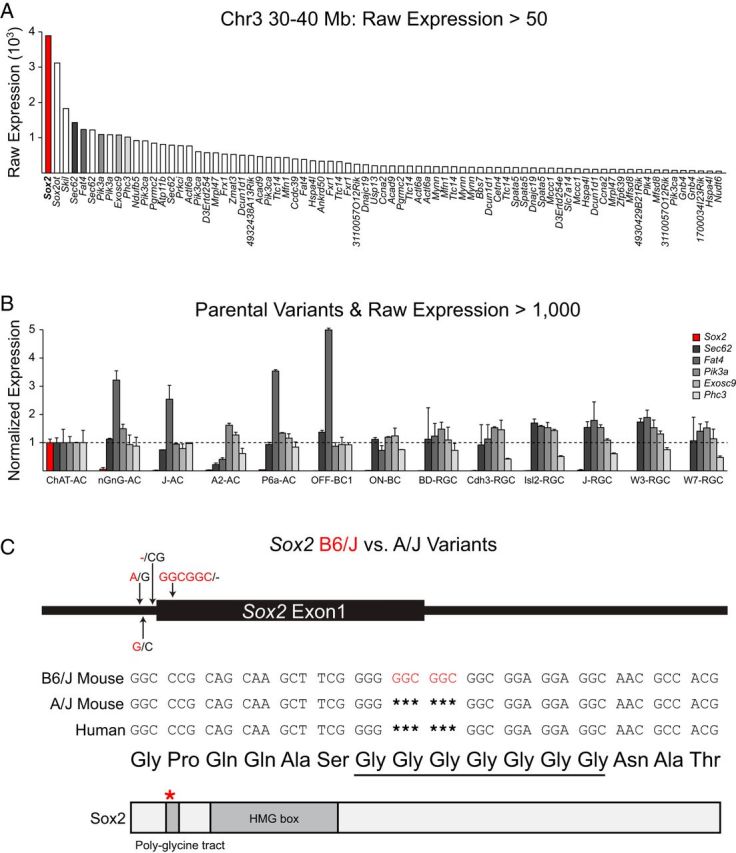
A, Sox2 (red) is the most abundantly expressed candidate gene in postnatal cholinergic amacrine cells from this locus. Microarray expression data derived from a purified population of cholinergic amacrine cells from postnatal day 6 retinal tissue (Kay et al., 2012) were surveyed to determine transcript abundance in this cell type for all genes within the interval of the ratio QTL on Chr 3. Genes with raw expression levels >50 are shown, and some are represented more than once due to the presence of multiple microarray probes. B, Of all of the highly expressing genes in P6 cholinergic amacrine cells (raw expression >1000) that have variants discriminating the parental strains, only Sox2 (red) shows an expression profile across 13 retinal cell types that is selective for cholinergic amacrine cells. Transcript levels for the six genes meeting these criteria have been normalized to their expression in cholinergic amacrine cells. C, There are two SNPs and an INDEL in the 5′-UTR of Sox2 discriminating the parental strains and a six-nucleotide insertion in the coding region of Sox2, adding two glycines in a polyglycine tract, in B6/J. This modification may affect the stability of Sox2 protein binding to DNA in the presence of transcriptional coactivators.
A six-nucleotide insertion in B6/J extends a polyglycine tract of Sox2
Further evidence for considering Sox2 as a candidate gene at this locus is the presence of multiple genetic variants, including a six nucleotide INDEL, within the coding region of Sox2, leading to the addition of two glycines to a polyglycine tract located toward the N terminus of the protein in B6/J (Fig. 5C). A similar three-nucleotide insertion has been described in humans, with the addition of one extra glycine to the same polyglycine tract attributed as the cause of bilateral anophthalmia in the affected patient (Schneider et al., 2009). The specific molecular function of such homopolymeric tracts is not entirely clear; however, they are often present in transcription factors (Albà and Guigó, 2004). This polyglycine tract, adjacent to the DNA-binding HMG box of Sox2, is conserved across all three members of the SoxB1 subgroup and across the mammalian orthologs of these family members (Katoh and Katoh, 2005; Mojsin et al., 2010). Although the additional presence of two SNPs and another short INDEL in the 5′ UTR of Sox2 (Fig. 5C) raises the possibility of variants also affecting transcript levels of Sox2, the deleterious effect of an insertion extending the polyglycine tract of SOX2 in humans would implicate the six-nucleotide-coding INDEL producing a functional difference in the Sox2 protein, which may be affecting the cholinergic amacrine population.
Conditional deletion of Sox2 from cholinergic amacrine cells alters their distribution between the GCL and INL
Our QTL analysis suggests that Sox2 may play a role in subdividing the cholinergic amacrine population into INL and GCL subtypes. To test this hypothesis, cholinergic-specific Sox2 mutants (Sox-CKO mice) were generated by crossing mice expressing cre recombinase under the control of an endogenous ChAT promoter with floxed-Sox2 mice. ChAT expression begins as these cells coalesce in the inner retina, before the cholinergic amacrine cells have separated into two distinct populations (Kim et al., 2000), so the excision of Sox2 should occur before their relative positioning is established. Sox2-CKO mice lacked Sox2 protein expression in cholinergic neurons (Fig. 6A, arrowheads), but not in Muller glia (Fig. 6A, right arrows), confirming the specificity of the CKO effect. Using anti-ChAT antibodies, we examined the size of the cholinergic population in mutant retinas. Whereas the total number of neurons was unchanged relative to WT siblings (p = 0.17; Fig. 6D), the GCL-to-INL ratio was conspicuously altered, with fewer positioned in the GCL and more residing in the INL (Fig. 6C). In littermate Sox2-WT retinas, the average GCL-to-INL ratio was 0.87 (± 0.03), comparable to the parental strain values described in Figure 2C, whereas the Sox2-CKO retinas had a ratio of 0.60 (± 0.05), significantly lower than controls (p = 0.0001; Fig. 6E).
The cholinergic amacrine cells in both layers have significantly smaller somata (GCL: p = 0.0003; INL: p = 0.01; Fig. 6B) and are less robustly labeled using the antibody to ChAT (Fig. 6C), suggesting that their differentiation has been compromised. We therefore used two additional markers to confirm our finding that cholinergic neurons are present at normal numbers but are redistributed between layers. First, we used a Cre-dependent EYFP reporter transgene to label ChAT-expressing cells. Retinas were double labeled using antibodies for ChAT and GFP to ensure that faintly labeled cholinergic amacrine cells were not overlooked due to their reduced ChAT intensity (Fig. 6F). Their counts confirmed even more clearly a mispositioning of cholinergic amacrine cells between the two nuclear layers, as evidenced by no difference in total number (Fig. 6G), yet displayed a comparable change in ratio, from 0.78 in the control retinas to 0.55 in the CKO retinas (Fig. 6H). The difference in the absolute number of cholinergic amacrine cells, as well as the ratio between the control conditions in these two studies (cf. Fig. 6D,E and G,H) is not surprising, because the cre-reporter mice introduced novel genetic variants due to the mixed background of this transgenic line.
Second, we confirmed that the population of cholinergic amacrine cells in the INL underwent a significant increase in the Sox2-CKO retina by labeling them using an antibody to Isl1. This antibody labels exclusively cholinergic amacrine cells in the amacrine cell division of the INL while also labeling bipolar cells positioned more sclerally in the INL. In the GCL, however, it labels both cholinergic amacrine cells and retinal ganglion cells, thereby prohibiting those in the GCL from being selectively identified (Elshatory et al., 2007a). Unlike the reduction in intensity of ChAT labeling, Isl1 labeling remained distinctive within the nucleus of ChAT-positive cells in the Sox2-CKO retinas (Fig. 6I). Counts of Isl1-positive cells confirmed a significant increase in their total number within the INL (Fig. 6J). These three studies provide converging support for the interpretation that, despite their weaker expression of ChAT and smaller somata, the total numbers of cholinergic amacrine cells in Sox2-CKO retinas have not been conspicuously undersampled. Rather, they have undergone a redistribution between the layers, with many more being found in the INL at the expense of the GCL.
Loss of Sox2 in cholinergic amacrine cells induces a bistratified dendritic morphology
The deletion of Sox2 from the cholinergic amacrine cell population not only altered their positioning between the GCL and INL, but also affected cholinergic amacrine cell differentiation. This was evidenced by their smaller somata, their reduced ChAT intensity, and also by their altered dendritic morphology. Whereas normal cholinergic amacrine cells in the GCL establish a starburst morphology in the ON division of the IPL (Fig. 7A), those in the Sox2-CKO retina frequently exhibited bistratifying dendrites that were also distributed within the OFF division of the IPL (Fig. 7B–E). Calculation of a “bistratification index,” the proportion of the total dendritic arbor positioned in the outer ChAT stratum, confirmed a significant difference (p = 0.0007; Fig. 7G). Immunolabeling such specimens for ChAT confirmed that these two dendritic arbors coincided with the ChAT strata normally present at these depths within the IPL (Fig. 7F). This restriction of their dendrites to the two ChAT strata indicates that they have retained their cholinergic amacrine cell status yet lack a clear identity as either ON or OFF. The degree of bistratification varied extensively between the 33 labeled Sox2-CKO cells in the GCL: some cells had up to 95% of their dendritic arbor positioned in the OFF stratum (Fig. 7E), others showed nearly equal contributions to both strata (Fig. 7D), and others had <5% of their dendrites positioned in the OFF stratum (Fig. 7B), including a number with no misstratifying dendrites.
Figure 7.
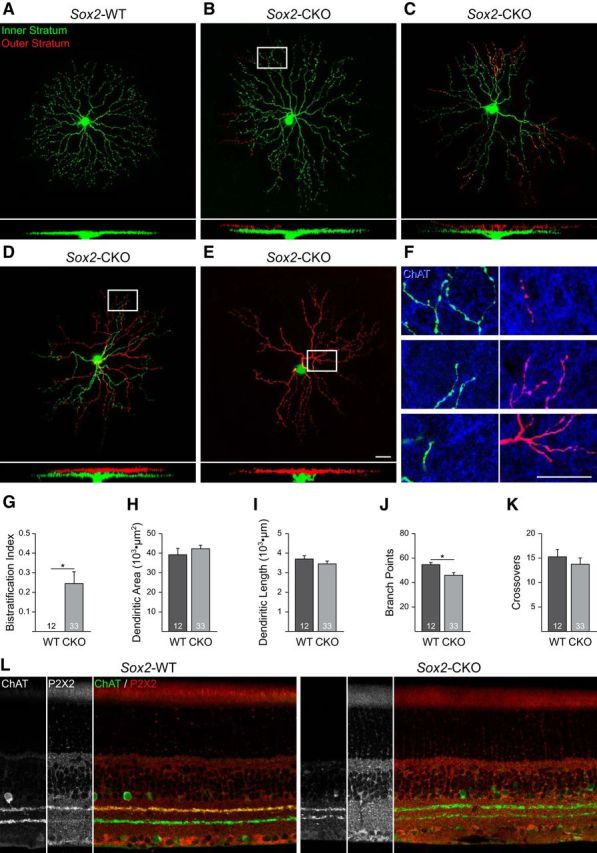
A–E, Dendritic morphologies of cholinergic amacrine cells in the GCL of Sox2-WT (A) and Sox2-CKO (B–E) retinas showing the bistratification of dendritic arbors in the CKO retina. Dendrites in the inner stratum (ON) are shown in green and those distributed to the outer stratum (OFF) are shown in red. X-Z reconstructions show the entire dendritic arbor. F, Detail from the reconstructions of three cells (B, D, E) showing the coincidence of the bistratifying dendrites with the ChAT-immunopositive strata (blue). G, Bistratification index for the Sox2-CKO retinas was significantly different. H–J, Total dendritic field area (H) and summed dendritic length (I) showed no difference between the Sox2-CKO and control cells, but the total number of branch points was reduced (J). K, Total number of dendritic crossings was unchanged. L, Immunofluorescence for P2X2 (red), normally present throughout the cholinergic dendritic plexus in the outer stratum within the IPL, is abolished from INL cholinergic amacrine cells and their processes (ChAT immunofluorescence is shown in green) in the Sox2-CKO retina. Scale bar, 25 μm. n = the number of cells analyzed. *p < 0.05.
The areal extent of the dendritic field, when considering the total arbor area defined by both plexes (Fig. 7B–E), was not significantly different between the Sox2-CKO and control cells (p = 0.40; Fig. 7H), nor was total dendritic length (p = 0.35; Fig. 7I). The total number of branch points within the dendritic arbor was, however, significantly reduced in the Sox2-CKO cells (p = 0.03; Fig. 7J). The distal segments of Sox2-CKO dendrites typically exhibited the hallmark bouton-like expansions of this cell type, but many Sox2-deficient cells lacked the characteristic starburst morphology of WT cells (Fig. 7C–E), including some of those without bistratifying dendrites. We also quantified the frequency of higher-order dendrites crossing over one another, yet found no difference between the two conditions (p = 0.53; Fig. 7J). Coupled with the fact that total dendritic length was unchanged, these results indicate a failure to “space-fill” the denuded territory within the ON stratum made available by dendrites climbing into the OFF stratum of the IPL.
We have to date been successful at labeling only a single cholinergic amacrine cell in the INL, showing two small branchlets extending into the inner stratum, suggesting that this population may have also lost their identity as OFF cells. This is further supported by the observation that the processes of the cholinergic amacrine cells in the INL in the Sox2-CKO retina are no longer immunopositive for the purinoceptor P2X2 (Kaneda et al., 2004; Fig. 7L). The processes of the cholinergic amacrine cells in the GCL are only faintly labeled for P2X2 in the WT retina, and this labeling is also lost in the Sox2-CKO retinas. These results, in combination with the morphological data for the population in the GCL, together suggest that Sox2 plays a role in imparting subtype identity, giving cholinergic amacrine cells their distinct INL (OFF) versus GCL (ON) morphological and molecular characteristics.
Discussion
The present study has demonstrated four new findings associated with the population of cholinergic amacrine cells. First, it has shown that cholinergic cell number is a heritable polygenic trait. Second, it has shown that the ratio of cholinergic amacrine cells in the two nuclear layers is also under genetic control, though independent of the control of cell number, and that a controlling genomic locus resides on Chr 3. Third, it has identified the transcription factor Sox2 as a candidate gene at this QTL, which, when conditionally knocked out of newly differentiating cholinergic amacrine cells, leads to a redistribution of cells between the two layers. Fourth, analysis of dendritic morphology in the absence of Sox2 has shown a disruption in the normal differentiation of distinctive ON versus OFF subtypes of cholinergic amacrine cells. The significance of each of these findings is considered in the following sections.
Cholinergic amacrine cell number is a heritable polygenic trait
Cholinergic amacrine cells comprise ∼1/2 of a percent of all retinal neurons (Jeon et al., 1998), their total number being achieved through fate determination events producing an initial population that is subsequently modulated by a Bax-independent-form of naturally occurring cell death (Galli-Resta and Novelli, 2000; Resta et al., 2005; Whitney et al., 2008). Remarkably, the mouse retina achieves this final number with high fidelity, yet this precision is acutely sensitive to the actions of numerous genetic variants. Comparable precision despite marked variation between strains has recently been documented in this same RI strain set for 10 other retinal cell types (Keeley et al., 2014). Three of these, the dopaminergic amacrine cells, the horizontal cells, and the cone photoreceptors, comprise comparably meager percentages (0.01%, 0.25%, and 2.5%, respectively) of the total population of retinal neurons, yet like the cholinergic cells, each exhibits large interstrain variation in number in the presence of minimal intrastrain variation (Whitney et al., 2009, 2011a, 2011b). As for the cholinergic cells, so for each of these other cell types does the B6/J strain have greater numbers, yet the variation across the RI strains is unique for each of them, such that none of the correlations between any of them comes close to that shown for the correlation between the two populations of cholinergic amacrine cells (Keeley et al., 2014).
Our attempt to map QTL for total cholinergic amacrine cell number, although yielding two opposing loci on Chr 13 (A alleles increasing the trait) and Chr 16 (B alleles increasing the trait), mapped only a small proportion of the total variance in cell number to each of these loci. This of course does not diminish the conclusions to be drawn from the originating data, that cholinergic amacrine cell number is a heritable polygenic trait, it simply shows that most of the variation in phenotype across these strains did not segregate within this set of RI strains.
A QTL on Chr 3 controls cholinergic amacrine cell ratio
The ratio of cholinergic cells in the GCL and INL showed an unexpected genetic component. The collection of RI strains displayed variation in this trait and we were able to map a portion of that variation to a QTL on Chr 3, the magnitude of which was ∼1/3 of the variation observed across the RI strain set (i.e., a large-effect QTL), with A alleles increasing trait values. A alleles in a gene or genes in this region shift the balance between these two populations toward parity, although none of the strains had identical numbers in the two layers. Because neither the number of cholinergic cells in the GCL nor those in the INL mapped to this same locus on Chr 3, this effect does not appear to be the indirect consequence of a gene or genes modulating cell number, although there was a small but significant negative correlation between ratio and INL cell number (r = −0.47; for GCL cell number, r = 0.12). The causal gene variant (or variants) on Chr 3 should be modulating processes distinct from those affecting cellular production or cell survival and having an effect upon cellular positioning. The fact that the parental strains do not differ in their ratio, when the RI strains exhibit such variation, makes clear that there must be multiple countervailing influences to the variant(s) at the QTL on Chr 3 that modulate cellular positioning.
Sox2 regulates the positioning of cholinergic amacrine cells
The conditional deletion of Sox2 from cholinergic amacrine cells before the INL and GCL populations have segregated into their two independent strata and before the final migration of all cholinergic cells to the inner retina results in a change in the relative numbers found within the two populations. More cells are found in the INL and fewer in the GCL, but their summed total number shows no statistically significant difference from the number in control retinas. The fact that not all cells of the GCL population were so redistributed may indicate that some cells escape the deletion of Sox2 until after they have already entered their correct stratum. Alternatively, some of the later-migrating cells that have not arrived in the inner retina might be selectively affected, preventing them from crossing the IPL (Galli-Resta et al., 1997). What is clear is that this population of mispositioned cells is not exclusively affected by the loss of Sox2, as evidenced by the fact that the majority of those that remain in the GCL now exhibit bistratifying dendrites, whereas all that are positioned in the INL lack their normal P2X2 receptor immunopositive status. Clearly, the aberrant phenotype of the Sox2-deficient cholinergic amacrine cell is not solely a migratory one.
Sox2 is critical for the formation of monostratified ON versus OFF cholinergic amacrine cells
The present morphological analysis has demonstrated that most Sox2-deficient cholinergic cells in the GCL no longer differentiate monostratifying dendritic arbors restricted to their normal inner stratum within the IPL, having instead bistratifying dendrites. Notably, these arbors continue to target discrete cholinergic strata, the positions of which appear to have gone unchanged, suggesting that these cells still retain their identity as cholinergic amacrine cells. This is to be compared with the cholinergic cell phenotype of the Sema6a and Plxna2 knock-out retinas, in which the development of discrete ON versus OFF strata is disrupted, and with a subset of cells having some dendrites that misstratify in the IPL (Sun et al., 2013). The cholinergic cells in the GCL in both knock-outs also display stunted dendritic outgrowth, showing significant reductions in total dendritic field area and length, as well as a higher frequency of dendrites crossing over one another. In contrast, in cholinergic neurons in the Sox2-CKO retina, the overall dendritic field area was unaltered and the total linear extent of dendritic arbor was also not significantly different, confirming that neither is under the control of constraining homotypic influences (Farajian et al., 2004). These cells also did not exhibit a greater frequency of dendritic crossings, suggesting that Sox2 does not modulate the genes believed to regulate isoneuronal avoidance (Lefebvre et al., 2012; Sun et al., 2013). Indeed, whereas those studies show a heightened frequency of dendritic self-crossings in the absence of Sema6A, Plexin-A2, or the protocadherin-gamma gene cluster, the present results would suggest that those genes do not suffice to generate a space-filling starburst morphology.
Interestingly, there are morphological differences between the dendritic arbors of cholinergic cells in the B6/J versus A/J strains, with the latter strain having significantly smaller dendritic fields (despite their having lower densities of cells) yet significantly more dendritic branches (Keeley et al., 2007), but the genomic source of such variation is unclear. The subfamily of SoxB1 proteins are transcriptional activators that bind to DNA via their HMG-box domain. This binding is not particularly stable, however, and requires the additional binding of a coactivator to initiate transcriptional activation (Kamachi et al., 2000; Miyagi et al., 2009). The presence of two additional glycines in the B6/J protein may alter the stability of binding in the presence of such coactivators. Although this functional mutation may modulate positioning across the RI strains, it may not be sufficient to alter the specificity of dendritic targeting to the ON or OFF stratum that is so conspicuous after complete interruption of Sox2 expression.
Conclusions
Sox2 plays a critical role in early retinal development, being required to maintain the progenitor pool (Taranova et al., 2006; Matsushima et al., 2011). It eventually becomes restricted to three populations of retinal cells, the Muller glia, the astrocytes, and the cholinergic amacrine cells, much as Pax6 and Lhx2 are expressed throughout the progenitor pool within the retina during early development but subsequently become restricted to amacrine cells (Marquardt et al., 2001; Balasubramanian et al., 2014; Gordon et al., 2013). Each presumably exerts quite distinct functions in their respective cell types as development continues. Sox2 expression in the cholinergic amacrine cells clearly plays a role in their differentiation, including, as we have shown here, their somal positioning and dendritic targeting. How the dendritic bistratification and patterning phenotypes ultimately relate to the positioning phenotype, and the molecular control of ON versus OFF fate, remain to be determined.
Footnotes
This work was supported by the National Institutes of Health (Grants EY-19968 and RR-22582).
The authors declare no competing financial interests.
References
- Albà MM, Guigó R. Comparative analysis of amino acid repeats in rodents and humans. Genome Res. 2004;14:549–554. doi: 10.1101/gr.1925704. [DOI] [PMC free article] [PubMed] [Google Scholar]
- Balasubramanian R, Bui A, Ding Q, Gan L. Expression of LIM-homeodomain transcription factors in the developing and mature mouse retina. Gene Expr Patterns. 2014;14:1–8. doi: 10.1016/j.gep.2013.12.001. [DOI] [PMC free article] [PubMed] [Google Scholar]
- Blackshaw S, Harpavat S, Trimarchi J, Cai L, Huang H, Kuo WP, Weber G, Lee K, Fraioli RE, Cho SH, Yung R, Asch E, Ohno-Machado L, Wong WH, Cepko CL. Genomic analysis of mouse retinal development. PLoS Biol. 2004;2:E247. doi: 10.1371/journal.pbio.0020247. [DOI] [PMC free article] [PubMed] [Google Scholar]
- Das G, Choi Y, Sicinski P, Levine EM. Cyclin D1 fine-tunes the neurogenic output of embryonic retinal progenitor cells. Neural Dev. 2009;4:15. doi: 10.1186/1749-8104-4-15. [DOI] [PMC free article] [PubMed] [Google Scholar]
- Elshatory Y, Deng M, Xie X, Gan L. Expression of the LIM-homeodomain protein Isl1 in the developing and mature mouse retina. J Comp Neurol. 2007a;503:182–197. doi: 10.1002/cne.21390. [DOI] [PMC free article] [PubMed] [Google Scholar]
- Elshatory Y, Everhart D, Deng M, Xie X, Barlow RB, Gan L. Islet-1 controls the differentiation of retinal bipolar and cholinergic amacrine cells. J Neurosci. 2007b;27:12707–12720. doi: 10.1523/JNEUROSCI.3951-07.2007. [DOI] [PMC free article] [PubMed] [Google Scholar]
- Famiglietti EV., Jr “Starburst” amacrine cells and cholinergic neurons: mirror-symmetric ON and OFF amacrine cells of rabbit retina. Brain Res. 1983;261:138–144. doi: 10.1016/0006-8993(83)91293-3. [DOI] [PubMed] [Google Scholar]
- Fantes J, Ragge NK, Lynch SA, McGill NI, Collin JR, Howard-Peebles PN, Hayward C, Vivian AJ, Williamson K, van Heyningen V, FitzPatrick DR. Mutations in SOX2 cause anophthalmia. Nat Genet. 2003;33:461–463. doi: 10.1038/ng1120. [DOI] [PubMed] [Google Scholar]
- Farajian R, Raven MA, Cusato K, Reese BE. Cellular positioning and dendritic field size of cholinergic amacrine cells are impervious to early ablation of neighboring cells in the mouse retina. Vis Neurosci. 2004;21:13–22. doi: 10.1017/S0952523804041021. [DOI] [PubMed] [Google Scholar]
- Ferri AL, Cavallaro M, Braida D, Di Cristofano A, Canta A, Vezzani A, Ottolenghi S, Pandolfi PP, Sala M, DeBiasi S, Nicolis SK. Sox2 deficiency causes neurodegeneration and impaired neurogenesis in the adult mouse brain. Development. 2004;131:3805–3819. doi: 10.1242/dev.01204. [DOI] [PubMed] [Google Scholar]
- Fischer AJ, Zelinka C, Scott MA. Heterogeneity of glia in the retina and optic nerve of birds and mammals. PLoS One. 2010;5:e10774. doi: 10.1371/journal.pone.0010774. [DOI] [PMC free article] [PubMed] [Google Scholar]
- Fogel BL, Wexler E, Wahnich A, Friedrich T, Vijayendran C, Gao F, Parikshak N, Konopka G, Geschwind DH. RBFOX1 regulates both splicing and transcriptional networks in human neuronal development. Hum Mol Genet. 2012;21:4171–4186. doi: 10.1093/hmg/dds240. [DOI] [PMC free article] [PubMed] [Google Scholar]
- Ford KJ, Feller MB. Assembly and disassembly of a retinal cholinergic network. Vis Neurosci. 2012;29:61–71. doi: 10.1017/S0952523811000216. [DOI] [PMC free article] [PubMed] [Google Scholar]
- Freeman NE, Templeton JP, Orr WE, Lu L, Williams RW, Geisert EE. Genetic networks in the mouse retina: growth associated protein 43 and phosphatase tensin homolog network. Mol Vis. 2011;17:1355–1372. [PMC free article] [PubMed] [Google Scholar]
- Galli-Resta L, Novelli E. The effects of natural cell loss on the regularity of the retinal cholinergic arrays. J Neurosci. 2000;20:RC60. doi: 10.1523/JNEUROSCI.20-03-j0005.2000. [DOI] [PMC free article] [PubMed] [Google Scholar]
- Galli-Resta L, Resta G, Tan SS, Reese BE. Mosaics of islet-1 expressing amacrine cells assembled by short range cellular interactions. J Neurosci. 1997;17:7831–7838. doi: 10.1523/JNEUROSCI.17-20-07831.1997. [DOI] [PMC free article] [PubMed] [Google Scholar]
- Gordon PJ, Yun S, Clark AM, Monuki ES, Murtaugh LC, Levine EM. Lhx2 balances progenitor maintenance with neurogenic output and promotes competence state progression in the developing retina. J Neurosci. 2013;33:12197–12207. doi: 10.1523/JNEUROSCI.1494-13.2013. [DOI] [PMC free article] [PubMed] [Google Scholar]
- Hegmann JP, Possidente B. Estimating genetic correlations from inbred strains. Behav Genet. 1981;11:103–114. doi: 10.1007/BF01065621. [DOI] [PubMed] [Google Scholar]
- Ivanova E, Hwang GS, Pan ZH. Characterization of transgenic mouse lines expressing Cre recombinase in the retina. Neuroscience. 2010;165:233–243. doi: 10.1016/j.neuroscience.2009.10.021. [DOI] [PMC free article] [PubMed] [Google Scholar]
- Jeon CJ, Strettoi E, Masland RH. The major cell populations of the mouse retina. J Neurosci. 1998;18:8936–8946. doi: 10.1523/JNEUROSCI.18-21-08936.1998. [DOI] [PMC free article] [PubMed] [Google Scholar]
- Kamachi Y, Uchikawa M, Kondoh H. Pairing SOX off: with partners in the regulation of embryonic development. Trends Genet. 2000;16:182–187. doi: 10.1016/S0168-9525(99)01955-1. [DOI] [PubMed] [Google Scholar]
- Kaneda M, Ishii K, Morishima Y, Akagi T, Yamazaki Y, Nakanishi S, Hashikawa T. OFF-cholinergic-pathway-selective localization of P2X2 purinoceptors in the mouse retina. J Comp Neurol. 2004;476:103–111. doi: 10.1002/cne.20208. [DOI] [PubMed] [Google Scholar]
- Katoh Y, Katoh M. Comparative genomics on SOX2 orthologs. Oncol Rep. 2005;14:797–800. doi: 10.3892/or.14.3.797. [DOI] [PubMed] [Google Scholar]
- Kay JN, Chu MW, Sanes JR. MEGF10 and MEGF11 mediate homotypic interactions required for mosaic spacing of retinal neurons. Nature. 2012;483:465–469. doi: 10.1038/nature10877. [DOI] [PMC free article] [PubMed] [Google Scholar]
- Keane TM, Goodstadt L, Danecek P, White MA, Wong K, Yalcin B, Heger A, Agam A, Slater G, Goodson M, Furlotte NA, Eskin E, Nellåker C, Whitley H, Cleak J, Janowitz D, Hernandez-Pliego P, Edwards A, Belgard TG, Oliver PL, McIntyre RE, Bhomra A, Nicod J, Gan X, Yuan W, van der Weyden L, Steward CA, Bala S, Stalker J, Mott R, Durbin R, Jackson IJ, Czechanski A, Guerra-Assuncão JA, Donahue LR, Reinholdt LG, Payseur BA, Ponting CP, Birney E, Flint J, Adams DJ. Mouse genomic variation and its effect on phenotypes and gene regulation. Nature. 2011;477:289–294. doi: 10.1038/nature10413. [DOI] [PMC free article] [PubMed] [Google Scholar]
- Keeley PW, Whitney IE, Raven MA, Reese BE. Dendritic spread and functional coverage of starburst amacrine cells. J Comp Neurol. 2007;505:539–546. doi: 10.1002/cne.21518. [DOI] [PubMed] [Google Scholar]
- Keeley PW, Whitney IE, Madsen NR, St. John AJ, Borhanian S, Leong SA, Williams RW, Reese BE. Independent genomic control of neuronal number across retinal cell types. Develop Cell. 2014 doi: 10.1016/j.devcel.2014.05.003. doi: 10.1016/j.devcel.2014.05.003. Advance online publication. Retrieved June 18. [DOI] [PMC free article] [PubMed] [Google Scholar]
- Kiefer JC. Back to basics: Sox genes. Develop Dyn. 2007;236:2356–2366. doi: 10.1002/dvdy.21218. [DOI] [PubMed] [Google Scholar]
- Kim IB, Lee EJ, Kim MK, Park DK, Chun MH. Choline acetyltransferase-immunoreactive neurons in the developing rat retina. J Comp Neurol. 2000;427:604–616. doi: 10.1002/1096-9861(20001127)427:4<604::AID-CNE8>3.0.CO%3B2-C. [DOI] [PubMed] [Google Scholar]
- Le RD, Rayner K, Rex M, Wigmore PM, Scotting PJ. The transcription factor cSox2 and Neuropeptide Y define a novel subgroup of amacrine cells in the retina. J Anat. 2002;200:51–56. doi: 10.1046/j.0021-8782.2001.00007.x. [DOI] [PMC free article] [PubMed] [Google Scholar]
- Lefebvre JL, Kostadinov D, Chen WV, Maniatis T, Sanes JR. Protocadherins mediate dendritic self-avoidance in the mammalian nervous system. Nature. 2012;488:517–521. doi: 10.1038/nature11305. [DOI] [PMC free article] [PubMed] [Google Scholar]
- Lin YP, Ouchi Y, Satoh S, Watanabe S. Sox2 plays a role in the induction of amacrine and Muller glial cells in mouse retinal progenitor cells. Invest Ophthalmol Vis Sci. 2009;50:68–74. doi: 10.1167/iovs.07-1619. [DOI] [PubMed] [Google Scholar]
- Marquardt T, Ashery-Padan R, Andrejewski N, Scardigli R, Guillemot F, Gruss P. Pax6 is required for the multipotent state of retinal progenitor cells. Cell. 2001;105:43–55. doi: 10.1016/S0092-8674(01)00295-1. [DOI] [PubMed] [Google Scholar]
- Matsushima D, Heavner W, Pevny LH. Combinatorial regulation of optic cup progenitor cell fate by SOX2 and PAX6. Development. 2011;138:443–454. doi: 10.1242/dev.055178. [DOI] [PMC free article] [PubMed] [Google Scholar]
- Miyagi S, Kato H, Okuda A. Role of SoxB1 transcription factors in development. Cell Mol Life Sci. 2009;66:3675–3684. doi: 10.1007/s00018-009-0097-0. [DOI] [PMC free article] [PubMed] [Google Scholar]
- Mojsin M, Kovacevic-Grujicic N, Krstic A, Popovic J, Milivojevic M, Stevanovic M. Comparative analysis of SOX3 protein orthologs: Expansion of homopolymeric amino acid tracts during vertebrate evolution. Biochem Genet. 2010;48:612–623. doi: 10.1007/s10528-010-9343-2. [DOI] [PubMed] [Google Scholar]
- Prada F, Medina JI, López-Gallardo M, López R, Quesada A, Spira A, Prada C. Spatiotemporal gradients of differentiation of chick retina types I and II cholinergic cells: identification of a common postmitotic cell population. J Comp Neurol. 1999;410:457–466. doi: 10.1002/(SICI)1096-9861(19990802)410:3<457::AID-CNE8>3.0.CO%3B2-1. [DOI] [PubMed] [Google Scholar]
- Reese BE, Colello RJ. Neurogenesis in the retinal ganglion cell layer of the rat. Neuroscience. 1992;46:419–429. doi: 10.1016/0306-4522(92)90062-7. [DOI] [PubMed] [Google Scholar]
- Resta V, Novelli E, Di Virgilio F, Galli-Resta L. Neuronal death induced by endogenous extracellular ATP in retinal cholinergic neuron density control. Development. 2005;132:2873–2882. doi: 10.1242/dev.01855. [DOI] [PubMed] [Google Scholar]
- Schneider A, Bardakjian T, Reis LM, Tyler RC, Semina EV. Novel SOX2 mutations and genotype-phenotype correlation in anophthalmia and microphthalmia. Am J Med Genet A. 2009;149A:2706–2715. doi: 10.1002/ajmg.a.33098. [DOI] [PMC free article] [PubMed] [Google Scholar]
- Shaham O, Smith AN, Robinson ML, Taketo MM, Lang RA, Ashery-Padan R. Pax6 is essential for lens fiber cell differentiation. Development. 2009;136:2567–2578. doi: 10.1242/dev.032888. [DOI] [PMC free article] [PubMed] [Google Scholar]
- Siegert S, Cabuy E, Scherf BG, Kohler H, Panda S, Le YZ, Fehling HJ, Gaidatzis D, Stadler MB, Roska B. Transcriptional code and disease map for adult retinal cell types. Nat Neurosci. 2012;15:487–495. S1–S2. doi: 10.1038/nn.3032. [DOI] [PubMed] [Google Scholar]
- Stacy RC, Wong RO. Developmental relationship between cholinergic amacrine cell processes and ganglion cell dendrites of the mouse retina. J Comp Neurol. 2003;456:154–166. doi: 10.1002/cne.10509. [DOI] [PubMed] [Google Scholar]
- Stone J, Dreher Z. Relationship between astrocytes, ganglion cells and vasculature of retina. J Comp Neurol. 1987;255:35–49. doi: 10.1002/cne.902550104. [DOI] [PubMed] [Google Scholar]
- Sun LO, Jiang Z, Rivlin-Etzion M, Hand R, Brady CM, Matsuoka RL, Yau KW, Feller MB, Kolodkin AL. On and off retinal circuit assembly by divergent molecular mechanisms. Science. 2013;342:1241974. doi: 10.1126/science.1241974. [DOI] [PMC free article] [PubMed] [Google Scholar]
- Surzenko N, Crowl T, Bachleda A, Langer L, Pevny L. SOX2 maintains the quiescent progenitor cell state of postnatal retinal Muller glia. Development. 2013;140:1445–1456. doi: 10.1242/dev.071878. [DOI] [PMC free article] [PubMed] [Google Scholar]
- Taranova OV, Magness ST, Fagan BM, Wu Y, Surzenko N, Hutton SR, Pevny LH. SOX2 is a dose-dependent regulator of retinal neural progenitor competence. Genes Dev. 2006;20:1187–1202. doi: 10.1101/gad.1407906. [DOI] [PMC free article] [PubMed] [Google Scholar]
- Tauchi M, Masland RH. The shape and arrangement of the cholinergic neurons in the rabbit retina. Proc R Soc Lond B. 1984;223:101–119. doi: 10.1098/rspb.1984.0085. [DOI] [PubMed] [Google Scholar]
- Taylor WR, Smith RG. The role of starburst amacrine cells in visual signal processing. Vis Neurosci. 2012;29:73–81. doi: 10.1017/S0952523811000393. [DOI] [PMC free article] [PubMed] [Google Scholar]
- Uchikawa M, Kamachi Y, Kondoh H. Two distinct subgroups of Group B Sox genes for transcriptional activators and repressors: their expression during embryonic organogenesis of the chicken. Mech Dev. 1999;84:103–120. doi: 10.1016/S0925-4773(99)00083-0. [DOI] [PubMed] [Google Scholar]
- Vaney DI, Peichi L, Boycott BB. Matching populations of amacrine cells in the inner nuclear and ganglion cell layers of the rabbit retina. J Comp Neurol. 1981;199:373–391. doi: 10.1002/cne.901990305. [DOI] [PubMed] [Google Scholar]
- Voinescu PE, Emanuela P, Kay JN, Sanes JR. Birthdays of retinal amacrine cell subtypes are systematically related to their molecular identity and soma position. J Comp Neurol. 2009;517:737–750. doi: 10.1002/cne.22200. [DOI] [PMC free article] [PubMed] [Google Scholar]
- Whitney IE, Keeley PW, Raven MA, Reese BE. Spatial patterning of cholinergic amacrine cells in the mouse retina. J Comp Neurol. 2008;508:1–12. doi: 10.1002/cne.21630. [DOI] [PMC free article] [PubMed] [Google Scholar]
- Whitney IE, Raven MA, Ciobanu DC, Williams RW, Reese BE. Multiple genes on chromosome 7 regulate dopaminergic amacrine cell number in the mouse retina. Invest Ophthalmol Vis Sci. 2009;50:1996–2003. doi: 10.1167/iovs.08-2556. [DOI] [PMC free article] [PubMed] [Google Scholar]
- Whitney IE, Raven MA, Lu L, Williams RW, Reese BE. A QTL on chromosome 10 modulates cone photoreceptor number in the mouse retina. Invest Ophthalmol Vis Sci. 2011a;52:3228–3236. doi: 10.1167/iovs.10-6693. [DOI] [PMC free article] [PubMed] [Google Scholar]
- Whitney IE, Raven MA, Ciobanu DC, Poché RA, Ding Q, Elshatory Y, Gan L, Williams RW, Reese BE. Genetic modulation of horizontal cell number in the mouse retina. Proc Natl Acad Sci U S A. 2011b;108:9697–9702. doi: 10.1073/pnas.1103253108. [DOI] [PMC free article] [PubMed] [Google Scholar]
- Williams RW, Gu J, Qi S, Lu L. The genetic structure of recombinant inbred mice: high-resolution consensus maps for complex trait analysis. Genome Biol. 2001;2 doi: 10.1186/gb-2001-2-11-research0046. research0046.0041-0046.0018. [DOI] [PMC free article] [PubMed] [Google Scholar]