

Abstract
Spinocerebellar ataxia type 5 (SCA5), a dominant neurodegenerative disease characterized by profound Purkinje cell loss, is caused by mutations in SPTBN2, a gene that encodes β-III spectrin. SCA5 is the first neurodegenerative disorder reported to be caused by mutations in a cytoskeletal spectrin gene. We have developed a mouse model to understand the mechanistic basis for this disease and show that expression of mutant but not wild-type β-III spectrin causes progressive motor deficits and cerebellar degeneration. We show that endogenous β-III spectrin interacts with the metabotropic glutamate receptor 1α (mGluR1α) and that mice expressing mutant β-III spectrin have cerebellar dysfunction with altered mGluR1α localization at Purkinje cell dendritic spines, decreased mGluR1-mediated responses, and deficient mGluR1-mediated long-term potentiation. These results indicate that mutant β-III spectrin causes mislocalization and dysfunction of mGluR1α at dendritic spines and connects SCA5 with other disorders involving glutamatergic dysfunction and synaptic plasticity abnormalities.
Keywords: long term potentiation, mGluR1α, mouse model, neurodegeneration, Purkinje cells, spinocerebellar ataxia type 5
Introduction
SCA5 is a slowly progressive neurodegenerative disease characterized by gait and limb ataxia, and dysarthria (Ranum et al., 1994; Stevanin et al., 1999; Bürk et al., 2004; Dick et al., 2012). Brain MRI and histopathology supports the clinical findings of predominant cerebellar dysfunction showing extensive atrophy of the cerebellar cortex and cerebellar Purkinje cell loss with minimal extracerebellar findings. SCA5 is caused by mutations in SPTBN2 (Ikeda et al., 2006), a gene that encodes the β-III spectrin protein and is highly expressed in cerebellar Purkinje cells (Ohara et al., 1998). While mutations in other cytoskeletal spectrin genes have been reported in hematologic disorders (Bennett and Healy, 2008), SCA5 is the first example of a neurodegenerative disorder caused by mutations in a spectrin gene. To date, seven distinct SPTBN2 mutations have been reported in families with neurodegenerative disease. Five of these mutations are associated with dominant spinocerebellar ataxia (SCA5) and two mutations are found in patients with more complex recessive disorders involving early onset motor and cognitive deficits (Ranum et al., 1994; Bürk et al., 2004; Ikeda et al., 2006; Lise et al., 2012; Cho and Fogel, 2013; Jacob et al., 2013; Elsayed et al., 2014). In addition to providing insight into SCA5 pathogenesis, identifying how these novel spectrin mutations cause ataxia will broaden our understanding of the role of cytoskeletal proteins in neurologic disease and the molecular pathways leading to neurodegeneration.
Like other spectrins (Bennett and Healy, 2008), β-III spectrin may play a role in anchoring integral membrane proteins at specific plasma membrane domains. Consistent with this hypothesis, cell culture studies show that β-III spectrin increases glutamate transport by the excitatory amino acid transporter 4 (EAAT4) in HEK293 cells (Jackson et al., 2001). The altered distribution of EAAT4 in human SCA5 autopsy tissue and the failure of mutant β-III spectrin to restrict lateral mobility of EAAT4 at the membrane in cell culture show that mutant β-III spectrin does not properly anchor EAAT4 at the plasma membrane (Ikeda et al., 2006). However, the lack of an overtly ataxic phenotype in EAAT4 knock-out mice (Maragakis and Rothstein, 2004) raises the possibility that mutant β-III spectrin may cause disease in SCA5 by affecting other integral membrane proteins. One candidate protein for this hypothesis is the metabotropic glutamate receptor 1α (mGluR1α). Like β-III spectrin (Jackson et al., 2001) and EAAT4 (Dehnes et al., 1998), mGluR1α has a perisynaptic distribution pattern in dendrites of cerebellar Purkinje cells (Baude et al., 1993). Additionally, mGluR1α expression in Purkinje cells is critical for normal cerebellar function and synaptic plasticity (Aiba et al., 1994; Conquet et al., 1994; Ichise et al., 2000; Wang et al., 2009), which makes mGluR1α an attractive candidate for dysregulation in cerebellar disease. We now report the first transgenic mouse model of SCA5, in which mutant β-III spectrin is expressed in cerebellar Purkinje cells. These mice develop progressive cerebellar degeneration consistent with the human disease and have deficits in mGluR1 localization and function.
Materials and Methods
Generation of transgenic mice.
The Tet-response element (TRE) and minimal CMV promoter from the plasmid pTRE2 (Clontech) were cloned upstream of a full-length SPTBN2 pBluescript cDNA clone (KIAA0302; Kazusa DNA Research Institute). Coding errors were fixed (QuikChange II XL Site-Directed Mutagenesis Kit; Stratagene) and the American SCA5 mutation was generated using overlapping PCR as previously described. The resulting TRE-SP-WT and TRE-SPΔ39 transgenes were cut from the vector backbone and injected into FVB/N zygotes at the University of Minnesota Transgenic Mouse Facility. Identification of transgene-positive founders and independently segregating integration sites was performed by Southern blotting. Animals were routinely genotyped by multiplex PCR with primers to amplify the TRE-SP transgene (TRE1-F [5′-ATCCACGCTGTTTTGACCTC-3′] and TRE1-R [5′-GTTGGCTGCTCAGTGGAAC-3′]) and the tTA transgene (tTA-F [5′-CGCTGTGGGGCATTTTACTTTAG-3′] and tTA-R [5′-CATGTCCAGATCGAAATCGTC-3′]), with an initial 3 min denaturation at 94°C, then 35 cycles (94°C for 45 s, 57°C for 45 s, 72°C for 1 min), followed by a final 6 min elongation at 72°C. Both male and female mice were used. Mice were housed in a specific pathogen-free facility, and animal care adhered to guidelines established by the Institutional Animal Care and Use Committee at both the University of Minnesota and the University of Florida.
Transgene expression analysis.
Total RNA was extracted from frozen cerebella of 3-week-old Pcp2-tTA+/−/TRE-SP+/− mice using TRIzol (Invitrogen). Two micrograms of total RNA from each animal was treated with amplification grade DNase (Invitrogen). Half of each DNase reaction was reverse transcribed using the SuperScript First-Strand Synthesis System for RT-PCR (Invitrogen) with random primers, and the other half was processed identically except that the reaction lacked reverse transcriptase (−RT). Absence of PCR product from –RT samples, confirming lack of DNA contamination, was verified before proceeding to qRT-PCR. Two-stage PCR was performed using 10% of each reverse transcription reaction and Platinum SYBR Green qPCR SuperMix-UDG with ROX (Invitrogen) for 40 cycles (95°C for 15 s, 60°C for 1 min) on a Mastercycler ep realplex (Eppendorf). TRE1-F and TRE1-R primers amplified the transgene TRE-SP transcript and calbindin1-F (5′-AGGCTGGATTGGAGCTATCA-3′) and calbindin1-R (5′-TTCCTCGCAGGACTTCAGTT-3′) primers amplified the housekeeping gene calbindin transcript, with each reaction performed in duplicate. The threshold cycle (CT) of the transgenic TRE-SP transcript normalized to the CT of the calbindin transcript was used to estimate the relative quantitation of each line normalized to line 643 Pcp2-tTA+/−/TRE-SPΔ39+/− animals (n = 3 animals for each line). qPCR product purity was confirmed by dissociation curve analysis and ethidium bromide gel analysis.
Thrombin cleavage of mouse β-III spectrin.
Cerebellar tissue was taken from human, nontransgenic FVB/N mice, SCA5 lines 184–2, 645, and control line 225 mice and homogenized in ice-cold lysis buffer (150 mm Tris-HCl, 50 mm NaCl, and 1% Triton X-100, pH 7.5) with 1× protease inhibitors (cOmplete, Mini, EDTA-free; Roche). Lysates were clarified by centrifugation at 1000 × g for 15 min at 4°C and incubated on ice for 1 h. Optimal thrombin cleavage conditions were determined by performing a serial dilution of the enzyme (1–0.0625 U) and testing a series of different treatment times from 2–16 h at 25°C. Treatment conditions chosen allowed complete digestion of the C-terminal thrombin cleavage site found in mouse β-III spectrin and minimal nonspecific cleavage of human β-III spectrin as determined by immunoblotting. Total protein (250 μg) was treated with 0.25 U thrombin (Novagen) for 16 h at room temperature. The protease reaction was inactivated by adding equal parts Laemmli buffer and boiling samples at 95°C for 5–10 min. Twenty microliters of the treated and untreated samples were separated by SDS-PAGE, transferred to a PVDF membrane, and blocked in PBS with 0.1% Triton X-100 (PBS-T) containing 5% skim milk. The membrane was incubated with a β-III spectrin (sc-28273; Santa Cruz Biotechnology; 1:2000) rabbit polyclonal antibody in PBS-T containing 1% skim milk. Following subsequent incubation with anti-rabbit HRP-conjugated secondary antibody (GE Healthcare; 1:2000), bands were visualized with enhanced chemiluminescence reagent (PerkinElmer).
Immunoprecipitations.
Whole cerebella from nontransgenic FVB/N mice 2–3 months of age were homogenized in ice-cold immunoprecipitation (IP) buffer (10 mm sodium phosphate, pH 7.4, 130 mm NaCl, 2 mm EDTA, and 0.1% Triton X-100) with 1× protease inhibitors (cOmplete, Mini, EDTA-free; Roche). Lysates were clarified twice by centrifugation at 10,000 × g for 5 min at 4°C. Lysates were precleared twice for 20 min with Protein G Sepharose or Protein A Sepharose beads (GE Healthcare), then immunoprecipitated at 4°C with mGluR1α antibody (EMD Chemicals), HA antibody (Sigma), β-III spectrin antibody (Santa Cruz Biotechnology), or no antibody (mock). Protein G Sepharose or Protein A Sepharose beads (same type used for preclearing) were added to each tube and incubated at 4°C for 1 h. Beads were washed six times in 1 ml ice-cold IP buffer, and then resuspended in NuPAGE LDS sample buffer (Invitrogen). Samples were vortexed, boiled for 5 min, separated by SDS-PAGE, and transferred to a nitrocellulose membrane. The membrane was blocked in 5% skim milk in PBS-T, then incubated with β-III spectrin antibody (Santa Cruz Biotechnology) or mGluR1α antibody (EMD Chemicals) in 1% skim milk in PBS-T. Bands were visualized with enhanced chemiluminescence reagent (GE Healthcare) after incubation with HRP-conjugated anti-goat secondary antibody (Santa Cruz Biotechnology) or HRP-conjugated anti-rabbit secondary antibody (GE Healthcare).
Immunoblotting.
Frozen cerebella from SCA5 line 184–2 (n = 5) and control line 225 (n = 4) mice aged 9–11 months were homogenized in ice-cold 0.25 m Tris, pH 7.5, with 1× protease inhibitors (cOmplete, Mini, EDTA-free; Roche). After three freeze-thaw cycles and repeated passage through a 27 gauge needle, lysates were clarified twice by centrifugation at 700 × g for 5 min at 4°C and incubated on ice for 1 h with 20 mm dithiothreitol. Five micrograms of total protein was separated by SDS-PAGE, transferred to a nitrocellulose membrane, and blocked in PBS-T containing 5% skim milk. The membrane was incubated with mGluR1α (EMD Chemicals) or calbindin D28K (Sigma) antibodies in PBS-T containing 1% skim milk. After incubation with HRP-conjugated secondary antibodies (GE Healthcare), bands were visualized with enhanced chemiluminescence reagent (GE Healthcare). Quantitation was performed with Molecular Analyst Software after scanning with the Model GS-700 Imaging Densitometer (Bio-Rad). Graph shows the average amount of mGluR1α (sum of monomer and dimer values) relative to the amount of calbindin as a percentage of the average value for control line 225 mice.
Rotarod analysis.
Rotarod latency was assessed using 6- to 9-week-old, 16-week-old, and 26-week-old mice using an accelerating rotarod apparatus (Ugo Basile EZ-rod; AccuScan) as previously described (Clark et al., 1997). Mice underwent four trials per day for 4 consecutive days, with at least 10 min rest between trials. For each trial the rod accelerated from 4 to 40 rpm over 5 min, then remained at 40 rpm for five additional minutes. Latency was scored as time until the mouse fell from the rod or clasped the rod without moving paws for greater than two consecutive rotations, up to a maximum time of 10 min.
Gait analysis.
We used the DigiGait System (Mouse Specifics) to assess gait parameters in age-matched SCA5 and control mice between the ages of 12 and 16 months. An animal was placed in the apparatus and the belt was turned on at a speed of 23 cm/s. Five seconds of footage was collected while the animal was running smoothly within the frame of the camera. If acceptable footage was not collected after 1 min, the animal was returned to its home cage and excluded from analysis. Similar levels of attrition were observed between SCA5 and control groups (data not reported). The belt was cleaned with 70% ethanol and dried between each animal. Footage was analyzed using DigiGait (Mouse Specifics) software.
Yeast two hybrid.
Standard cloning techniques were used to generate constructs and all clones were confirmed by DNA sequencing. The Matchmaker System 3 DNA-binding domain (BD) and activation domain (AD) fusion vectors, pGBKT7 and pGADT7, were used to assess protein–protein interactions. To construct SR2–4 a human wild-type SPTBN2 fragment containing spectrin repeats 2–4 (amino acids 416–745) was cloned in frame with the GAL4 DNA-BD and a myc tag in the vector pGBKT7 (Clontech). SR2–4Δ39 was constructed by introducing the American mutation into pGBKT7-SR2–4. Similarly, to construct the SR14–16 clone, a human wild-type SPTBN2 fragment containing spectrin repeats 14–16 (amino acids 1694–2011) was cloned in frame with the GAL4 DNA binding domain and a myc tag in vector pGBKT7. To construct mGluR1α a human wild-type GRM1 fragment containing a fragment of the C-terminal (amino acids 1077–1194) was cloned in frame with the GAL4 AD. pGADT7-mGluR1α was transformed into the yeast strain SFY526α (MATα, ura3–52, his3–200, ade2–101, lys2–801, trp1–901, leu2–3, 112, canr, gal4–542, gal80–538, URA3:: GAL1UAS-GAL1TATA-lacZ), a generous gift from Dr. Judith Berman (University of Minnesota, Saint Paul MN). Colonies were grown on Minimal Base agar plates with Dropout Supplements to maintain selective pressure on the transformed plasmids. A positive colony was made competent and then transformed with empty pGBKT7 vector or vector containing a β-III spectrin clone. Selective pressure was maintained on both transformed plasmids. Six independent colonies were selected from each transformation and grown in the appropriate selective liquid medium. Interaction strength was determined using β-galactosidase assays (performed in triplicate from each colony) using the substrate chlorophenol red-β-d-galactopyranoside (CPRG), as described in the Clontech Yeast Protocols Handbook. Data are reported as mean ± SEM, with analysis performed as described (see below, Statistical analyses).
Total internal reflection fluorescence microscopy.
Total internal reflection fluorescence microscopy (TIRF) imaging was performed in a Zeiss Axio Observer Z1 inverted microscope equipped with a motorized TIRF slider and Definite Focus. GFP was imaged with a 488 nm laser and Zeiss 38 HE GFP emission filter. All images were obtained with a 100×/1.46 NA Alpha Plan-Apo objective. Images were collected with an EM-CCD Photometrics QuantEM camera using AxioVision 4.82 software. Transfected HEK293T cells (pCMV6-AC-mGluR1α-GFP NM_000838, pcDNA3.1-β-III spectrin, and pcDNA3.1-Δ39-β-III spectrin) were plated on glass-bottom dishes (MatTek). During image acquisition cells were maintained at 4% CO2 and 37°C using a temperature controller. Time-lapse images were acquired every 500 ms/60 s. Blinded images were analyzed using Fiji–ImageJ software (http://rsb.info.nih.gov/ij/). We defined stabilized receptors as GFP-positive molecules that persisted at the membrane through a 60 s image acquisition. The total number of receptors present in frame one was counted using the analyze particles tool. Each receptor present in frame one was tracked and evaluated for its persistence in the plasma membrane. Data represented as a percentage of the total number of receptors present in the initial frame. Receptors that appeared after frame one were excluded. Data are reported as mean ± SEM, with analysis performed as described (see below, Statistical analyses).
Immunofluorescence.
Mice were anesthetized and transcardially perfused with PBS followed by 10% phosphate-buffered formalin. Brains were dissected out of skull, postfixed overnight in 10% phosphate-buffered formalin, and stored at 4°C in PBS. Vibratome (50-μm-thick) sections were boiled three times in 0.01 m urea to expose epitopes. After blocking in PBS with 0.3% Triton X-100 and 2% normal serum, slices were incubated for 48 h at 4°C with antibodies against calbindin (Sigma) or mGluR1α (EMD Chemicals) diluted in blocking solution. Slices were washed four times for 20 min in PBS. After incubation for 48 h at 4°C with Alexa Fluor 488-conjugated anti-mouse IgG (Invitrogen) and Cy3-conjugated anti-rabbit IgG (Jackson ImmunoResearch) antibodies diluted 1:500 in blocking solution, slices were washed four times for 20 min in PBS. Sections were mounted in Gel Mount (Biomedia) and stored in the dark at −20°C.
Quantification of molecular layer thickness.
Calbindin-stained vibratome sections from 5-week-old, 37-week-old, and 80-week-old mice were imaged by confocal microscopy with an Olympus FluoView FV1000 inverted confocal microscope at 200× magnification. Molecular layer thickness at the primary fissure for each mouse was calculated by measuring from the edge of a Purkinje cell body to the fissure. Five independent measurements on each side of the primary cerebellar fissure were taken for a total of 10 measurements per animal. Data are reported as mean ± SEM, with analysis performed as described (see below, Statistical analyses).
Quantification of mGluR1α clustering.
Sections were imaged by confocal microscopy with an Olympus FluoView FV1000 inverted confocal microscope at 2400× magnification. Analysis was modeled after techniques described by Das and Banker (2006) using NIH ImageJ software (http://rsb.info.nih.gov/ij/). We defined mGluR1α clusters as regions having twice the average intensity of the entire image. Normalized cluster size was defined as the average size of particles identified by setting the threshold for each image to twice the average intensity of the entire image, normalized to the average cluster size for control line 225 images taken with the same microscope settings on the same day. Normalized cluster area was defined as the percentage of image area selected by this threshold, normalized to the average cluster area calculated for control line 225 images taken with the same microscope settings on the same day. Data are reported as mean ± SEM, with analysis performed as described (see below, Statistical analysis).
Magnetic resonance spectroscopy analysis.
Magnetic resonance spectroscopy (MRS) data were collected from the cerebella of SCA5 line 184–2 (n = 8) and control line 225 (n = 7) mice. To introduce interlitter variability, mice from three litters from each line were studied. To assess the progression of N-acetylaspartate (NAA) levels in each line, four control mice and six SCA5 mice were scanned at 37–38 and 44–46 weeks of age, two control mice were scanned at 46 and 51 weeks, one control mouse was scanned at 53 and 59 weeks, and two SCA5 mice were scanned at 45 and 58 weeks of age. Because data were not available at identical time points for the control and SCA5 mice, progression of the neuronal marker NAA was assessed by comparing its change per week between the two groups.
Methods to acquire MRS data from the cerebella of SCA5 and control mice were identical to those described before (Oz et al., 2010b). Briefly, mice were scanned on a 9.4 T/31 cm magnet (Magnex Scientific) interfaced to a Varian Inova console (Varian) under 1.5–2% isoflurane anesthesia while monitoring body temperature and respiration rate with an MR compatible physiology monitoring system (SA Instruments). Body temperature was maintained at 36−37°C with a heating fan system and respiration rate at 70–120 bpm by adjusting the anesthetic level. A 7 μl volume of interest (VOI) centered on the midline in the cerebellum was selected based on coronal and sagittal multislice images and was reproducibly placed in follow-up scans by using anatomical landmarks. Following adjustment of first- and second-order shims using FASTMAP with echo-planar readout (Gruetter and Tkác, 2000), localized 1H MR spectra were acquired with a short-echo localization by adiabatic selective refocusing (LASER) sequence (TE = 15 ms, TR = 5 s, 256 averages; Garwood and DelaBarre, 2001). Neurochemical concentrations were quantified using an automated deconvolution program (LCModel) the LCModel software (Provencher, 1993) relative to an unsuppressed water spectrum acquired from the same VOI, as described previously (Oz et al., 2010b).
Flavoprotein autofluorescence and Ca2+ optical imaging.
Optical imaging was performed as previously described (Wang et al., 2011). SCA5 and age-matched control mice at 7–11 months of age were anesthetized with urethane, mechanically ventilated, and core temperature maintained. Animals were placed in a stereotaxic frame, Crus I and II of the cerebellar cortex were exposed, and the dura removed. An acrylic chamber was constructed around the exposed folia and filled with normal Ringer's solution. The mouse and stereotaxic frame were placed on a large stage with precision X and Y translation. Both flavoprotein and Ca2+ imaging used Nikon epifluorescence optics. For flavoprotein imaging, excitation light was passed through a bandpass filter (420–490 nm) and the emitted epifluorescence was passed through a long-pass filter (515 nm) using a 500 nm dichroic mirror. For Ca2+ imaging a glass microelectrode was used to make pressure injections of a solution of Oregon Green 488 BAPTA-1/AM dissolved in DMSO plus 20% Pluronic F-127 solution throughout Crus II. Ca2+ imaging used an excitation bandpass filter of 490–510 nm, a 515 nm dichroic mirror, and a bandpass filter of 520–530 nm. The camera was focused just below the surface of the cerebellar cortex and primary fissure (PF) was activated by a tungsten microelectrode placed just into the molecular layer. The basic imaging paradigm consisted of collecting a time series of 200 ms (flavoprotein) or 100 ms (Ca2+) images before, during, and after PF stimulation. For flavoprotein imaging PF stimulation consisted of a train of 10 pulses at 100 Hz (200 μA, 100 μs) and for calcium imaging 5 pulses at 100 Hz (100 μA, 100 μs).
Having obtained a series of images, the optical response was determined by subtracting the average of the first 20 background images (control images before PF stimulation) from all the images acquired to generate a series of “difference” images. These difference images were then divided by the control average on a pixel-by-pixel basis, in which the intensity value of each pixel reflects the change in fluorescence intensity relative to the average of the control frames (ΔF/F). To quantify the response to PF stimulation, a region of interest (ROI) defined by the evoked beam or long-term patches was visually determined and the same ROI was used throughout an experiment to quantify any changes in the response. For the beam, the response to the PF stimulation consisted of an initial increase in fluorescence (light phase) that is tightly coupled to the strength of the stimulation (Reinert et al., 2004). Therefore, the analysis was restricted to the light phase, averaging the five frames centered on the peak amplitude of the light phase to obtain the average ΔF/F within the ROI. The long-latency patches occur ∼25–30 s after PF stimulation and an ROI was defined for each patch and the 25 frames were averaged around the peak to obtain the amplitude (Wang et al., 2011).
The optical responses were displayed by superimposing pixels with fluorescence changes evoked by PF stimulation (above or below the mean ± 2.5 SD) onto an image of the background fluorescence (Wang et al., 2009). Increases in fluorescence were pseudocolored using yellow to red and decreases in fluorescence using green to blue.
In some experiments the effects of the AMPA antagonist, DNQX, the mGluR1 antagonist, LY367385, and the NMDA antagonist, APV (Tocris Bioscience), on the responses to PF stimulation were tested. In these experiments, there was an initial baseline period, followed by drug application, and then the drug was thoroughly washed out.
For the LTP experiments of either the beam or long-latency patches, the first 35 min was used to establish the baseline response to a “test” PF stimulation (5 min intervals) consisting of a brief train of 10 pulses at 100 Hz (175 μA, 150 μs duration). This was followed by the conditioning stimulation consisting of high-frequency, burst stimulation (15 pulses at 100 Hz) repeated every 3 s for 5 min. To evaluate the effect of the conditioning stimulation, the PF test stimulation was applied at 5 min intervals for 120 min. The recording and monitoring of the field potentials to PF stimulation also followed previously detailed methods using conventional techniques (Wang et al., 2011). The N2 component was used as a measure of the postsynaptic response (Fig. 7; Eccles et al., 1967; Wang et al., 2011). As also done previously, due to the long duration of the recordings the N2 component was normalized to the P1/N1 (presynaptic component) to account for any variability in the PF volley.
Figure 7.

Loss of mGluR1-mediated LTP in SCA5 mice. a, Example experiments in an SCA5 line 184–2 mouse and a control line 225 mouse of the responses to parallel fiber test stimulation before (baseline) and after (10, 30, and 80 min) high-frequency, burst parallel fiber conditioning. The flavoprotein responses were thresholded and displayed on an image of the folium. The striped region in the center of the pseudocolored scale bar represents the pixels falling within the mean ± 2.5 SD statistical threshold and these pixels are not displayed. Scale bar, 1 mm. b, Average optical responses relative to baseline (mean ± SEM) before and after the conditioning stimulation for control line 225 (n = 8), SCA5 line 645 (n = 8), and SCA5 line 184–2 (n = 4). c, Image showing the field potential recording procedure with the microelectrode position in the center of the flavoprotein optical response evoked by the stimulation electrode and includes an example of the presynaptic (P1/N1) and postsynaptic (N2) response evoked by parallel fiber stimulation. Example field potentials shown at an increased gain illustrate the baseline postsynaptic component (N2) during the baseline (black) and 50 min (red) after the conditioning for both the control and mutant mice. d, Plots of the optical (black symbols) and N2 amplitudes (gray symbols) for control (circle; n = 4) and SCA5 mutant mice (triangle; n = 4).
Statistical analyses.
Group means from rotarod and histological experiments were compared using ANOVA followed by post hoc analysis (Student's t test), assuming two-tailed distribution and two-sample unequal variance. The change in NAA concentration per week was compared between the SCA5 and control groups by a Student's t test, assuming two-tailed distribution and two-sample unequal variance. All imaging and electrophysiological data are reported as mean ± SEM. The statistical analyses of the LTP experiments compared the responses in the baseline period with the responses in the 2 h period following the conditioning stimulation (Wang et al., 2009). Using an ANOVA (within-subject design with repeated measures), we tested for significant differences between the baseline period and the postinduction period (α = 0.05). A between-subjects design with repeated-measures ANOVA was used to compare the optical responses between different mouse lines. An ANOVA (within-subject design with repeated measures) was also used to evaluate the effects of the glutamate receptor antagonists, comparing the amplitude of the optical responses before and during the application of the drugs.
Results
Generation of transgenic animals
To better understand the molecular mechanisms underlying SCA5, we developed and characterized a conditional transgenic mouse model of the disease by expressing wild-type or mutant human β-III spectrin in Purkinje cells. We selected the 39 bp in-frame deletion mutation found in an American SCA5 family, which was previously shown to disrupt the normal stabilization of EAAT4 at the plasma membrane (Ikeda et al., 2006). We used untagged versions of the wild-type and mutant transgenes (TRE-SP-WT and TRE-SPΔ39) to ensure we were assessing the effects of the mutation without introducing additional changes to the protein that could inadvertently disrupt spectrin function. Because β-III spectrin is highly expressed in cerebellar Purkinje cells (Ohara et al., 1998) and because there is prominent Purkinje cell loss in SCA5 patients (Ikeda et al., 2006), we bred the TRE-SP-WT and TRE-SPΔ39 mice to previously characterized Pcp2-tTA transgenic mice (Zu et al., 2004; Fig. 1a) to generate doubly transgenic mice that express recombinant wild-type or mutant β-III spectrin transgenes specifically in cerebellar Purkinje cells. qRT-PCR, using transgene-specific primers, showed that mutant SCA5 lines (Pcp2-tTA+/−/TRE-SPΔ39+/−) 184–2 and 645 express the transgene at the RNA level, and that mice from control line 225 (Pcp2-tTA+/−/TRE-SP-WT+/−) express wild-type spectrin transcripts at higher levels than the mutant lines (Fig. 1b).
Figure 1.

Transgene design and expression. a, Schematic diagram showing transgenes used to express SCA5 mutant or wild-type human SPTBN2 transgenes. Pcp2-tTA+/−/TRE-SP-WT+/− control mice express wild-type human β-III spectrin in cerebellar Purkinje cells. Pcp2-tTA+/−/TRE-SPΔ39+/− SCA5 mice express human β-III spectrin with the American SCA5 deletion in cerebellar Purkinje cells. b, Mean relative cerebellar transgenic RNA levels in 3-week-old mice, n = 3 for all lines. c, Top, Immunoblot analyses of cerebellar lysates to compare β-III spectrin protein levels between non-TRE Pcp2-tTA controls with control wild-type SCA5 (line 225), and mutant SCA5 lines (645 and 184–2) at 3 weeks of age. Calbindin was used as the loading control. Bottom, Immunofluorescence staining of cerebellar sections with α-calbindin and α-β-III spectrin antibodies in control 225 and SCA5 184–2 mice. Scale bars, 10 μm. d, Top, Schematic diagram showing strategy to cleave mouse but not human β-III spectrin protein with thrombin. Bottom, Protein blot showing uncleaved recombinant human protein is expressed in 225 control and SCA5 184–2, and 645 lines. Thrombin protease (Novagen) recognizes a peptide sequence present only in the endogenous mouse β-III spectrin and is predicted to cleave at peptide 2187, removing the C-terminal antibody sc-28273 recognition site (p. 2311–2380). e, Top, EAAT4 immunoblot of cerebellar lysates from SCA5 line 184–2 and control line 225 mice at 9–11 months of age with densitometric quantitation showing no significant difference in the EAAT4:calbindin ratio between genotypes (t test; p = 0.78). Cerebellar immunofluorescence of calbindin and EAAT4 in control line 225 and SCA5 line 184–2 mice. Scale bars: 100 μm. Data are expressed as mean ± SEM.
Protein blot analyses of the doubly transgenic mutant (184-2 and 645) and control (225) lines show that transgenic mice have comparable levels of total β-III spectrin protein compared withPcp2-tTA controls (Fig. 1c). Immunofluorescence staining shows relatively high levels of β-III spectrin in Purkinje cells in both SCA5 mice and controls, without apparent alteration in β-III spectrin localization in SCA5 mice (Fig. 1c). Because the available β-III spectrin antibodies do not distinguish between endogenous and transgenic β-III spectrin, we developed a protein cleavage assay to confirm that the transgenic mice express recombinant human β-III spectrin protein. The protease thrombin was used to cleave the C-terminal region of the endogenous mouse but not the transgenic human β-III spectrin protein (Fig. 1d). After proteolytic cleavage, a C-terminal specific β-III spectrin antibody was used to confirm that the human transgenic protein is expressed in our mice (Fig. 1d). Because some nonspecific cleavage of the human protein also occurs, this assay cannot be used to quantify transgenic protein levels. In summary, these results demonstrate that mice from all three of our transgenic lines express recombinant human β-III spectrin protein.
Because β-III spectrin binds EAAT4, we performed protein blot analyses to test if the mutations had any effect on protein levels. Our results show EAAT4 levels are not reduced in SCA5 compared with control mice (Fig. 1e). These data are consistent with preserved EAAT4 levels in human SCA5 autopsy tissue (Ikeda et al., 2006) and are in contrast to the reduced levels of EAAT4 protein seen in SPTBN2 knock-out mice (Perkins et al., 2010; Stankewich et al., 2010).
Expression of mutant β-III spectrin causes progressive motor incoordination and cerebellar degeneration
To test the effects of the SCA5 mutations on the cerebellum we performed a series of behavioral and histological studies. The SCA5 mutant lines had significant deficits on the accelerating rotarod at 26 weeks compared with controls (Fig. 2a) but not at earlier time points (6–9 and 16 weeks; Fig. 2b,c). Additionally, these SCA5 mutant mice exhibited alterations in gait consistent with changes seen in other ataxia models (Hannigan et al., 1993), with increases in both step angle variance and stance width (Fig. 2d). Histological studies showed that the SCA5 but not control lines had thinning of the cerebellar molecular layer, which contains Purkinje cell dendrites (Fig. 3a,b). These changes were seen at 37 and 80 weeks but not 5 weeks in the 184–2 line and 80 but not 37 weeks in the 645 line. Cerebellar NAA concentrations, as measured by MRS, declined with age in the SCA5 compared with control mice, − 0.11 μmol/g versus 0.02 μmol/g per week, respectively, p = 0.04 (Fig. 3c). Previous studies showed that decreased cerebellar NAA level correlates with molecular layer thinning and pathological severity in another mouse model of ataxia (Oz et al., 2010b) and with deteriorating clinical status in patients with ataxia (Oz et al., 2010a); therefore, declining cerebellar NAA levels appear to be a reliable in vivo marker of progressive neuronal dysfunction and/or loss. These results indicate that expression of mutant but not wild-type β-III spectrin in cerebellar Purkinje cells causes a progressive impairment in motor coordination and mild degenerative cerebellar changes.
Figure 2.

Expression of mutant β-III spectrin in Purkinje cells reduces motor coordination. a, Average latency on the accelerating rotarod was assessed in age-matched mice at 26 weeks of age. b, c, Average latency on the accelerating rotarod was assessed at 6–9 weeks (b) and 16 weeks (c). Values shown are averages of all four trials for each day. d, DigiGait analyses of step angle variance and stance width in SCA5 mice and age-matched controls between 12 and 16 months of age. Error bars represent SEM. ANOVA followed by post hoc analysis (Student's t test) was performed to compare groups; *p < 0.05 compared with Pcp2-tTA+/− mice.
Figure 3.
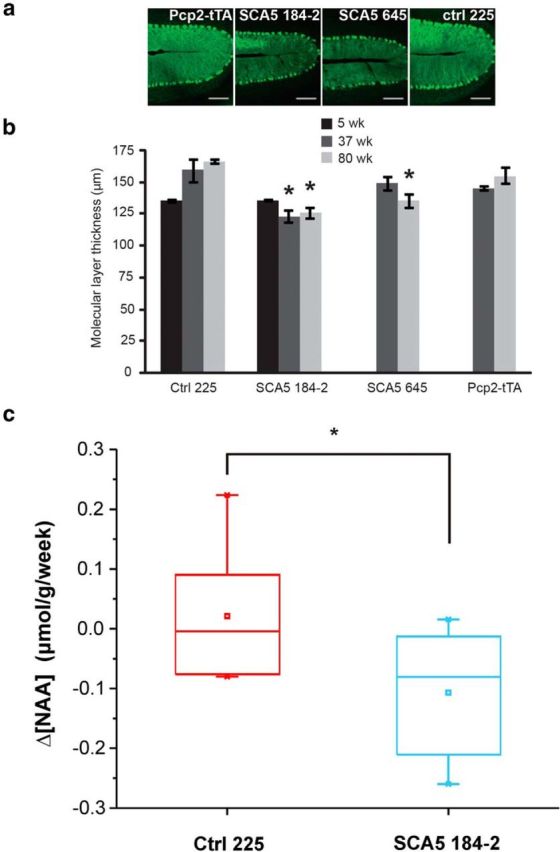
Expression of mutant β-III spectrin in Purkinje cells causes progressive cerebellar degeneration. a, Representative images showing calbindin antibody staining of the primary cerebellar fissure at 80 weeks of age. Scale bars, 100 μm. b, Progressive thinning of the molecular layer is seen in mutant but not control lines. Mice from the 184–2 mutant line show progressive thinning of the molecular layer compared with controls at 37 (control 225, n = 4; SCA5 184–2, n = 4; p = 0.02) and 80 (control 225, n = 3; SCA5 184–2, n = 3; p = 0.008) but not 5 weeks, and mice from the 645 mutant line show significant thinning at 80 (control 225, n = 3; SCA5 645, n = 4; p = 0.009) but not 37 weeks of age. Control line 225 is not significantly different from Pcp2-tTA+/− mice at 37 weeks or 80 weeks. Graph shows mean values ± SEM; *p < 0.05 compared with age-matched control 225 mice. c, Box plot showing change of NAA concentration per week in the cerebella of SCA5 mice (n = 8) and controls (n = 7), each scanned twice at various time points from 37–59 weeks of age. The weekly change in NAA concentration was significantly different (*p = 0.04) in SCA5 mice (−0.11 μmol/g) compared with controls (0.02 μmol/g).
β-III spectrin interacts with mGluR1α
Reported similarities in Purkinje cell distribution patterns of β-III spectrin (Jackson et al., 2001) and the metabotropic glutamate receptor mGluR1α (Baude et al., 1993) suggest that mGluR1α may be another integral membrane protein stabilized by β-III spectrin. Co-IP analyses of endogenous proteins using mouse cerebellar lysates show that β-III spectrin and mGluR1α coprecipitate (Fig. 4a,b), suggesting that β-III spectrin and mGluR1α biochemically interact. Additional IP experiments in cell culture using tagged constructs show that the American SCA5 mutation does not disrupt this interaction (Fig. 4c).
Figure 4.
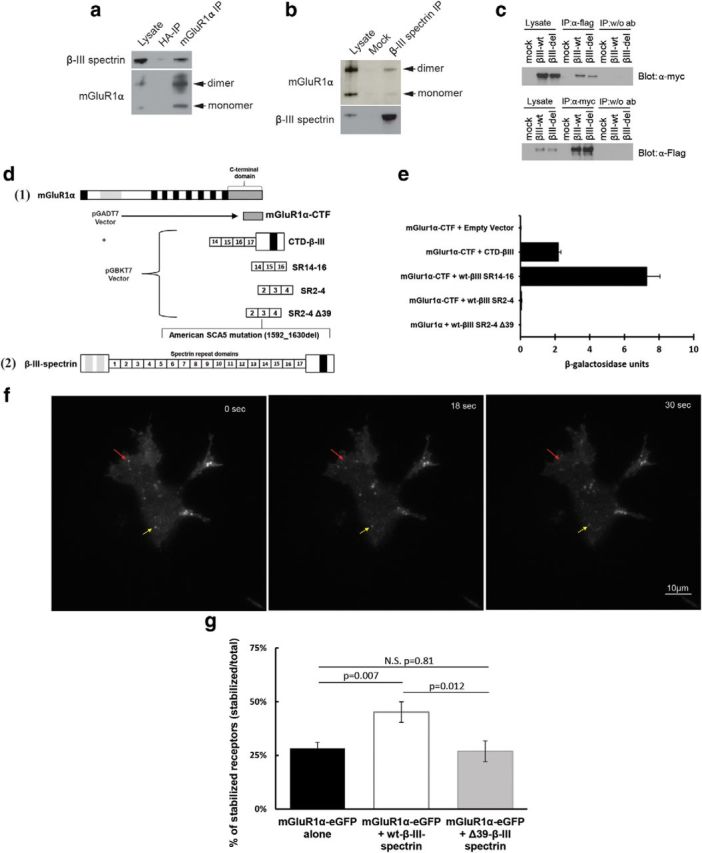
β-III spectrin interacts with mGluR1α. a, IP of cerebellar lysates from nontransgenic mice with anti-mGluR1α (mGluR1α IP) or control anti-hemagglutinin antibody (HA-IP). b, Cerebellar lysates from nontransgenic mice immunoprecipitated with the anti-β-III spectrin (β-III spectrin IP) or no antibody (Mock). c, Lysates from HEK293T-cells transfected with empty vector, myc-tagged wild-type β-III spectrin, and FLAG-tagged mGluR1α, or myc-tagged mutant β-III spectrin and FLAG-tagged mGluR1α were immunoprecipitated with the anti-myc antibody. d, Schematic diagram of clones used for Y2H analyses of mGluR1α/ β-III spectrin interaction. Schematic diagrams for the full-length mGluR1 (1) and B-III spectrin (2) are shown at the top and bottom of d, respectively. The C-terminal domain of mGlur1α (mGluR1α-CTF) containing the last 133 aa was used for all Y2H experiments. The β-III spectrin clones are as follows: CTD-β-III, spectrin contains spectrin repeat 14 through end of protein; SR14–16, spectrin repeats 14–16; SR2–4, spectrin repeats 2–4; SR2–4Δ39, spectrin repeats 2–4 containing the American mutation (1592_1630del). e, Resulting β-galactosidase levels detected by the CPRG assay. f, Illustration of TIRF analysis in transfected HEK293T cells. Red arrow shows a receptor present at the beginning of time-lapse images. In this example, the receptor leaves the membrane before 30 s and is scored as an unstable receptor. The yellow arrow shows a receptor persisting at the membrane for the entire 60 s, which is scored as a stabilized receptor using Fiji ImageJ (NIH) software. g, Quantification of percentage of stabilized receptors persisting at the plasma membrane during 60 s image acquisition, N = 180–205 eGFP molecules per group. Data are expressed as mean + SEM, with analysis performed as described (see Materials and Methods, Statistical analyses).
To further assess the interaction between β-III spectrin and mGluR1α we performed quantitative yeast two hybrid (Y2H) analysis using the last 118 C-terminal amino acids of mGluR1α and several β-III spectrin clones. We assessed whether C-terminal mGluR1α interacts with (1) the C terminus of β-III spectrin containing the membrane-binding pleckstrin homology domain, (2) the β-III spectrin region containing spectrin repeats 14–16 previously reported to bind to EAAT4 (Jackson et al., 2001), and (3) wild-type and mutant versions of β-III spectrin repeats 2–4 containing the American mutation (Ikeda et al., 2006; Fig. 4d). These experiments show that mGluR1α directly interacts with the C terminus of β-III spectrin. The strongest binding was found with spectrin repeats 14–16, and no interaction was detected between spectrin repeats 2–4 of β-III spectrin (Fig. 4e).
Because the American SCA5 mutation does not prevent binding of β-III spectrin to mGluR1α we tested the hypothesis that mutant β-III spectrin alters the stabilization of mGluR1α at the membrane, as previously shown for EAAT4. TIRF microscopy was performed in HEK293T cells transfected with clones expressing (1) mGluR1α-GFP alone, (2) mGluR1α-GFP and wt-β-III spectrin, or (3) mGluR1α-GFP and Δ39-β-III spectrin. Live cell imaging was used to quantify the number of mGluR1α-GFP molecules stabilized at the membrane in the presence of wild-type or mutant β-III spectrin compared with mGluR1α alone. The percentage of stable receptors was determined by analyzing the number of mGluR1α-GFP molecules persisting at the membrane during a 60 s image acquisition (Fig. 4f). TIRF analyses show that wild-type but not mutant β-III spectrin significantly increases the membrane stabilization of mGluR1α-GFP: mGluR1α-eGFP alone (28.2%), mGluR1α-eGFP + wt β-III spectrin (45.2%), and mGluR1α-eGFP + mut β-III spectrin (26.9%) (p = 0.007 for mGluR1α alone vs mGluR1α + wt-β-III spectrin and p = 0.81 for mGluR1α alone vs mGluR1α + Δ39-β-III spectrin; Fig. 4g). These data demonstrate that the integral membrane protein mGluR1α is stabilized by β-III spectrin in transfected cells and that the American SCA5 mutation disrupts this function.
Mutant β-III spectrin decreases mGluR1α localization at Purkinje cell dendritic spines
In an initial set of experiments to test if mGluR1α is affected in our SCA5 mutant mice we performed immunoblot and immunofluorescence experiments. Although immunoblot analysis shows that total cerebellar mGluR1α protein levels are not altered in SCA5 mice (Fig. 5a,b). Immunofluorescence studies show mGluR1α Purkinje cell spine localization differences (Fig. 5c). In agreement with previous studies (Das and Banker, 2006), mGluR1α colocalizes with the Purkinje cell marker calbindin and clusters at dendritic spines in control mice (Fig. 5c). In contrast, mGluR1α is more diffusely distributed in the SCA5 animals. We quantified this distribution difference by determining the degree to which mGluR1α is concentrated in clusters, using an approach similar to that developed by Das and Banker (2006). We found that average cluster size as well as the percentage area covered by clusters are significantly reduced in SCA5 mice compared with controls (Fig. 5e).
Figure 5.
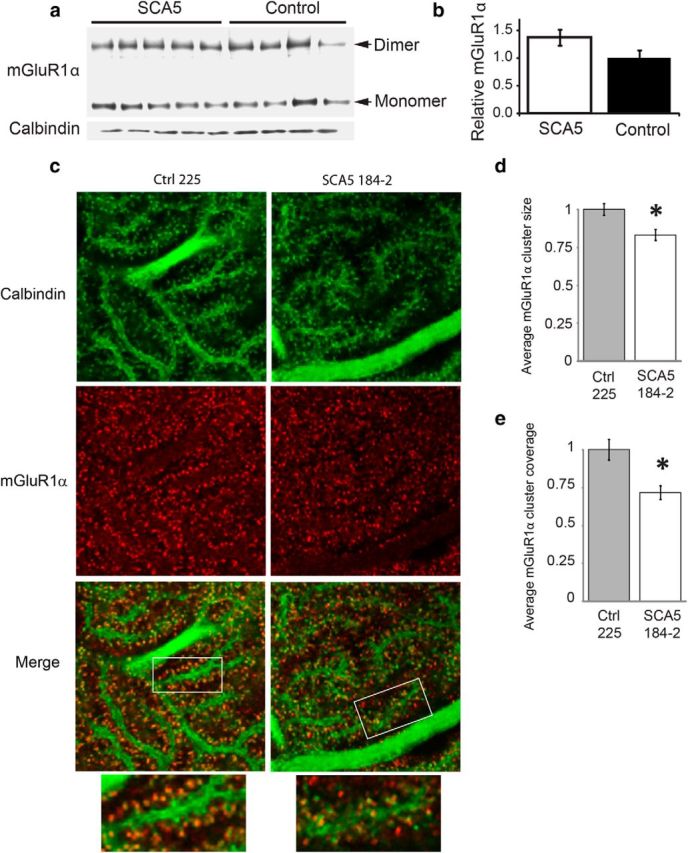
Loss of mGluR1α clustering in SCA5 mice. a, mGluR1α immunoblot analysis of cerebellar lysates from SCA5 line 184–2 (n = 5) and control line 225 (n = 4) mice at 9–11 months of age. b, Densitometric analysis shows no significant difference in the mGluR1α:calbindin ratio between genotypes (t test; p = 0.11). Data are expressed as mean ± SEM. c, Immunofluorescence staining of calbindin and mGluR1α at dendritic spines in 8- to 10-month-old SCA5 and control mice. Calbindin stains Purkinje dendrites and spines. Representative control and SCA5 images are shown. The control image shows that mGluR1α clusters at the dendritic spines, with a more diffuse mGluR1α staining pattern in the SCA5 image. Scale bars, 5 μm. d, We performed mGluR1α cluster analysis as previously described by Das and Bank (2006) and further detailed in the Materials and Methods section in SCA5 line 184–2 and control line 225 mice, n = 5 per genotype. The average size of mGluR1α clusters was significantly reduced in SCA5 mice compared with controls (t test; *p < 0.02). e, The average mGluR1α cluster coverage, defined as the percentage of the image area covered by clusters (Das and Banker, 2006), was significantly reduced in SCA5 mice compared with controls (t test; *p < 0.02). Data are normalized to control and expressed as mean values ± SEM.
Decreased mGluR1 function in mice expressing mutant β-III spectrin
To test if the changes in mGluR1α localization found in our SCA5 mice could cause changes in the function of the overall mGluR1 complex in vivo, we performed flavoprotein autofluorescence and calcium optical imaging (Reinert et al., 2004; Wang et al., 2011). We first determined the baseline response to high-frequency parallel fiber stimulation and subsequently evaluated the relative contributions of mGluR1 and AMPA receptors to the optical response using the mGluR1 antagonist, LY367385, and the AMPA antagonist, DNQX (Fig. 6a,b). mGluR1 and AMPA receptors are major contributors to the postsynaptic responses generated by both Purkinje cells and cerebellar interneurons (Konnerth et al., 1990; Finch and Augustine, 1998; Knöpfel and Grandes, 2002; Karakossian and Otis, 2004). In particular, activation of the mGluR1 receptors on Purkinje cells requires high-frequency stimulation of the presynaptic parallel fibers (Batchelor and Garthwaite, 1993; Karakossian and Otis, 2004), and this mGluR1 activation can be monitored using optical imaging (Wang et al., 2009). The example and population data show that application of the mGluR1 antagonist, LY367385 (200 μm), results in a significant reduction in the flavoprotein optical response in both the SCA5 (23.1 ± 4.8% reduction in the baseline response, F(2,6) = 10.3, p = 0.015) and control mice (35.3 ± 8.0% reduction in the baseline response, F(2,6) = 32.4, p = 0.0006; Fig. 6b). However, the magnitude of the reduction in the SCA5 mice was significantly smaller than in controls (F(1,6) = 8.5, p = 0.027), demonstrating that overexpression of mutant β-III spectrin causes a decrease in baseline mGluR1 activity (Fig. 6a,b). Application of the AMPA antagonist DNQX (50 μm) also results in a significant reduction in the responses to parallel fiber stimulation for SCA5 (58.8 ± 6.2% reduction in the baseline response, F(2,6) = 52.1, p = 0.0002) and control mice (60.3 ± 12.6% reduction in the baseline response, F(2,6) = 49.4, p = 0.0002; Fig. 6a,b). For both lines, the percentage reduction with DNQX relative to the baseline response was similar to previous reports (Wang et al., 2009, 2011) and did not differ between SCA5 and control mice (F(1,6) = 1.16, p = 0.32; Fig. 6b). These findings show that the SCA5 mutant mice have a substantial (35%) decrease in the mGluR1-mediated response to parallel fiber stimulation but little change (2.5%) in AMPA responsiveness compared withSCA5 control animals.
Figure 6.

Reduced activity of mGluR1 receptors in SCA5 mutant mice. a, Example flavoprotein images of the beam-like responses to parallel fiber stimulation in SCA5 645 and control line 225 before, during, and after adding the mGluR1 antagonist LY367385 (200 μm) and AMPA receptor antagonist DNQX (50 μm) to the bathing Ringer's solution. b, Amplitude of the flavoprotein response to parallel fiber stimulation relative to baseline in control and mutant mice (645) during application of LY367385 and DNQX. c, Example Ca2+ images of the beam-like response to parallel fiber stimulation in SCA5 line 645 and control line 225 before, during, and after adding mGluR1 antagonist LY367385 (200 μm) to the bathing Ringer's solution. The mGluR1 component images (third column) are the subtraction of the LY367385 image from the baseline image. d, e, Time courses of the responses shown in c. f, Peak amplitude of the mGluR1 component for the control (n = 4) and mutant SCA5 mice (n = 4). g, Peak amplitude of the Ca2+response during the application of LY367385 (200 μm), DNQX (100 μm), and APV (200 μm).
We used Ca2+ imaging to further test mGluR1 responsiveness, as mGluR1 activation drives intracellular Ca2+ release and can be used to assay mGluR1 activation (Finch and Augustine, 1998; Takechi et al., 1998). To isolate the mGluR1 component, the response to parallel fiber stimulation with and without LY367385 (200 μm) was imaged (Fig. 6c–f). The mGluR1-mediated component was obtained by subtracting the response in the presence of LY367385 from the baseline response. The time course of the mGluR1 response develops slowly and comprises ∼20% of the baseline response in control animals but <10% in SCA5 mutant mice (Fig. 6d,e). The peak of the mGluR1 component was significantly reduced in SCA5 mutant animals compared withSCA5 controls (F(1,6) = 62.3, p = 0.0002; Fig. 6f). In the same experiments the responses to parallel fiber stimulation were monitored after blocking mGluR1, AMPA, and NMDA receptors using LY367385 (200 μm), DNQX (100 μm), and APV (200 μm), respectively. This mixture effectively blocks the vast majority of the postsynaptic glutamate receptors activated by parallel fibers (Konnerth et al., 1990; Finch and Augustine, 1998; Knöpfel and Grandes, 2002; Karakossian and Otis, 2004). Therefore, the remaining response reflects the Ca2+ increase in the presynaptic parallel fibers (Sullivan et al., 2005). The amplitude of the parallel fiber component did not differ between mutant and control lines (F(1,6) = 0.31, p = 0.6; Fig. 6g). In summary, both Ca2+ and flavoprotein imaging show postsynaptic mGluR1, but neither parallel fiber nor AMPA responsiveness is substantially reduced in SCA5 mutant mice compared with SCA5 control animals.
Deficient mGluR1-mediated LTP in mice expressing mutant β-III spectrin
Next we used optical imaging to determine whether mGluR1-mediated synaptic plasticity is affected in the SCA5 mice. High-frequency burst parallel fiber stimulation elicits LTP at parallel fiber–Purkinje cell (PC) synapses (Wang et al., 2009). Induction of this postsynaptic form of LTP has been shown to require mGluR1s but does not require AMPA receptors or GABA receptor blockade. In vivo flavoprotein optical imaging (Reinert et al., 2007) was used to measure the LTP response evoked by high-frequency burst parallel fiber conditioning stimulation in SCA5 and control mice (Fig. 7). In control mice, the conditioning stimulation results in a long-term increase in the response during the 2 h period following induction (F(1,7) = 48.1, p = 0.0002). In contrast, LTP is absent in both age-matched SCA5 mouse lines (line 184–2: F(1,3) = 0.15, p = 0.72; line 645: F(1,8) = 0.91, p = 0.37; Fig. 7a,b).
Electrophysiological recordings confirmed the imaging results (Fig. 7c,d). Using field potentials to monitor the response to parallel fiber stimulation, the postsynaptic component (N2) is potentiated for the 2 h period following the conditioning stimulation in SCA5 control mice (F(1,3) = 63.5, p = 0.004; Fig. 7c). The simultaneously recorded flavoprotein response is also potentiated and mirrors the electrophysiological response (F(1,3) = 118.1, p = 0.0017; Fig. 7c). Conversely, in SCA5 mutant mice (645 line) there is no evidence for LTP by either the electrophysiological recordings (F(1,3) = 3.2, p = 0.17) or flavoprotein imaging (F(1,3) = 3.3, p = 0.17; Fig. 7a–d). The lack of LTP in the SCA5 lines resembles the response of wild-type mice treated with the mGluR1 antagonist LY367385 (Wang et al., 2009). The reduction in mGluR1 responsiveness in the SCA5 mice is likely to reflect, at least in part, the reduction in clustering and the diffuse distribution of mGluR1 receptors on the Purkinje cell dendrites and contribute to the loss of LTP.
Finally, we examined a recently described property of high-frequency parallel fiber stimulation, the long-latency patches of activity. These patches are completely mGluR1 dependent and exhibit a marked LTP by high-frequency parallel fiber stimulation that is also mGluR1 dependent (Wang et al., 2011). The amplitude of the long-latency patches is significantly reduced in SCA5 mice compared with control mice (F(1,11) = 7.8, p = 0.02; Fig. 8a,b). The control mice exhibit a marked LTP, averaging 199% above baseline (F(1,4) = 26.7, p = 0.01; Fig. 8a,c), which is similar to that observed in FVB mice (Wang et al., 2011). In contrast, the long-latency patches in SCA5 mice completely lack this LTP response. The amplitude of the patches in line 645 is not significantly different from baseline after the parallel fiber conditioning stimulation (F(1,3) = 5.9, p = 0.09), while the amplitude of the patches actually decreased in line 184–2 (F(1,3) = 27.8, p = 0.01; Fig. 8c). Therefore, several mGluR1-mediated responses to parallel fiber stimulation, including the beam, long-latency patches, and LTP of both, are dramatically decreased in the SCA5 mice.
Figure 8.

Reduced amplitude and LTP of long-latency patches in SCA5 mice. a, Example of the beam and long-latency patch responses before LTP induction in SCA5 line 645 and a control line 225 mice. The long-latency patches are shown for baseline and at 20, 65, and 95 min following LTP conditioning paradigm. b, Amplitude of the long-latency patches during the baseline for SCA5 lines 645 (n = 4) and 184–2 (n = 4) combined and control mice (n = 4). c, Averaged amplitude of the long-latency patches in relation to baseline before and after the conditioning stimulation for the control line 225 (n = 4), SCA5 line 645 (n = 4), and SCA5 line 184–2 (n = 4).
Discussion
We report the first transgenic mouse model for SCA5, a neurodegenerative disease caused by mutations in β-III spectrin. Expression of the human SPTBN2 gene containing a 39 bp in-frame SCA5 deletion mutation in Purkinje cells causes a progressive, late-onset ataxia not found in control animals. Similar to SCA5 patients, SCA5 mutant mice have deficits in motor coordination and degenerative histological changes in the cerebellum. Additionally, we show that β-III spectrin biochemically interacts with mGluR1α and that the distribution and function of mGluR1 receptors is altered in mice expressing mutant β-III spectrin. The unchanged presynaptic component of the response to parallel fiber stimulation and preserved postsynaptic AMPA receptor function in the SCA5 mice indicate that Purkinje cell deficits caused by mutant β-III spectrin are selective to specific postsynaptic receptors. Also, the mGluR1 component of the parallel fiber—Purkinje cell synapse is normal in an SCA1 mouse model (Barnes, 2011), providing further support that the mGluR1-mediated LTP deficits seen in our SCA5 mice are caused by disruptions of β-III spectrin function rather than nonspecific neurodegenerative changes. These data demonstrate a novel link between the cytoskeletal protein β-III spectrin and postsynaptic mGluR1 function in Purkinje cell dendrites, which is disrupted in SCA5 mice.
Previous studies show that mGluR1 deficiency causes cerebellar dysfunction, which suggests that the mGluR1 deficits caused by mutant β-III spectrin contribute to SCA5. For example, mice lacking mGluR1 develop ataxia (Aiba et al., 1994), and Purkinje cell expression of mGluR1α is required in the adult cerebellum for motor coordination (Nakao et al., 2007). Additionally, staggerer mice (sg/sg), which have a functional loss of the retinoid-related orphan receptor α (RORα) transcription factor, have mGluR1 deficits (Mitsumura et al., 2011). Postsynaptic mGluR1 has been shown to play a critical role in synaptic plasticity at the parallel fiber—Purkinje cell synapse in mice (Aiba et al., 1994; Ichise et al., 2000; Wang et al., 2009). Although a leading hypothesis has been that long-term depression (LTD) is required in cerebellar learning, recent studies have shown that cerebellar learning is unaffected when AMPA receptor internalization is blocked (Schonewille et al., 2011); therefore, we focused on mGluR1-mediated LTP. These studies, in combination with the deficits seen in our mice, suggest that mGluR1 dysfunction plays an important role in the etiology of SCA5.
The mGluR1 deficits found in our SCA5 mice connect SCA5 to other neurological diseases involving glutamatergic abnormalities (Benarroch, 2008, 2010; Bowie, 2008). For example, metabotropic glutamate receptor signaling deficits are found in Fmr1 knock-out mice, a model of Fragile X syndrome. These animals have augmented mGluR1 signaling (Huber et al., 2002), which increases hippocampal LTD. A transgenic mouse model of Huntington disease has decreased mGluR1, mGluR2, and mGluR3 levels (Cha et al., 1998). Additionally, a retrotransposon mutation in GRM1, which results in truncation of mGluR1, causes neonatal cerebellar ataxia in Coton de Tulear dogs (Zeng et al., 2011). In addition a recent study in a mouse model for SCA3 showed that expression of mutant ataxin-3 disrupts mGluR1 (Konno et al., 2014). These studies, in combination with current data showing that spectrin mutations cause mGluR1 deficits in SCA5, suggest that mGluR1 dysfunction is a common feature in a number of different neurodegenerative diseases.
Work in a variety of model systems supports a scaffolding role for β-spectrins in anchoring integral membrane proteins at specific domains: (1) the Na,K ATPase does not properly accumulate at the basolateral plasma membrane of epithelial cells in Drosophila lacking β spectrin (Dubreuil et al., 2000), (2) β-II spectrin is required for E-cadherin localization at the lateral plasma membrane in human bronchial epithelial cells (Kizhatil et al., 2007), (3) voltage-gated sodium channel clustering at the nodes of Ranvier and axon initial segments is deficient in β-IV spectrin–null mice (Komada and Soriano, 2002), and (4) wild-type but not mutant β-III spectrin reduces lateral movement of EAAT4 in HEK293 cells (Ikeda et al., 2006). Our results show that mutant β-III spectrin expression leads to mGluR1α-mislocalization and mGluR1 dysfunction at Purkinje cell dendritic spines. TIRF microscopy studies show mutant β-III spectrin fails to stabilize mGluR1-GFP at the membrane in transfected cells and suggest that deficits in membrane anchoring underlie the mGluR1 dysfunction seen in our mice. Alternatively, mGluR1α mislocalization may be caused by effects of mutant spectrin on mGluR1α transport: β-III spectrin binds dynactin (Holleran et al., 2001), spectrin is required for microtubule-based dynein transport (Muresan et al., 2001; De Vos et al., 2003), and expression of mutant spectrin with the American SCA5 mutation affects intracellular transport in Drosophila (Lorenzo et al., 2010). Future studies are needed to address whether the altered localization of mGluR1α in vivo is caused primarily by deficient spectrin anchoring, failure of the mutant β-III spectrin to transport mGluR1α to the membrane, or both.
The American mutation, which is located in the third spectrin repeat, disrupts the anchoring function of the protein but does not prevent the interaction of β-III spectrin with mGluR1α. The failure of mutant protein to anchor mGluR1α at the membrane may result from misfolding of mutant β-III spectrin or failure of the mutant protein to interact with other binding partners required for this process. Similarly, the American β-III spectrin mutation disrupts the anchoring (Ikeda et al., 2006) but not the biochemical interaction of β-III spectrin with EAAT4 (K. Armbrust, unpublished data). The lack of an ataxia phenotype in the EAAT4 knock-out mice suggests EAAT4 destabilization is unlikely to play a major role in SCA5. While we provide substantial evidence that mutant β-III spectrin causes mGluR1α deficits in SCA5, it is possible that mutant β-III spectrin may also affect the stabilization, localization, or trafficking of additional proteins that may contribute to the disease.
Two groups have reported β-III spectrin knock-out mice (Perkins et al., 2010; Stankewich et al., 2010), which are characterized by ataxia, seizures, and a variety of histologic and functional changes in cerebellar Purkinje cells. While these models provide insight on the effects of complete loss of β-III spectrin, these animals do not necessarily model SCA5, which is a dominant disease caused by expression of mutant β-III spectrin (Ikeda et al., 2006). One notable difference in these models is that EAAT4 levels are dramatically decreased in the β-III spectrin knock-out mice (Perkins et al., 2010; Stankewich et al., 2010), a change not found in human SCA5 autopsy tissue (Ikeda et al., 2006) nor in our SCA5 mice.
In summary, our mice provide the first mammalian model of SCA5 and demonstrate a novel link between β-III spectrin and mGluR1 function. These mice will allow further characterization of the molecular effects of mutant β-III spectrin on Purkinje cell function and disease pathogenesis. Comparison with β-III spectrin knock-out mice will be important for understanding the extent to which mutant β-III spectrin causes dominant gain-of-function versus dominant-negative effects. Importantly, these mice provide a novel in vivo model that can be used to test therapeutic strategies for SCA5.
Footnotes
The Center for Magnetic Resonance Research is supported by National Center for Research Resources (P41 RR008079), National Institute of Biomedical Imaging and Bioengineering (P41 EB015894), Institutional Center Cores for Advanced Neuroimaging award P30 NS076408, and the WM Keck Foundation. This work was supported by the National Ataxia Foundation, the Institute for Translational Neuroscience (UMN), and the National Institutes of Health (RO1 NS056158 and RO1 NS048944). We thank Y. Gao, J. Cleary, H. Khoshbouei, J. Swant, J. Rothstein, and M. Jackson for helpful discussions; L. Eberly, L. Zhuo, M. Vollmers, E. Colonna, and the Center for Magnetic Resonance Research (University of Minnesota; UMN) for assistance with MR scanning; and Guillermo Marques and the Imaging Core (UMN) for assistance with TIRF microscopy.
The authors declare no competing financial interests.
References
- Aiba A, Kano M, Chen C, Stanton ME, Fox GD, Herrup K, Zwingman TA, Tonegawa S. Deficient cerebellar long-term depression and impaired motor learning in mGluR1 mutant mice. Cell. 1994;79:377–388. doi: 10.1016/0092-8674(94)90205-4. [DOI] [PubMed] [Google Scholar]
- Barnes JA. University of Minnesota; 2011. A functional examination of the afferent cerebellar cortical circuitry of ATXN1 mice in vivo. PhD thesis. [Google Scholar]
- Batchelor AM, Garthwaite J. Novel synaptic potentials in cerebellar Purkinje cells: probable mediation by metabotropic glutamate receptors. Neuropharmacology. 1993;32:11–20. doi: 10.1016/0028-3908(93)90124-L. [DOI] [PubMed] [Google Scholar]
- Baude A, Nusser Z, Roberts JD, Mulvihill E, Mcllhinney RA, Somogyi P. The metabotropic glutamate receptor (mGluRl[alpha]) is concentrated at perisynaptic membrane of neuronal subpopulations as detected by immunogold reaction. Neuron. 1993;11:771–787. doi: 10.1016/0896-6273(93)90086-7. [DOI] [PubMed] [Google Scholar]
- Benarroch EE. Metabotropic glutamate receptors: synaptic modulators and therapeutic targets for neurologic disease. Neurology. 2008;70:964–968. doi: 10.1212/01.wnl.0000306315.03021.2a. [DOI] [PubMed] [Google Scholar]
- Benarroch EE. Glutamate transporters: diversity, function, and involvement in neurologic disease. Neurology. 2010;74:259–264. doi: 10.1212/WNL.0b013e3181cc89e3. [DOI] [PubMed] [Google Scholar]
- Bennett V, Healy J. Organizing the fluid membrane bilayer: diseases linked to spectrin and ankyrin. Trends Mol Med. 2008;14:28–36. doi: 10.1016/j.molmed.2007.11.005. [DOI] [PubMed] [Google Scholar]
- Bowie D. Ionotropic glutamate receptors and CNS disorders. CNS Neurol Disord Drug Targets. 2008;7:129–143. doi: 10.2174/187152708784083821. [DOI] [PMC free article] [PubMed] [Google Scholar]
- Bürk K, Zühlke C, König IR, Ziegler A, Schwinger E, Globas C, Dichgans J, Hellenbroich Y. Spinocerebellar ataxia type 5: clinical and molecular genetic features of a German kindred. Neurology. 2004;62:327–329. doi: 10.1212/01.WNL.0000103293.63340.C1. [DOI] [PubMed] [Google Scholar]
- Cha JH, Kosinski CM, Kerner JA, Alsdorf SA, Mangiarini L, Davies SW, Penney JB, Bates GP, Young AB. Altered brain neurotransmitter receptors in transgenic mice expressing a portion of an abnormal human Huntington disease gene. Proc Natl Acad Sci U S A. 1998;95:6480–6485. doi: 10.1073/pnas.95.11.6480. [DOI] [PMC free article] [PubMed] [Google Scholar]
- Cho E, Fogel BL. A family with spinocerebellar ataxia type 5 found to have a novel missense mutation within a SPTBN2 spectrin repeat. Cerebellum. 2013;12:162–164. doi: 10.1007/s12311-012-0408-0. [DOI] [PMC free article] [PubMed] [Google Scholar]
- Clark HB, Burright EN, Yunis WS, Larson S, Wilcox C, Hartman B, Matilla A, Zoghbi HY, Orr HT. Purkinje cell expression of a mutant allele of SCA1 in transgenic mice leads to disparate effects on motor behaviors, followed by a progressive cerebellar dysfunction and histological alterations. J Neurosci. 1997;17:7385–7395. doi: 10.1523/JNEUROSCI.17-19-07385.1997. [DOI] [PMC free article] [PubMed] [Google Scholar]
- Conquet F, Bashir ZI, Davies CH, Daniel H, Ferraguti F, Bordi F, Franz-Bacon K, Reggiani A, Matarese V, Condé F, et al. Motor deficit and impairment of synaptic plasticity in mice lacking mGluR1. Nature. 1994;372:237–243. doi: 10.1038/372237a0. [DOI] [PubMed] [Google Scholar]
- Das SS, Banker GA. The role of protein interaction motifs in regulating the polarity and clustering of the metabotropic glutamate receptor mGluR1a. J Neurosci. 2006;26:8115–8125. doi: 10.1523/JNEUROSCI.1015-06.2006. [DOI] [PMC free article] [PubMed] [Google Scholar]
- Dehnes Y, Chaudhry FA, Ullensvang K, Lehre KP, Storm-Mathisen J, Danbolt NC. The glutamate transporter EAAT4 in rat cerebellar Purkinje cells: a glutamate-gated chloride channel concentrated near the synapse in parts of the dendritic membrane facing astroglia. J Neurosci. 1998;18:3606–3619. doi: 10.1523/JNEUROSCI.18-10-03606.1998. [DOI] [PMC free article] [PubMed] [Google Scholar]
- De Vos KJ, Sable J, Miller KE, Sheetz MP. Expression of phosphatidylinositol (4,5) bisphosphate-specific pleckstrin homology domains alters direction but not the level of axonal transport of mitochondria. Mol Biol Cell. 2003;14:3636–3649. doi: 10.1091/mbc.E02-10-0638. [DOI] [PMC free article] [PubMed] [Google Scholar]
- Dick KA, Ikeda Y, Day JW, Ranum LP. Spinocerebellar ataxia type 5. Handb Clin Neurol. 2012;103:451–459. doi: 10.1016/B978-0-444-51892-7.00028-0. [DOI] [PubMed] [Google Scholar]
- Dubreuil RR, Wang P, Dahl S, Lee J, Goldstein LS. Drosophila [beta] spectrin functions independently of [alpha] spectrin to polarize the Na, K ATPase in epithelial cells. J Cell Biol. 2000;149:647–656. doi: 10.1083/jcb.149.3.647. [DOI] [PMC free article] [PubMed] [Google Scholar]
- Eccles JC, Sasaki K, Strata P. Interpretation of the potential fields generated in the cerebellar cortex by a mossy fibre volley. Exp Brain Res. 1967;3:58–80. doi: 10.1007/BF00234470. [DOI] [PubMed] [Google Scholar]
- Elsayed SM, Heller R, Thoenes M, Zaki MS, Swan D, Elsobky E, Zühlke C, Ebermann I, Nürnberg G, Nürnberg P, Bolz HJ. Autosomal dominant SCA5 and autosomal recessive infantile SCA are allelic conditions resulting from SPTBN2 mutations. Eur J Hum Genet. 2014;22:286–288. doi: 10.1038/ejhg.2013.150. [DOI] [PMC free article] [PubMed] [Google Scholar]
- Finch EA, Augustine GJ. Local calcium signalling by inositol-1,4,5-trisphosphate in Purkinje cell dendrites. Nature. 1998;396:753–756. doi: 10.1038/25541. [DOI] [PubMed] [Google Scholar]
- Garwood M, DelaBarre L. The return of the frequency sweep: designing adiabatic pulses for contemporary NMR. J Magn Reson. 2001;153:155–177. doi: 10.1006/jmre.2001.2340. [DOI] [PubMed] [Google Scholar]
- Gruetter R, Tkác I. Field mapping without reference scan using asymmetric echo-planar techniques. Magn Reson Med. 2000;43:319–323. doi: 10.1002/(SICI)1522-2594(200002)43:2<319::AID-MRM22>3.3.CO%3B2-T. [DOI] [PubMed] [Google Scholar]
- Hannigan JH, Berman RF, Zajac CS. Environmental enrichment and the behavioral effects of prenatal exposure to alcohol in rats. Neurotoxicol Teratol. 1993;15:261–266. doi: 10.1016/0892-0362(93)90007-B. [DOI] [PubMed] [Google Scholar]
- Holleran EA, Ligon LA, Tokito M, Stankewich MC, Morrow JS, Holzbaur EL. beta III spectrin binds to the Arp1 subunit of dynactin. J Biol Chem. 2001;276:36598–36605. doi: 10.1074/jbc.M104838200. [DOI] [PubMed] [Google Scholar]
- Huber KM, Gallagher SM, Warren ST, Bear MF. Altered synaptic plasticity in a mouse model of fragile X mental retardation. Proc Natl Acad Sci U S A. 2002;99:7746–7750. doi: 10.1073/pnas.122205699. [DOI] [PMC free article] [PubMed] [Google Scholar]
- Ichise T, Kano M, Hashimoto K, Yanagihara D, Nakao K, Shigemoto R, Katsuki M, Aiba A. mGluR1 in cerebellar Purkinje cells essential for long-term depression, synapse elimination, and motor coordination. Science. 2000;288:1832–1835. doi: 10.1126/science.288.5472.1832. [DOI] [PubMed] [Google Scholar]
- Ikeda Y, Dick KA, Weatherspoon MR, Gincel D, Armbrust KR, Dalton JC, Stevanin G, Dürr A, Zühlke C, Bürk K, Clark HB, Brice A, Rothstein JD, Schut LJ, Day JW, Ranum LP. Spectrin mutations cause spinocerebellar ataxia type 5. Nat Genet. 2006;38:184–190. doi: 10.1038/ng1728. [DOI] [PubMed] [Google Scholar]
- Jackson M, Song W, Liu MY, Jin L, Dykes-Hoberg M, Lin CI, Bowers WJ, Federoff HJ, Sternweis PC, Rothstein JD. Modulation of the neuronal glutamate transporter EAAT4 by two interacting proteins. Nature. 2001;410:89–93. doi: 10.1038/35065091. [DOI] [PubMed] [Google Scholar]
- Jacob FD, Ho ES, Martinez-Ojeda M, Darras BT, Khwaja OS. Case of infantile onset spinocerebellar ataxia type 5. J Child Neurol. 2013;28:1292–1295. doi: 10.1177/0883073812454331. [DOI] [PubMed] [Google Scholar]
- Karakossian MH, Otis TS. Excitation of cerebellar interneurons by group I metabotropic glutamate receptors. J Neurophysiol. 2004;92:1558–1565. doi: 10.1152/jn.00300.2004. [DOI] [PMC free article] [PubMed] [Google Scholar]
- Kizhatil K, Yoon W, Mohler PJ, Davis LH, Hoffman JA, Bennett V. Ankyrin-G and beta2-spectrin collaborate in biogenesis of lateral membrane of human bronchial epithelial cells. J Biol Chem. 2007;282:2029–2037. doi: 10.1074/jbc.M608921200. [DOI] [PubMed] [Google Scholar]
- Knöpfel T, Grandes P. Metabotropic glutamate receptors in the cerebellum with a focus on their function in Purkinje cells. Cerebellum. 2002;1:19–26. doi: 10.1007/BF02941886. [DOI] [PubMed] [Google Scholar]
- Komada M, Soriano P. B-IV-spectrin regulates sodium channel clustering through ankyrin-G at axon initial segments and nodes of Ranvier. J Cell Biol. 2002;156:337–348. doi: 10.1083/jcb.200110003. [DOI] [PMC free article] [PubMed] [Google Scholar]
- Konnerth A, Llano I, Armstrong CM. Synaptic currents in cerebellar Purkinje cells. Proc Natl Acad Sci U S A. 1990;87:2662–2665. doi: 10.1073/pnas.87.7.2662. [DOI] [PMC free article] [PubMed] [Google Scholar]
- Konno A, Shuvaev AN, Miyake N, Miyake K, Iizuka A, Matsuura S, Huda F, Nakamura K, Yanagi S, Shimada T, Hirai H. Mutant ataxin-3 with an abnormally expanded polyglutamine chain disrupts dendritic development and metabotropic glutamate receptor signaling in mouse cerebellar Purkinje cells. Cerebellum. 2014;13:29–41. doi: 10.1007/s12311-013-0516-5. [DOI] [PubMed] [Google Scholar]
- Lise S, Clarkson Y, Perkins E, Kwasniewska A, Sadighi Akha E, Schnekenberg RP, Suminaite D, Hope J, Baker I, Gregory L, Green A, Allan C, Lamble S, Jayawant S, Quaghebeur G, Cader MZ, Hughes S, Armstrong RJ, Kanapin A, Rimmer A, et al. Recessive mutations in SPTBN2 implicate β-III spectrin in both cognitive and motor development. PLoS Genet. 2012;8:e1003074. doi: 10.1371/journal.pgen.1003074. [DOI] [PMC free article] [PubMed] [Google Scholar]
- Lorenzo DN, Li MG, Mische SE, Armbrust KR, Ranum LP, Hays TS. Spectrin mutations that cause spinocerebellar ataxia type 5 impair axonal transport and induce neurodegeneration in Drosophila. J Cell Biol. 2010;189:143–158. doi: 10.1083/jcb.200905158. [DOI] [PMC free article] [PubMed] [Google Scholar]
- Maragakis NJ, Rothstein JD. Glutamate transporters: animal models to neurologic disease. Neurobiol Dis. 2004;15:461–473. doi: 10.1016/j.nbd.2003.12.007. [DOI] [PubMed] [Google Scholar]
- Mitsumura K, Hosoi N, Furuya N, Hirai H. Disruption of metabotropic glutamate receptor signalling is a major defect at cerebellar parallel fibre-Purkinje cell synapses in staggerer mutant mice. J Physiol. 2011;589:3191–3209. doi: 10.1113/jphysiol.2011.207563. [DOI] [PMC free article] [PubMed] [Google Scholar]
- Muresan V, Stankewich MC, Steffen W, Morrow JS, Holzbaur EL, Schnapp BJ. Dynactin-dependent, dynein-driven vesicle transport in the absence of membrane proteins: a role for spectrin and acidic phospholipids. Mol Cell. 2001;7:173–183. doi: 10.1016/S1097-2765(01)00165-4. [DOI] [PubMed] [Google Scholar]
- Nakao H, Nakao K, Kano M, Aiba A. Metabotropic glutamate receptor subtype-1 is essential for motor coordination in the adult cerebellum. Neurosci Res. 2007;57:538–543. doi: 10.1016/j.neures.2006.12.014. [DOI] [PubMed] [Google Scholar]
- Ohara O, Ohara R, Yamakawa H, Nakajima D, Nakayama M. Characterization of a new [beta]-spectrin gene which is predominantly expressed in brain. Brain Res Mol Brain Res. 1998;57:181–192. doi: 10.1016/S0169-328X(98)00068-0. [DOI] [PubMed] [Google Scholar]
- Oz G, Hutter D, Tkác I, Clark HB, Gross MD, Jiang H, Eberly LE, Bushara KO, Gomez CM. Neurochemical alterations in spinocerebellar ataxia type 1 and their correlations with clinical status. Mov Disord. 2010a;25:1253–1261. doi: 10.1002/mds.23067. [DOI] [PMC free article] [PubMed] [Google Scholar]
- Oz G, Nelson CD, Koski DM, Henry PG, Marjanska M, Deelchand DK, Shanley R, Eberly LE, Orr HT, Clark HB. Noninvasive detection of presymptomatic and progressive neurodegeneration in a mouse model of spinocerebellar ataxia type 1. J Neurosci. 2010b;30:3831–3838. doi: 10.1523/JNEUROSCI.5612-09.2010. [DOI] [PMC free article] [PubMed] [Google Scholar]
- Perkins EM, Clarkson YL, Sabatier N, Longhurst DM, Millward CP, Jack J, Toraiwa J, Watanabe M, Rothstein JD, Lyndon AR, Wyllie DJ, Dutia MB, Jackson M. Loss of beta-III spectrin leads to Purkinje cell dysfunction recapitulating the behavior and neuropathology of spinocerebellar ataxia type 5 in humans. J Neurosci. 2010;30:4857–4867. doi: 10.1523/JNEUROSCI.6065-09.2010. [DOI] [PMC free article] [PubMed] [Google Scholar]
- Provencher SW. Estimation of metabolite concentrations from localized in vivo proton NMR spectra. Magn Reson Med. 1993;30:672–679. doi: 10.1002/mrm.1910300604. [DOI] [PubMed] [Google Scholar]
- Ranum LP, Schut LJ, Lundgren JK, Orr HT, Livingston DM. Spinocerebellar ataxia type 5 in a family descended from the grandparents of President Lincoln maps to chromosome 11. Nat Genet. 1994;8:280–284. doi: 10.1038/ng1194-280. [DOI] [PubMed] [Google Scholar]
- Reinert KC, Dunbar RL, Gao W, Chen G, Ebner TJ. Flavoprotein autofluorescence imaging of neuronal activation in the cerebellar cortex in vivo. J Neurophysiol. 2004;92:199–211. doi: 10.1152/jn.01275.2003. [DOI] [PubMed] [Google Scholar]
- Reinert KC, Gao W, Chen G, Ebner TJ. Flavoprotein autofluorescence imaging in the cerebellar cortex in vivo. J Neurosci Res. 2007;85:3221–3232. doi: 10.1002/jnr.21348. [DOI] [PubMed] [Google Scholar]
- Schonewille M, Gao Z, Boele HJ, Veloz MF, Amerika WE, Simek AA, De Jeu MT, Steinberg JP, Takamiya K, Hoebeek FE, Linden DJ, Huganir RL, De Zeeuw CI. Reevaluating the role of LTD in cerebellar motor learning. Neuron. 2011;70:43–50. doi: 10.1016/j.neuron.2011.02.044. [DOI] [PMC free article] [PubMed] [Google Scholar]
- Stankewich MC, Gwynn B, Ardito T, Ji L, Kim J, Robledo RF, Lux SE, Peters LL, Morrow JS. Targeted deletion of betaIII spectrin impairs synaptogenesis and generates ataxic and seizure phenotypes. Proc Natl Acad Sci U S A. 2010;107:6022–6027. doi: 10.1073/pnas.1001522107. [DOI] [PMC free article] [PubMed] [Google Scholar]
- Stevanin G, Herman A, Brice A, Dürr A. Clinical and MRI findings in spinocerebellar ataxia type 5. Neurology. 1999;53:1355–1357. doi: 10.1212/WNL.53.6.1355. [DOI] [PubMed] [Google Scholar]
- Sullivan MR, Nimmerjahn A, Sarkisov DV, Helmchen F, Wang SS. In vivo calcium imaging of circuit activity in cerebellar cortex. J Neurophysiol. 2005;94:1636–1644. doi: 10.1152/jn.01013.2004. [DOI] [PubMed] [Google Scholar]
- Takechi H, Eilers J, Konnerth A. A new class of synaptic response involving calcium release in dendritic spines. Nature. 1998;396:757–760. doi: 10.1038/25547. [DOI] [PubMed] [Google Scholar]
- Wang X, Chen G, Gao W, Ebner T. Long-term potentiation of the responses to parallel fiber stimulation in mouse cerebellar cortex in vivo. Neuroscience. 2009;162:713–722. doi: 10.1016/j.neuroscience.2009.01.071. [DOI] [PMC free article] [PubMed] [Google Scholar]
- Wang X, Chen G, Gao W, Ebner TJ. Parasagittally aligned, mGluR1-dependent patches are evoked at long latencies by parallel fiber stimulation in the mouse cerebellar cortex in vivo. J Neurophysiol. 2011;105:1732–1746. doi: 10.1152/jn.00717.2010. [DOI] [PMC free article] [PubMed] [Google Scholar]
- Zeng R, Farias FH, Johnson GS, McKay SD, Schnabel RD, Decker JE, Taylor JF, Mann CS, Katz ML, Johnson GC, Coates JR, O'Brien DP. A truncated retrotransposon disrupts the GRM1 coding sequence in Coton de Tulear dogs with Bandera's neonatal ataxia. J Vet Intern Med. 2011;25:267–272. doi: 10.1111/j.1939-1676.2010.0666.x. [DOI] [PubMed] [Google Scholar]
- Zu T, Duvick LA, Kaytor MD, Berlinger MS, Zoghbi HY, Clark HB, Orr HT. Recovery from polyglutamine-induced neurodegeneration in conditional SCA1 transgenic mice. J Neurosci. 2004;24:8853–8861. doi: 10.1523/JNEUROSCI.2978-04.2004. [DOI] [PMC free article] [PubMed] [Google Scholar]