

Abstract
Seizures are classically characterized as the expression of hypersynchronous neural activity, yet the true degree of synchrony in neuronal spiking (action potentials) during human seizures remains a fundamental question. We quantified the temporal precision of spike synchrony in ensembles of neocortical neurons during seizures in people with pharmacologically intractable epilepsy. Two seizure types were analyzed: those characterized by sustained gamma (∼40–60 Hz) local field potential (LFP) oscillations or by spike-wave complexes (SWCs; ∼3 Hz). Fine (<10 ms) temporal synchrony was rarely present during gamma-band seizures, where neuronal spiking remained highly irregular and asynchronous. In SWC seizures, phase locking of neuronal spiking to the SWC spike phase induced synchrony at a coarse 50–100 ms level. In addition, transient fine synchrony occurred primarily during the initial ∼20 ms period of the SWC spike phase and varied across subjects and seizures. Sporadic coherence events between neuronal population spike counts and LFPs were observed during SWC seizures in high (∼80 Hz) gamma-band and during high-frequency oscillations (∼130 Hz). Maximum entropy models of the joint neuronal spiking probability, constrained only on single neurons' nonstationary coarse spiking rates and local network activation, explained most of the fine synchrony in both seizure types. Our findings indicate that fine neuronal ensemble synchrony occurs mostly during SWC, not gamma-band, seizures, and primarily during the initial phase of SWC spikes. Furthermore, these fine synchrony events result mostly from transient increases in overall neuronal network spiking rates, rather than changes in precise spiking correlations between specific pairs of neurons.
Keywords: collective dynamics, conditional inference, epilepsy, maximum entropy
Introduction
Epileptic seizures are classically characterized as the hypersynchronous activation of large neuronal populations (Fisher et al., 2005). Recent studies, however, indicate that the issue of neural synchrony during seizures is more complex than previously thought (Netoff and Schiff, 2002; Mormann et al., 2003; Cymerblit-Sabba and Schiller, 2010; Kramer et al., 2010; Bower et al., 2012; Jiruska et al., 2013). Furthermore, the temporal precision of synchrony at the level of single-neuron spiking (action potentials) has not been examined during human seizures, and is a critical issue for understanding the nature and mechanisms of epileptic seizures. Fine temporal (<10 ms) spike synchrony in a group of neurons might substantially affect their efficacy in driving downstream targets (Abeles, 1991; Kumar et al., 2010). In addition, temporal synchrony resulting from the entrainment of neuronal spiking into oscillatory activity can lead to the formation of dynamic large scale networks (Singer, 2011). Fine temporal synchrony can also induce changes in synaptic efficacy (effective network connectivity) via neuronal spike timing-dependent plasticity (Dan and Poo, 2006). Challenges in single-neuron ensemble recordings during human seizures and in the statistical assessment of synchrony have posed difficult obstacles to determining the degree of neuronal spike synchrony and its role in seizures. Statistical challenges arise primarily from the fact that apparent fine temporal correlations between neuronal spike trains, as defined, for example, in 1 ms time bins, can result from covariations in much slower or coarser timescales (Brody, 1998, 1999), especially in neural events characterized by multiple timescales, as is typical of epileptic seizures.
Here, we studied four patients with pharmacologically intractable focal epilepsy who were undergoing clinically indicated invasive intracranial monitoring before resective surgery. Single-neuron spikes and LFPs were recorded via a (4 × 4 mm) 96 microelectrode array implanted in the temporal cortex. To properly separate the effects of neural dynamics' multiple scales and assess the temporal precision of synchrony in neuronal spike trains, we adopted a recent approach based on conditional inference (Amarasingham et al., 2012). We assessed temporal precision in seizures characterized either by sustained (∼40–60 Hz) gamma-band oscillations or by (2–3 Hz) spike-wave complexes (SWCs). Fine synchrony was mostly absent in gamma-band seizures, with neuronal spiking remaining highly irregular and asynchronous throughout the seizure. A few sporadic gamma-band coherence events between neuronal population spike counts and LFPs were observed. Fine synchrony in SWC seizures occurred in episodic transients and varied across patients and seizures. A new maximum entropy log-linear model of the joint neuronal spiking probability, constrained on slow covariations in neuronal spiking rates and local network activation, accounted for most of the detected episodic fine synchrony during seizures. This suggested that these episodic events resulted primarily from sharp transient increases in neuronal spiking rates, especially during the initial phase of the SWC spike, rather than changes in precise spiking between specific pairs of neurons.
Materials and Methods
Patients and clinical and research microelectrode array recordings.
Four patients with pharmacologically intractable focal epilepsy were consented to participate in this research. Approval for these studies was granted by local Institutional Review Boards at Massachusetts General Hospital/ Brigham and Women's Hospitals (Partners Human Research Committee) and at Rhode Island Hospital. All recordings were conducted during a period of 5–14 d. Patients underwent neuromonitoring for seizure localization and functional assessment of neocortical areas via standard clinical recordings based on subdural electrocorticograms (ECoGs), strip electrodes, and depth electrodes placed in subcortical structures. We emphasize that the decision to implant subdural grids and strip electrodes was made by a clinical team completely independent from this research. Patients were approached by the research team only after the clinical team's decision was made. In addition to the clinical recordings, the four patients (P1–P4) were implanted with a research 10 × 10 NeuroPort microelectrode array (Blackrock Microsystems), consisting of 96 recording platinum-tipped silicon probes covering a 4 mm × 4 mm area. The 1.00 mm (P1, P4) or 1.50 mm (P2, P3) long microelectrode arrays were implanted in a neocortical area expected to be resected. We note that this expectation reflected the high likelihood, in these particular patients, of the surgery to require the resection of areas in the temporal lobe. However, the extent of temporal lobe areas and other mesial structures (hippocampus, amygdala, etc.) to be resected, as well as the extent of eloquent cortical areas that had to be spared, required the neuromonitoring procedure conducted by the clinical team. Implanted cortical areas corresponded in this study to middle (P1, P2, and P4) or superior (P3) temporal gyrus. Histology after resection confirmed that the tips of the electrodes were in layer III. Here, we examined 10 clinical seizures, including 3 seizures each from P1 and P2, and 2 seizures each from P3 and P4. Seizure events were determined by experienced encephalographers (S.S.C. and A.S.B.) via inspection of ECoGs and clinical manifestations recorded in video. Seizure-onset times were determined according to the manifestation of ictal activity in LFPs recorded by the implanted microelectrode array. The distance to the nearest ECoG electrode where seizure onsets were detected was ∼2 cm (P1, P4) and ∼3 cm (P2 and P3). These recordings were therefore outside of the seizure-onset zone. Details of the clinical cases, microelectrode array locations, and seizures are given below.
Patient P1 (mesial temporal sclerosis).
Patient P1 was a 52-year-old, right-handed woman at the time of surgery that began having seizures at the age of 4. At the time of electrode implantation she was having an average of 10–15 complex partial seizures per day, some of which would secondarily generalize. Her seizures usually started with a sudden speech arrest and were accompanied by confusion and repetition of the activity she was doing just before the onset of the seizure. MRI showed a large lesion in the left hemisphere extending from the occipital region to the temporal region, which was consistent with encephalomalacia. A positron-emission tomography scan showed hypometabolism in the left occipital, temporal, and parietal regions. The patient was implanted with subdural grid and strip electrodes over the left hemisphere, along with depth electrodes into left mesial structures. The NeuroPort array was placed in the middle temporal gyrus. All of the recorded seizures lasted approximately a minute or less and showed a similar electrographic pattern on ECoG—beginning with low-amplitude (300 μV) gamma-band activity (40–60 Hz) in the anterior temporal strip. Occasionally, this was accompanied by an associated burst of polyspike activity in an occipital strip or began at an occipital site. Sometimes, rhythmic ECoG spikes occurred in the anterior temporal strip and posterior temporal depths. At the conclusion of the study the patient underwent resection of the left anterior temporal lobe. Histology revealed hippocampal sclerosis with secondary cortical gliosis and normal cortical layering (no evidence of dysplasia) with focal gliosis in superficial layers in the microelectrode implant site. The patient remained seizure free for 1 year after the resection, but seizures returned after this period.
Patient P2 (cortical dysplasia).
Patient P2 was a 25-year-old, left-handed woman at the time of her 7 d phase II video-EEG study. Her seizures involved complex partial events, which began at age 14, and included an aura of nausea and/or a “tunneling” sensation, then a flattening of affect, slowed responsiveness, automatisms, and associated amnesia. These occurred three to four times per month and were persistent despite a three-drug anticonvulsant regimen. MRI revealed an extensive nodular gray matter heterotopia (cortical dysplasia) in the right hemisphere. Phase I LTM had found right hemispheric onset seizures and fMRI had shown normal left-sided language activation patterns and normal motor activation patterns. Wada testing confirmed left hemispheric language dominance and suggested her left hemisphere could adequately support memory function subsequent to a right temporal lobectomy. Based on these data, she was implanted with a combination of subdural grid and strip electrodes over the right hemisphere and three depth electrodes into the right temporal lobe. The NeuroPort array was placed in the right middle temporal gyrus. Three clinical seizures were recorded lasting between ∼1 and 2.5 min each. These showed very consistent patterns of seizure onset and propagation on ECoG; all began in the right middle and upper gyri of the posterior temporal cortex. Low amplitude and fast activity were recorded from these grid sites at the outset, followed by a buildup of 11–13 Hz activities from these leads, which then spread anteriorly and inferiorly along the grid. Rhythmic spike-wave discharges were also detected soon after seizure onset spreading to several depth leads, especially the most anterior and middle temporal depth leads. At the conclusion of the study, the patient underwent an extensive right temporal resection with extension posteriorly toward the right temporo-occipital junction but sparing of much of the mesial temporal structures (including the hippocampus). Histology revealed subtle neuronal dysgenesis and focal superficial gliosis and areas of encephalomalacia in the posterior temporal neocortex, including the recorded seizure-onset zone. Histology of the microelectrode implant site showed mild gliosis. The patient has remained seizure free for more than a year since the resection.
Patient P3 (mesial temporal sclerosis).
Patient P3 was a left-handed, 32-year-old man at the time of his surgery, with a history of pharmacologically intractable partial complex seizures beginning when he was 10 years old. His seizures were characterized by sudden onset of nonsensical speech followed by staring and unresponsiveness with head turning to the right, automatisms, and posturing involving the right more than left arm and hand. These spells last ∼1–2 min. MRI suggested left (dominant) temporal polymicrogyria. He underwent placement of grids and strips to delineate the seizure focus with respect to this area of abnormal sulcation. The NeuroPort was placed in the left superior temporal gyrus. Seizures were found to emanate from the mesial temporal structures, with secondary generalization and spread superior temporal gyrus (including the microelectrode array implant site) and beyond. The patient underwent a left temporal lobectomy. Histology showed extensive sclerosis in hippocampus and mild gliosis with no evidence of cortical dysplasia in the microelectrode implant site. He was seizure free for two years after the surgery (latest follow-up).
Patient P4 (mesial temporal sclerosis).
Patient P4 was a 21-year-old, right-handed man whose seizures began at the age of 15. His seizures were characterized by a blank stare and oral automatisms accompanied by stiffening and posturing of the right hand. While his MRI was unremarkable, his semiology and phase I recordings suggested a left temporal onset. Consequently, he was implanted with a series of strip electrodes covering the left frontal and temporal regions. The NeuroPort array was placed in the middle temporal gyrus ∼1–2 cm posterior to the temporal tip. All of the seizures had similar clinical and electrographic signatures with a left gaze preference at onset followed by tonic and then clonic movements of the right arm. Electrographically, the seizures began with a generalized burst of sharp waves followed by sharp wave complexes that were maximal in mesial temporal leads. The patient underwent a left temporal lobectomy. Histology showed gliosis and moderate neuronal loss in regions CA4 and CA3 of the hippocampus, and mild dysplastic changes in the microelectrode implant site. He remains seizure free almost 3 years after his surgery (most recent update).
Microelectrode array signal processing.
Recordings were performed with the 96 microelectrode array NeuroPort system (BlackRock Microsystems; Hochberg et al., 2006; Schevon et al., 2008; Truccolo et al., 2008, 2011). Electric potentials were recorded broadband (0.3–7.5k Hz, analog filtering) and sampled at 30 kHz. For on-line detection and extraction of extracellularly recorded action potentials, recorded potentials were further digitally high-pass filtered (fourth-order Butterworth filter, 250 Hz high pass). Thresholded potential waveforms were further classified using standard methods based on clustering of principal components or other features (Offline Sorter; Plexon). Local field potentials were extracted by low-pass filtering the broadband recorded potentials (fourth-order Butterworth filter; cutoff at 500 Hz; forward backward), followed by decimation to 1 kHz.
Assessing spiking precision via conditional inference.
We used statistical hypothesis testing to assess the precision of neural spiking. More specifically, we used an existing method called jitter, which lets us probe the temporal precision of neural spiking, and also a novel extension of jitter that lets us further distinguish among different types of precise spiking. Jitter and its extensions are an example of conditional inference. Jitter is reviewed extensively in Amarasingham et al. (2012), but we will briefly describe it below for the reader's convenience. Jitter and the novel extension introduced here are special cases of a new framework for assessing neural spiking precision, which we call spatiotemporal conditional inference (Harrison et al., 2014).
Conditional inference: jitter and spike resampling.
Suppose we have a spike train dataset and we want to investigate neural spiking precision. The intuitive idea behind jitter is to create surrogate datasets by randomly perturbing, or jittering, the times of all spikes by small amounts, say 10 ms or less. Each of these surrogate datasets is very similar to the original on coarse timescales, but, almost by definition, cannot have any precise spike timing, since spikes have been randomly jittered. The dividing line between “coarse” and “precise” in this case is ∼10 ms, i.e., the scale over which spikes are jittered. If the original dataset is statistically unusual compared with the collection of surrogate datasets, then this is evidence that spikes are precisely timed.
Conditional inference and robustness.
The jitter intuition can be formalized as a proper statistical hypothesis test using a principle called conditional inference (Harrison et al., 2014). The idea behind conditional inference is to factor the full probability distribution of the data into a term that corresponds to “coarse spiking” and a term that corresponds to “precise spiking” given coarse:
 |
Conditional inference, in this case, focuses on the latter p(precise | coarse) term to formulate statistical questions about the nature of precise spiking. The methods are robust to many types of temporal variability, periodicity, nonstationarity, and model misspecification by virtue of being invariant to the p(coarse) term in the above factorization. Axonal spiking rates exhibit striking nonstationarity, particularly during epileptic seizures, and there is little consensus in the field about appropriate statistical models. The robustness provided by conditional inference is a key feature of our analysis.
The null hypothesis that we test is whether the p(precise | coarse) term is uniform, or maximum entropy, meaning that there is no additional structure in precise spiking once we have conditioned on the observed coarse spiking. By varying what we mean by coarse spiking, we are able to probe the nature of precise spike timing in the data. We focus on two different notions of coarse spiking: the Δ-coarse covariation model and the Δ-coarse covariation plus local network activation model. Δ is a timescale parameter that we vary, analogous to the 10 ms maximum perturbation used in the jitter example above.
Δ-coarse covariation model.
The Δ-coarse covariation model defines coarse spiking to be the spike count of each unit in each Δ-ms interval (nonoverlapping). Basically, coarse spiking corresponds to discretizing spike times to the nearest Δ ms, instead of the nearest 1 ms (the latter is what we do for precise spiking). Here we experiment with Δ values of 5, 10, and 25 ms. To generate surrogate data from the Δ-coarse covariation model, we simply uniformly perturb the precise timing of all spikes within their respective Δ-ms coarse intervals. Surrogate datasets can be compared with the original for hypothesis testing. If we conceptualize the data as a binary (zero-one valued) matrix X with Xit indicating whether or not unit i spiked in 1 ms time bin t, then the surrogate data preserves the sum over nonoverlapping intervals of Δ consecutive entries in each row (i.e., the Δ-coarse covariation). For example, if Δ = 4, then the sum X31 + X32 + X33 + X34 is preserved and the sum X35 + X36 + X37 + X38 is also preserved, corresponding to the spike count from unit 3 in the first two Δ-length coarse intervals. Analogous sums corresponding to all units (not just unit 3) and all nonoverlapping Δ-length coarse intervals (not just the first two) are similarly preserved in the surrogate data.
Δ-coarse covariation plus local network activation model.
The Δ-coarse covariation model is, in principle, sensitive to all types of precise spike timing. One source of precise timing might be a fast, simultaneous, shared modulation in spiking activity common to all recorded units. The neurophysiological causes of shared modulation are not clear–perhaps shared common input or emergent properties of the local network dynamics–but the signatures of shared modulation are clearly visible in the rasters as strong vertical bands of either high spiking rates or near silence, particularly at seizure onset/offset and during SWC seizures (see Results). To test whether this shared modulation in local network activity could explain the precise timing that we observe using the Δ-coarse covariation model (see Results), we created a new model called the Δ-coarse covariation plus local network activation model.
The new model changes the definition of coarse spiking that is used for conditional inference. The new notion of coarse includes all of the original information, i.e., spike counts in Δ-ms intervals, but also the instantaneous total recorded activity as measured by the total spike count (summed over all recorded units) in the original 1 ms time bins, which we call local network activation. It may seem unusual to refer to 1 ms precision local network activation as coarse. While it is not temporally coarse, it is “spatially” coarse, in the sense that it is an average over all recorded units.
By incorporating the local network activation into our definition of coarse, we have changed the type of precise spiking that our methods are able to detect. Before, the methods could detect any precise spiking, at least in principle. Now they can only detect precise spiking that cannot be explained by the local network activation. This lets us probe the nature of the precise spiking detected in our data to determine whether it is consistent with processes that might cause fast, shared modulation in spiking, or, alternatively, if it suggests the existence of cell-specific precise timing, such as might be predicted from theories of small, precisely timed cell assemblies.
Surrogate data generated under the Δ-coarse covariation model plus local network activation is similar to that generated under the original model in that spikes are perturbed within their respective Δ-ms intervals. However, the perturbations are now more constrained: they are uniform subject to preserving the observed 1 ms local network activation. If we conceptualize the data as a binary matrix X as before, then the surrogate data preserves all of the sums described above (the Δ-coarse covariation) and also all of the column sums (the local network activation), such as X17 + X27 + … + XN7 where N is the number of single units. It is a highly nontrivial problem to generate surrogate data under the Δ-coarse covariation plus local network activation model. It includes as a subproblem the uniform generation of binary matrices with specified row and column sums, a celebrated problem in statistics and theoretical computer science. We use software described in Miller and Harrison (2013) for exact uniform sampling for this problem.
The Δ-coarse covariation plus local network activation has some superficial similarities to the raster marginals model in Okun et al. (2012), but is actually quite different from the perspective of the null hypotheses being tested. The raster marginals model is designed to be a minimal description of neural spiking of finite parametric dimension. It only preserves the total spike count of each unit, not the time-varying pattern of coarse-temporal spiking. Neither does it preserve the time course of local network activation (population activity, in their terminology), but rather just the relative frequency of different amounts of activation. It is not an appropriate null model for probing the dynamics of precise spiking. In particular, the coarse-temporal modulation of spiking rates observed in our data is striking and any null model must account for these dynamics (Brody, 1998, 1999; Amarasingham et al., 2012).
Correlation test statistic, p values, and multiple testing.
Comparing the original data to a collection of surrogates requires a test statistic. We used the average extremal Pearson coefficient, namely,
 |
where ρij(k) is the Pearson correlation coefficient between spike trains i and j (viewed as binary time series with 1 ms time bins) at a lag of k ms. Although this test statistic is formed from pairwise comparisons between spike trains, it is likely to be sensitive to higher order correlations, particularly higher order synchrony. Higher order correlations will tend to influence many pairwise correlations and, consequently, the average correlation reported by ρ will be strongly influenced. The maximum over lags up to ±10 ms was designed to detect precise correlations that might be slightly lagged and to reduce, in part, the influence of our choice of 1 ms time bins.
For each choice of Δ and each of the two null models considered here and each seizure, we generated 10,000 surrogate datasets using that model-Δ combination. We included the original data among the surrogates to get a total of 10,001 comparison datasets (cf., Harrison, 2013). For each dataset and each 15 s moving time window (stepped by 2.5 s) we computed ρ separately. Only those units with at least one spike (i.e., not silent) in a given 15 s window were included in the computation of ρ. For each 15 s window we computed a separate p value, namely, the fraction of the 10,001 comparison datasets whose values of ρ in that window were greater than or equal to the corresponding value of ρ from the recorded data.
A multiple testing correction procedure for dependent data that controls the false discovery rate (Benjamini and Yekutieli, 2001) was applied. It corrected for all of the multiple tests across two models, 10 seizures, 3 temporal coarsening levels (Δ), and all of the multiple moving time windows in each seizure, for a target α = 0.01. This test statistic used here is admittedly ad hoc, but was motivated by a priori neurophysiological considerations and was not chosen based on its performance on the dataset under consideration. We did explore other test statistics and related statistical procedures after choosing this one (results not reported), partly to investigate the influence of silent units (see following paragraph) and partly at the suggestion of reviewers. These unreported analyses did not reveal additional features of the data, nor did they indicate that the current results were artifactual in some way.
Conditional inference: connection to maximum entropy models.
Our conditional inference methodology can be connected to maximum entropy (Jaynes, 1957, 1982) log-linear models (Martignon et al., 2000; Amari, 2001; Agresti, 2007), which have been used extensively for spike train analysis. Let X denote the original data (viewed as a binary matrix) as before. Let S = S(X) denote the Δ-coarse covariation (i.e., the collection of spike counts for each unit and each Δ-interval) and let U = U(X) denote the local network activation (i.e., the column sums of X). We can view S as an N × W matrix, where Siw gives the spike count of unit i in Δ-interval w. Similarly, we can view U as a T-vector, where Ut gives the total recorded activity in 1 ms time bin t, i.e., the total number of ones in the tth column of X. Consider the following joint neuronal spike train probability mass function (pmf) for the data:
 |
where α is an N × W matrix of unknown parameters and Z(α) is the normalization constant chosen so that the pmf sums to one. Whenever this model holds for the data, then the Δ-coarse covariation model also holds. The matrix S is the sufficient statistic for this maximum entropy model. S is also the formal definition of coarse spiking for the Δ-coarse covariation model. Similarly, if the model
 |
holds for the data, then the Δ-coarse covariation plus local activation model also holds. β is a vector of T parameters and Z(α,β) is the normalization constant. The pair (S,U) is the sufficient statistic for the maximum entropy model, and also the formal definition of coarse spiking for the Δ-coarse covariation plus local activation model. We emphasize that a rejection of either of our conditional inference models implies not only a rejection of the corresponding maximum entropy model, but also a rejection of a much larger class of models, since our conditional inference procedure is invariant to distributional assumptions about the sufficient statistics, whereas the maximum entropy models implicitly specify the distributions of the sufficient statistics (Harrison et al., 2014).
Spectral analysis.
Power and coherence spectra were estimated via multitaper methods (Mitra and Pesaran, 1999), with the half-bandwidth set to 5 Hz. Estimated power and coherence were computed based on a 4 s (single realization) time window, resulting in the use of 39 tapers. Spectra based on shorter 1 s time windows were also estimated, resulting in qualitatively similar results. We preferred a longer 4 s window because of its much larger number of tapers, important for the assessment of statistical significance. Spectrograms and coherograms were obtained by stepping this 4 s time window by 500 ms at a time. Statistical significance of power and coherence peaks for count and LFP processes during the seizure was assessed based on the theoretical formulas given in Jarvis and Mitra (2001), their pages 729 and 731–732). If the number of degrees is large (>20), the theoretical and jackknife confidence intervals and p values are in close agreement (Jarvis and Mitra, 2001). In our case, the number of degrees of freedom corresponded to 78 (i.e., 2× number of tapers).
Cross-frequency phase-amplitude coupling.
Coupling between the phase of a low-frequency oscillation (e.g., spike-wave discharge) and the amplitude of a higher amplitude oscillation (e.g., ∼130 Hz) was assessed following the approach introduced by Kramer and Eden (2013). For example, in the specific case of examining the cross-frequency phase-amplitude coupling between SWCs and high-frequency oscillations (HFOs), broad band LFPs were filtered into two bands (0.3–5 Hz for SWCs and 100–160 Hz for HFOs; Kaiser filter, forward backward), resulting into two LFP time series. A generalized linear model (GLM) where the expected amplitude (Hilbert transform) of the LFP high-frequency time series is a function of the LFP low-frequency time series' phase was then estimated. The GLM was estimated under a gamma distribution and a log link function. A cross-frequency coupling statistic r is computed as follows:
 |
where As is the modeled-estimated expected HFO's amplitude conditioned on the low-frequency oscillation's phase, and A0 corresponds to the expected amplitude given a null (no effects) model. This statistic can be interpreted as the largest proportional change in amplitude resulting from the cross-frequency phase modulation. A parametric bootstrap was used to generate 95% confidence intervals (for review, seeKramer and Eden, 2013).
Results
LFP oscillatory activity and patterns of neuronal population spiking during seizures
Ten seizures in four patients were examine in this study. The identified pathology in each patient consisted of mesial temporal sclerosis (P1, P3, and P4) and neocortical dysplasia (P2). MRI scan indicated areas of encephalomalacia in P1 and P2. (Encephalomalacia, together with gliosis, is a common lesion in patients with focal seizures; Hakami et al., 2013.) Nevertheless, histology of the actual microelectrode array implanted neocortical sites in P1 and P2 showed clear neuronal structures and layers, which together with the fact that we recorded a large number of neurons in each case, indicate that the microelectrode array was not in areas of encephalomalacia. All seizures consisted of secondary generalized seizures, and 96-channel MEAs were implanted in the middle (P1, P2, and P4) or superior (P3) temporal gyrus. The data consisted of a total of 787 single-unit recordings: 149, 131, and 131 simultaneously recorded units for P1 in seizures 1–3 (S1–S3), respectively; 84, 66, and 45 for P2, seizures 1–3, respectively; 41 and 26 for P3, seizures 1 and 2, respectively; and 57 units simultaneously recorded in each of the two seizures for P4.
Based on the LFPs recorded by the implanted intracortical MEAs, we classified the focal seizures into two main groups: seizures characterized by sustained ∼40–60 Hz gamma-band oscillations and seizures characterized by spike wave or SWCs, which included single and polyspike events. In terms of the classification of Perucca et al. (2014) based on field potential patterns at the seizure onset, all gamma-band seizures (P1–S1, S2, and S3) showed a spike or spike wave at onset. That was also the case for two of the SWC seizures in P2 (S1, S3). P2–S3 showed periodic spikes. After seizure onset, seizures in P1 and P2 evolved into low-voltage rhythmic fast activity, which then progressed further into sustained gamma-band oscillations (P1) or into SWCs (P2). All seizures in P3 and P4 started with periodic spikes, which evolved quickly into SWCs. The identified onset patterns in the seizures studied here are consistent with the relationships to underlying pathology found in Perucca et al. (2014). In particular, periodic spike onsets were observed only in mesial temporal sclerosis (P3 and P4). In addition, as Perucca et al. (2014) noted, mesial temporal sclerosis and cortical dysplasia cases can also show other onset patterns beyond periodic spikes, which is consistent with our finding of P1 (mesial temporal sclerosis) and P2–S1 and S3 (cortical dysplasia) showing spike-wave discharges at seizure onset.
Figure 1 shows one example for each seizure type, a gamma-band seizure in P1 (S1) and a SWC seizure in P2 (S1). In both cases, neurons across the recorded ensemble showed a wide variety of spiking rate transients (increases/decreases) in the initial stages of the seizure. This heterogeneity in neuronal spiking patterns was captured by the increase of the Fano factor of the spike counts (1 s time bin) across the population (Truccolo et al., 2011). Neuronal spike rates became more homogenous across the population toward later stages of the seizure. Seizure termination in all seizures was characterized by an almost complete cessation of neuronal spiking, which could last tens of seconds. These features (change in firing rates, changes in LFP oscillatory patterns, and cessation of activity at seizure termination) are all typical in an area of cortex that has participated in an ictal event followed by the characteristic postictal “silence” period. Similar features were observed in all of the 10 seizures examined here. LFP-ictal activity examples for P3 (S1) and P4 (S1) are shown in Figure 2A. In addition, the location of implanted microelectrode arrays in all four patients and the ECoG-based seizure-onset zones are shown in Figure 2B.
Figure 1.

Examples of two seizure types. A, A seizure in P1 (S1) showing a representative LFP recorded from one of the microelectrodes with an early ictal discharge (“sentinel spike”; top plot), at seizure onset (time 0). This initial event is followed by sustained narrow gamma-band oscillations that increase in amplitude. The raster (bottom) plot shows the neuronal spike trains with each row corresponding to the spike train of a single neuron. B, An example of a seizure characterized by SWCs (P2–S1). An initial SWC event at seizure onset is followed by transient and low amplitude faster oscillations, which then evolved into a long sequence of SWCs (2–3 events per second) until seizure termination.
Figure 2.

Additional seizure examples and microelectrode array implant sites. A, Examples of LFP activity during SWC seizures in P3 (S1) and P4 (S1). B, Microelectrode array implant site location is indicated by the red square. Black dots indicate the location of subdural-intracranial EEG (iEEG) electrode locations. The green-shaded areas indicate seizure-onset zones based on recorded iEEGs. The green-shaded area in P3 refers to underneath depth electrodes.
Gamma-band oscillations in P1 were characterized by ∼60 Hz oscillations at the beginning of the seizure, which then gradually slowed to about 40 Hz toward seizure termination (Fig. 3A), suggesting critical slowing down (Kramer et al., 2012). Similar gamma oscillations were also present in all of the subdural ECoG recordings from nearby electrodes and were also seen on electrodes in the seizure-onset zone (see Materials and Methods). Together with these sustained gamma-band oscillations, various other types of oscillations in the 10–20 Hz and lower frequency bands could appear as transient isolated events lasting several seconds (Fig. 3B). Despite the sustained gamma-band oscillations, neuronal spiking appeared highly irregular throughout the ictal period, even toward seizure termination where the majority of neurons were active with high spiking rates (Fig. 3A). Similar features were present in seizures S2 and S3 for patient P1.
Figure 3.

LFP and neuronal ensemble spiking in a seizure characterized by sustained gamma-band oscillations. A, Representative LFP (0.3–500 Hz) recorded from P1–S1 shows narrow gamma-band oscillations, which were highly coherent over the recorded patch of neocortex. The middle and bottom plots show the neuronal spike raster over the ensemble and the corresponding spike count (1 ms time bin) over the population at each time instant, respectively. Single-neuron spiking was highly irregular despite the presence of narrow gamma-band oscillations. Neurons in the raster plot were ranked according to their mean spiking rate during the seizure (higher spiking rates at the top). B, The top and middle plots show the power spectrograms (dB) for the population count process and for the LFP, respectively. The bottom plot shows the spectral coherence between the neuronal population spike count process and the LFP. Episodic coherence between neuronal population spike count and LFPs occurred toward the end of the seizure primarily in the gamma band and ∼10 Hz. Spectral measures were computed based on 4 s moving time windows. Transient power peaks in spectrograms (∼10 and ∼40–60 Hz) were determined statistically significant based on 95% confidence intervals. The episodic low-frequency (∼10 Hz) and high-frequency (∼40 Hz) coherence events were statistically significant (p = 10−12 and p = 10−8, respectively). Confidence intervals and p values (see Materials and Methods) were computed according to the theoretical formulas given in Jarvis and Mitra (2001).
In contrast, neuronal spiking showed temporal clustering in the SWC seizures recorded in P2–P4. The slow SWC dynamics induced a coarse timescale for neuronal synchrony (e.g., P2–S1; Fig. 4A). Neuronal spiking across the recorded ensemble occurred primarily during the SWC spike phase (∼100–200 ms) and was typically suppressed during the SWC wave phase. (Although not all events were characterized by fast components of <70 ms as the classic definition of a SWC spike implies, for the sake of brevity we refer to this component as the spike phase.) However, even during the SWC spike phase there was large variability in spiking rates among the recorded neurons (Figs. 4A, 5F). In some of these seizures, SWCs were accompanied by high gamma-band oscillations (∼80 Hz) and other HFOs (∼130 Hz) as seen in Figures 4B and 5C. Cross-frequency amplitude-phase coupling analyses revealed that narrow band HFOs occurred primarily during the SWC spike phase (Fig. 5C–F). In contrast, cross-frequency coupling analyses for P1 (gamma-band seizures) revealed only a transient coupling between ∼10 Hz and gamma-band oscillations during certain stages for some of the P1 seizures (Fig. 5A,B).
Figure 4.
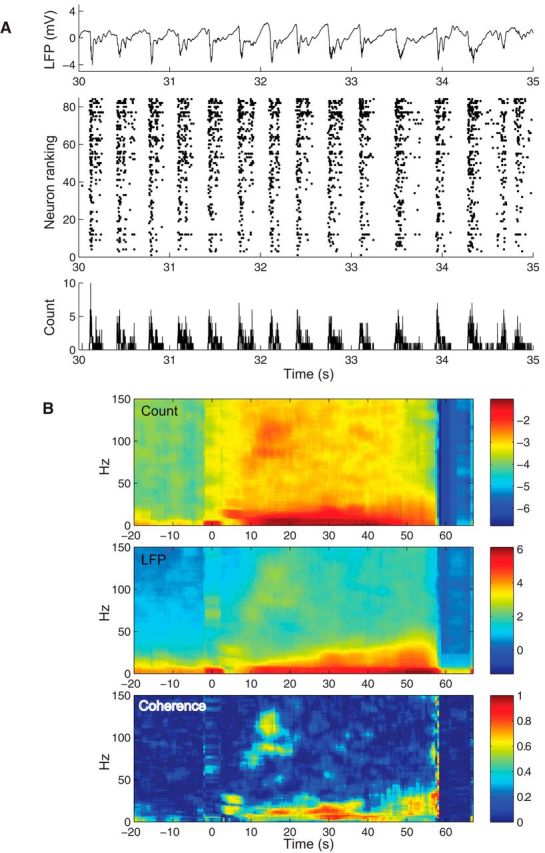
LFP and neuronal ensemble spiking in a seizure characterized by SWCs. Same conventions as in Figure 3. A, A representative LFP (0.3–500 Hz) recorded from P2–S1 shows repeating SWCs during the seizure. Seizures in P2–P4 showed similar features. B, Throughout the seizure, coherence was dominated by low frequencies (<20 Hz). In addition, an isolated event of high-frequency coherence of ∼70–80 Hz and 110–130 Hz occurred about 15–20 s into the seizure (p = 10−8 and p = 10−9, respectively). All p values were computed (see Materials and Methods) according to Jarvis and Mitra (2001).
Figure 5.

Cross-frequency phase-amplitude coupling, HFOs, and neuronal spike-triggered LFP power spectrograms. A, Average power spectrograms (dB) triggered at the peak of 10 Hz LFP oscillations toward the end of the seizure show phase-amplitude coupling between these oscillations and narrow gamma-band activity in P10–S1 (see also Fig. 3B). B, Expected amplitude (envelope) for gamma oscillations predicted by different phases of the 10 Hz oscillations shows significant cross-frequency phase-amplitude coupling. The two additional red curves indicate 95% confidence intervals. The black line shows the amplitude predicted by a null (no phase effects) model. Higher (lower) expected amplitudes with respect to the null model indicate increase (decrease) in gamma oscillation amplitude for a given phase of the 10 Hz oscillation. The cross-frequency phase-amplitude coupling statistic r indicates the largest fractional change in gamma oscillation amplitude predicted by the phase modulation effect with respect to the null model. Zero phase corresponds to the peak of the ∼10 Hz oscillation. No similar coupling was observed between gamma oscillations and power in higher frequencies during gamma-band seizures. C, Average spectrograms triggered at the SWC spike for P2–S1 during the 10–20 s period into the seizure (see also Fig. 4B). Strong power suppression surrounding the SWC spike is observed. In addition, a substantial increase in power is observed especially around high (∼80 Hz) gamma and (∼130 Hz) at the SWC spike time. D, The cross-frequency phase-amplitude coupling statistic r indicates a strong modulation effect. Zero phase corresponds to the SWC spike time. Same conventions as in B. E, The average power spectrogram triggered by the neuronal spike times of a chosen neuron in P2–S1 also reveals the co-occurrence of neuronal spikes (action potentials), high gamma-band oscillations, and HFOs. F, HFOs were clearly visible during the spike phase of many SWC discharges in the 10–20 s period into this P2–S1 seizure.
Neuronal population activity and LFPs show transient coherence in gamma and HFO bands
Narrow gamma oscillations and HFOs might relate to fine temporal synchrony in the underlying neuronal population spiking activity. To examine this possibility, we computed the spectral coherence between the average population spike count (i.e., neuronal spike counts summed across the entire recorded population in 1 ms time bins) and LFPs, henceforth referred to as the count-field coherence. In addition to count-field coherence events in low-frequency bands (<20 Hz), there was significant coherence in gamma bands for both types of seizures, and in the HFO band for the SWC seizures. For example, episodic neuronal count-field coherence in P1 (S1) appeared toward the end of the seizure in the gamma band (∼40 Hz) and ∼10 Hz (Fig. 3B). In P2 (S1), beyond the expected count-field coherence in low-frequency bands due to slow correlation between neuronal spiking and SWCs, additional episodic high coherence events were observed in the high gamma and HFO bands (Fig. 4B). This count-field coherence in the HFO range was also consistent with single-neuron spike-triggered averages of LFP power spectrograms (Fig. 5E,F). Despite clear coherence events in low-gamma, high-gamma, and HFO bands, these events were not sustained throughout any seizure, nor were they consistently present in all seizures in the same patient, as evidenced by the variety of patterns in spectral coherence between neuronal population spike count and LFPs in all of the patients and seizures (Fig. 6).
Figure 6.

Spectral coherence between population spike count and LFP during seizures. The coherograms for seizures in all patients are shown. Overall, there was a diversity of patterns and low-frequency coherence episodes were much more consistent across seizures and patients than transient high-frequency coherence episodes. Some of these transient coherence events in gamma (∼40 Hz), high gamma (∼80 Hz), and in HFOs (>100 Hz), which are particularly relevant for fine temporal precision in neuronal spiking synchrony, are indicated by the white arrows. Transient gamma coherence was observed in P1–S1 (p = 10−8), but not in P1–S2 and S3. High-frequency coherence events were observed in P2–S1 around ∼80 and ∼130 Hz, p = 10−8 and p = 10−9, respectively, and similarly for P2–S2. Weaker, but still significant, transient coherence events were detected in P3–S1 and P3–S2, p = 10−6 and p = 10−4, respectively; and in P4–S1 at ∼80 Hz, p = 10−8. All p values were computed (see Materials and Methods) according to Jarvis and Mitra (2001). Seizure onset is at time 0. We note that different seizures have different durations and that the analysis starts at seizure onset for P3 (see Materials and Methods).
Fine temporal synchrony is transient and depends on seizure type, patient, and seizure
The detected episodic high-frequency coherence events between neuronal population spiking and LFPs suggest the occurrence of fine temporal synchrony among single neurons' spiking activity. We examined this possibility in more detail by assessing the temporal precision of correlations between spike trains from pairs of neurons in the recorded population. Previous work (Brody, 1998, 1999; Amarasingham et al., 2012) has shown that slow covariations in nonstationary neuronal spiking rates can induce peaks in synchrony measures, which might be confounded with much finer temporal precision synchrony. For example, nonstationary spike counts in Δ = 25 ms time bins that are highly correlated between otherwise independent neuronal pairs (i.e., no finer synchrony) can result in statistically significant correlation measures computed on 1 ms time resolution spike trains. In this example, all the apparent fine-precision synchrony arises purely by chance and can be explained by much coarser covariations on a 25 ms timescale. To remove these confounding effects in the assessment of the temporal precision of synchrony in neuronal spike trains, we adopted a recently developed approach based on conditional inference (Amarasingham et al., 2012; Harrison and Geman, 2009; see Materials and Methods).
We tested a null hypothesis, the Δ-coarse covariation model, where all synchrony is explained by the coarse covariation in nonstationary spiking rates among the recorded neurons defined in time bins of duration Δ. The Δ-coarse covariation model thus states that given neuronal spike counts in Δ-wide time bins, the spike times are maximally random (maximum entropy), i.e., no finer temporal structure than that specified by Δ exists. This model can be derived from a maximum entropy (Jaynes, 1957) log-linear model (Martignon et al., 2000; Amari, 2001) of the joint spiking probability conditioned on the observed spike counts in Δ-coarse time windows (Eq. 3; see Material and Methods).
To test the null hypothesis, i.e., that there is no temporal synchrony finer than a timescale defined by Δ, we assessed how randomly jittering neuronal spike times, under the constraint of preserving the spike count in specific Δ time intervals for each neuron, affected a given summary test statistic (synchrony measure) for the entire ensemble. The test statistic was defined by the average extremal Pearson correlation coefficient (Eq. 2; see Materials and Methods), which was computed as follows. Pearson correlation coefficients between all pairs of single-neuron spike trains, at multiple time lags from −10 to 10 ms, were computed in 15 s moving windows, stepped by 2.5 s from a pre-ictal period until seizure termination. The coefficients with the greatest absolute value over the computed time lags were then averaged across all of the neuronal pairs resulting in the average extremal Pearson correlation coefficient. To systematically quantify the level of temporal precision, we randomly jittered neuronal spike times in each spike train while preserving the spike counts in nonoverlapping time intervals of various lengths (or temporal coarsening) corresponding to Δ = 5, 10, and 25 ms.
Figure 7 illustrates the approach for gamma-band (P1–S1) and SWC (P2–S1) seizures. During the pre-ictal period, the null hypothesis was rejected only for coarser temporal precision at the level of Δ = 25 ms in both P1 (S1) and P2 (S1). A single transient 10 ms temporal precision synchrony event was detected for P1 toward the end of the seizure. This 10 ms fine synchrony event coincided with the transient coherence between population spiking and LFP in the ∼40 Hz gamma band observed above (Fig. 3B). The null hypothesis was rejected for Δ = 10 and Δ = 25 ms during the entire ictal period for P2 (S1), and a single 5 ms temporal precision event was detected toward the end of the seizure. Rejections of the null hypothesis for Δ = 5 and Δ = 10 ms indicated that fine (<10 ms) temporal synchrony, unexplained by the coarse Δ-covariation model, existed during certain periods in these two seizures.
Figure 7.
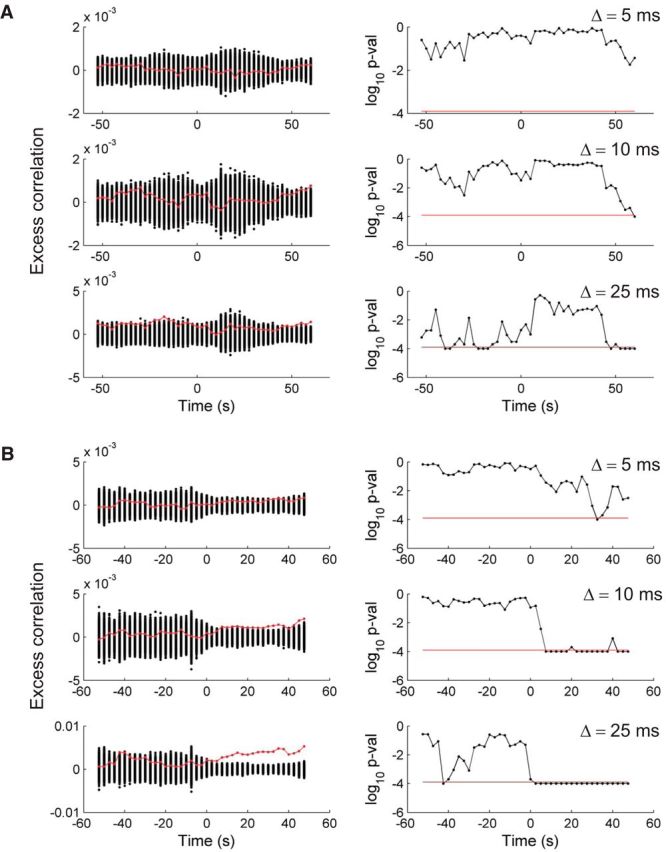
Assessing temporal precision of neuronal synchrony during pre-ictal and ictal periods: Δ-coarse covariation models. Examples for gamma-band (P1–S1) and SWC (P2, S1) seizures are shown in A and B, respectively. Left column, Shows the average extremal Pearson correlation coefficients (test statistic) based on each of the 10,000 resampled spike trains for each recorded neuron according to the Δ-coarse covariation model (see Materials and Methods). Each black dot at a given time corresponds to one of the 10,000 resamples. Each time point was computed from a (centered) 15 s time window, which was stepped by 2.5 s. The red curve corresponds to the test statistic computed on the actual spike trains. (The mean test statistics computed on the resampled data at each time point has been subtracted from both the data and the resampled test statistics for display purposes.) Right column, Gives the corresponding one-tail p values. The horizontal red line corresponds to the critical p value after correction for multiple testing and a target α = 0.01. A false discovery rate correction approach for dependent p values (Benjamini and Yekutieli, 2001) was used to correct for the multiple hypothesis tests, including all 10 seizures, two different maximum entropy models, three different Δ-temporal coarsenings, and all of the moving 15 s windows in each seizure. Values below the corrected critical p value suggest that some of the measured pairwise correlations showed a certain level of finer temporal synchrony not explained by the model.
Examination of the Δ-coarse covariation model across all patients and seizures revealed that synchrony during the pre-ictal period was characterized by episodic events of coarse (>10 ms) temporal precision (Fig. 8) and not by significant fine temporal synchrony. During the ictal period, the temporal precision of neuronal synchrony was diverse even for seizures recorded from the same patient. For instance, episodic fine temporal synchrony events were not detected during the two other examined seizures (S2, S3) for P1. In addition to the transient event in P2 (S1), only P4 showed fine temporal synchrony events at the sub-5 ms level. Nevertheless, all SWC seizures, with the exception of P3–S2, showed episodes of fine neuronal spiking synchrony. The time course of the average absolute pairwise correlation itself showed considerable variation across patients. In P1, it tended to decrease compared with the pre-ictal period, while it tended to increase and show a transient peak during the seizure in the other three patients. Together, these results indicate that fine temporal synchrony can be present or not occur at all depending on patient and seizure, and that sustained and consistent precise synchrony (<10 ms) is transient in focal seizures. The detection of fine temporal synchrony depends on the test statistic and on statistical power, the latter of which likely varies across seizure, patient, and time. Qualitatively similar results were obtained with different test statistics consisting of the variance, the coefficient of variation, and the 95th percentile of the extremal Pearson correlation coefficient computed across all of the neuronal pairs in the recorded ensemble. Furthermore, we were unable to identify any relationship between the pattern of rejected hypotheses and those variables that most strongly influence statistical power, such as, firing rate or number of active neurons. These additional analyses, coupled with an apparent scarcity of precise (<10 ms) spike alignments in visual inspection of the spike rasters, reinforce our finding that while brief synchronous events are present, sustained fine temporal synchrony is not a common feature during these seizures.
Figure 8.

Temporal precision of neuronal synchrony: Δ-coarse covariation model (summary over patients and seizures). The average extremal Pearson correlation coefficients across all of the neuronal pairs, is shown by the black trace, for each patient and seizure. Color-shaded areas correspond to time periods where the null hypothesis, according to different (Δ = 5, Δ = 10, and Δ = 25 ms) coarse covariation models, was rejected (p value < 0.01, corrected for multiple testing). The rejection of the null hypothesis for a finer temporal coarsening implies the rejection of the null for coarser timescales (gamma-band seizures: P1; SWC seizures: P2–P4). We note that different seizures have different durations and that the analysis starts at seizure onset for P3 (see Materials and Methods).
Fast fluctuations in local network activation explain fine temporal neuronal synchrony during seizures
To investigate the neural dynamics underlying these brief, transient, fine temporal synchrony events not explained by the Δ-coarse covariation model, we formulated a novel maximum entropy model (Δ-coarse covariation plus local network activation model). Based on the observed coherence between the neuronal population spike count and the LFP at low and higher frequencies in both types of seizures, neuronal-spiking pairwise correlations in the Δ-coarse covariation plus local network activation model depend not only on coarse covariations among nonstationary spiking rates but also on fluctuations in local network activation on a faster timescale (Eq. 4; see Materials and Methods). The total number of spikes across the recorded neuronal ensemble in 1 ms time bins was used as a proxy for the local network activation in the recorded neocortical patch. This new model implies that, conditioned on coarse covariations in spiking rates and on faster fluctuations in local network activity, neuronal spiking across the population has no additional structure, i.e., is maximally random. We note that conditional inference based on the Δ-coarse covariation plus local network activation model is not a trivial problem. It requires the sampling of binary matrices with constrained (row, column) margins to incorporate the conditioning on both the measured coarse spiking rates and local network activation. In the studied seizures, there are an exceedingly large number of different ensemble spiking patterns that satisfy these constraints. For example, in the seizure P2–S1, there are 6.7843 × 1021211 binary matrices, i.e., ensemble spike trains, which satisfied the constraints imposed by the coarse covariation plus local network activation model. The first, recently developed practical algorithm (Miller and Harrison, 2013; see Materials and Methods) for the exact counting and sampling of such binary matrices was used here (Fig. 9).
Figure 9.
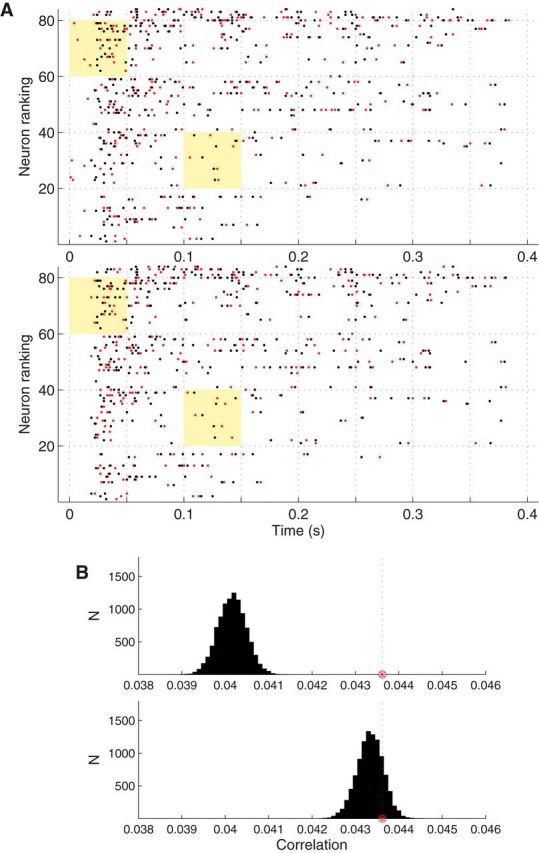
Conditional inference for the Δ-coarse covariation plus local network activation model. The hypothesis testing approach under the Δ-coarse covariation plus local activation model is illustrated. A, The top and bottom plots show the neuronal population spike raster (black dots) during the same SWC spike event (42–42.4 s in P2–S1; Fig. 1B). Neuronal spike trains of different neurons have been ordered (bottom to top) according to increasing spiking rate during the seizure. In addition, the top plot shows one resampled ensemble spike train (red) according to the Δ-coarse covariation model (Δ = 25 ms). The bottom plot shows the same but for a resample based on the Δ-coarse covariation plus local network activation model (again Δ = 25 ms). For easy comparison between the resamples from the two models, two time segments (yellow-shaded area) are highlighted. Jittering of spike times is more constrained in the Δ-coarse covariation plus local network activation model, especially at the onset of the SWC event (e.g., compare top left shaded periods with the bottom shaded right period). Nevertheless, this model still allows substantial jitter of spike times. B, The top and bottom plots show the histograms for the average extremal Pearson correlation coefficient (test statistic) based on a 15 s time window that included the 42–42.4 s period shown in A and on 10,000 resampled population spike trains under either the Δ-coarse covariation model or the Δ-coarse covariation plus local network activation model, respectively. The red star and vertical dashed line denote the location of the test statistic computed on the actual data. The null hypothesis was rejected only for the first model, indicating that coarse covariation together with fast fluctuations in local network activation accounted for all of the temporal correlations detected by the test statistics.
Failure to reject the null hypothesis under this new model during periods where the Δ-coarse covariation model was rejected (Fig. 8) would indicate that local network activation accounted for the unexplained fine temporal synchrony. With the exception of a single sub-10 ms precision event in P4–S2, all of the previously detected fine temporal precision synchrony events were accounted for by incorporating local network activation in the coarse covariation model (Fig. 10A). A summary of the results directly contrasting the two models, for all patients, seizures, and across different stages of the seizures, is shown in Figure 10B. Examination of neuronal spike rasters and corresponding LFP traces during SWC seizures (Figs. 4A, 9) indicated that fast changes in network activation during the initial phase of SWC spikes were the main contributors to the detected fine temporal synchrony events. In addition, most of the coarser temporal synchrony detected during pre-ictal and ictal periods was also accounted for by the new maximum entropy model. Furthermore, since the Δ-coarse covariation plus local activation model only added a general constraint on the total spike count across the neuronal ensemble, these results also imply that changes in precise spiking correlations between specific neurons were not required to explain most of the episodic fine synchrony detected during the ictal period.
Figure 10.

Temporal precision of neuronal synchrony: Δ-coarse covariation plus local network activation model (summary over patients and seizures). A, Same conventions as in Figure 8. With the exception of one event in P4–S2, all of the deviations from the Δ-coarse covariation model (Fig. 8), which suggested 5 and 10 ms fine synchrony during the ictal period, were accounted for by taking into account fluctuations in local network activity. B, Summary over seizures, patients, and models. The bar plots show the percentage of null hypothesis rejections (across all seizures at a given seizure stage) according to either the Δ-coarse covariation model or the Δ-coarse covariation plus local network activation model. Each ictal period was partitioned into five equally spaced time intervals (stages 1–5, from seizure onset to seizure termination). In addition, a 60 s pre-ictal period was considered as a single stage (“PI”).
Discussion
The temporal precision of neural synchrony at the level of single-neuron action potentials (spikes) is a fundamental issue for understanding the nature of epileptic seizures and the mechanisms underlying their initiation, spread, maintenance, and termination. In this study, we quantified the temporal precision of neuronal spiking synchrony in ensembles of neocortical neurons during two main types of propagated human focal seizures: seizures characterized by sustained (∼40–60 Hz) gamma-band LFP oscillations and seizures characterized by SWCs. Neuronal spiking during gamma-band seizures remained highly irregular and asynchronous, with fine (<10 ms) temporal synchrony rarely present. Synchrony in SWC seizures was observed in two main scales. Neuronal spiking showed strong phase locking with the (2–3 Hz) spike-wave discharges, with neurons firing almost exclusively during the SWC spike phase. This induced a coarse (∼50–100 ms) temporal synchrony. In addition, fine temporal synchrony was also detected in SWC seizures. Statistical analyses based on a new maximum entropy model showed that fluctuations in local network activity, rather than changes in precise spiking correlation between specific pairs of recorded neurons, explained most of the detected transient fine synchrony in both seizure types.
The coexistence of irregular/asynchronous neuronal spiking and sustained gamma-band LFP oscillations, in particular during electrographic gamma-band seizures, might seem initially counterintuitive. Under these circumstances, one might expect strong phase locking between neuronal spiking and gamma oscillations (e.g., neurons spiking preferentially during the down phase of an ∼40 Hz oscillation), and the consequent temporal clustering or synchronization of neuronal spiking across the recorded ensemble on a ∼10 ms timescale (e.g., 1/2 cycle of a ∼40 Hz gamma oscillation). One might also ask how these narrow gamma-band oscillations could even emerge given the asynchronous neuronal spiking in the population. Nevertheless, the coexistence of irregular spiking and narrow gamma-band LFP oscillations has been demonstrated and examined before in network models (Brunel and Wang, 2003). In this case, narrow gamma-band LFP oscillations can emerge from the collective dynamics in the neuronal network under various balance levels in excitatory–inhibitory synaptic inputs. To our knowledge, this is the first time the coexistence of irregular, asynchronous spiking in ensembles of single neurons and sustained gamma oscillations has been reported in human neocortex. Previous analysis (Truccolo et al., 2011) of these gamma-band seizures in P1 indicated that both putative pyramidal and inhibitory interneurons remained active throughout the seizure. This, together with the fact that ∼40 Hz gamma-band oscillations were sustained throughout the ictal period, indicates that interneuron-network function and excitatory–inhibitory network interactions (Buzsáki and Wang, 2012) were preserved during this type of ictal manifestation in gamma-band seizures.
Neuronal spiking was typically suppressed during the SWC wave phase in agreement with previous animal model studies (Steriade, 1974; Steriade and Contreras, 1998; Timofeev and Steriade, 2004). This strong and phasic suppression of neuronal spiking appears to be the major contributor to the coarse temporal synchrony observed in the SWC seizures. It is remarkable that such suppression is achieved given that not only principal neurons, but also inhibitory interneurons, are thought to remain silent during the SWC wave phase (Timofeev and Steriade, 2004; but see Keller et al., 2010, for counterexamples during interictal discharges). Traub et al. (2005) have shown both in in vitro and in biophysical models that most of the ictal features of SWCs in neocortex, including HFOs during the SWC spike, can be present even when both GABAA and GABAB receptors are blocked. Fast, rhythmic bursting pyramidal neurons and gap junctions in glutamatergic neurons in all cortical layers, together with slow calcium-mediated afterhyperpolarization currents, were critical in their biophysical model for the shaping of SWCs, HFO generation, and the associated neuronal spiking features.
Analyses based on the (maximum entropy) coarse covariation plus local network activation model suggested that the sharp and large increase in spiking probability for all neurons during the initial ∼20 ms of the SWC spike phase tended to induce neuronal spike coincidences on a finer (<10 ms) timescale. These fast fluctuations seem to reflect how sharply the rebound in neuronal spiking happens after the SWC wave ends. If the rebound is fast, the neuronal spiking probability also rises sharply and many neurons tend to spike during small time intervals in the initial SWC spike phase, increasing substantially the number of neuronal spike coincidences in these small intervals and thus resulting in fine temporal synchrony. We also note that, although this maximum entropy model accounted for most of the fine temporal synchrony, there was some coarser temporal structure that was not explained in a small fraction of seizure stages. Synchrony at this coarser level is also often observed among neurons in healthy neocortex, especially during sensorimotor and cognitive tasks as a result of task-related modulations of neuronal spiking rates (Oram et al., 2001). Fine temporal synchrony events in SWC seizures were also revealed by the spectral analysis of LFPs and neuronal population spike count. Cross-frequency coupling analyses showed that high gamma (∼80 Hz) oscillations and HFOs (∼130 Hz) occurred primarily during the spike phase of SWCs. HFOs have been a recent focus of interest, especially because of their hypothesized role in seizure initiation and as biomarker for seizure prediction (Bragin et al., 1999, 2010; Grenier et al., 2003; Worrell et al., 2004, 2008; Schevon et al., 2009; Staba and Bragin, 2011; Buzsaki and Silva, 2012). Significant coherence between neuronal population spike counts and LFPs in high gamma and HFO bands, as well as neuronal spike-triggered LFP power spectrograms, indicated that SWC neural dynamics could induce transient fine temporal synchrony events. Nevertheless, these transient high-frequency coherence events were rare and not consistent across seizures, even in the same patient.
Our findings about the level of synchrony in SWC seizures agree broadly with the findings reported by Schevon et al. (2012). As reported in Schevon et al. (2012), neuronal spiking was also strongly phase locked to the 2–3 Hz spike-wave discharges in all of the SWC seizures studied here. In addition, fine temporal synchrony was observed in most of the SWC seizures (Fig. 8), in particular during the initial SWC spike phase. However, the lack of fine neuronal spiking synchrony in the gamma-band seizures contrasts substantially with the high level of synchrony detected by Schevon et al. (2012) in recruited ictal cores. According to an alternative interpretation (Trevelyan et al., 2006; Schevon et al., 2012), the neural activity characterized here as gamma-band seizures, and in particular the lack of fine temporal synchrony in these seizures, could reflect instead an inhibitory “veto,” via feedforward inhibition, to seizure spread in neocortex. Feedforward inhibition, driven by the ictal core via short- and long-range axonal projections during seizure spread, would place areas ahead of the ictal wavefront into an “ictal penumbra” state. This ictal penumbra state would need to be broken for a cortical region to be finally recruited into the ictal core. Furthermore, areas under this ictal penumbra state would lack elevated levels of neuronal spiking synchrony. Schevon et al. (2012) proposed various criteria to classify recorded cortical patches into putative penumbra or recruited ictal core areas. Application of these criteria to the examined gamma-band seizures in our data did not lead to a conclusive classification. For example, Schevon et al. (2012) emphasized the reproducibility or stereotypy of neuronal spiking patterns across seizures as a criterion to settle this debate: ictal penumbra areas would lack reproducibility in neuronal spiking patterns across seizures while recruited ictal core areas would show high reproducibility. However, as we had previously demonstrated (Truccolo et al., 2011), the gamma-band seizures examined here show a remarkable reproducibility in single-neuron spiking patterns across seizures. We also emphasize that the same type of sustained gamma-band oscillations were consistently observed not only across the entire microelectrode array, but also in all of the intracranial (subdural ECoG and strips) recording sites, including the identified seizure-onset zones. In other words, it was not the case that some recorded cortical regions showed spike-wave discharges while others showed gamma-band activity, for example. We think that a definitive clarification to these contrasting findings and interpretations regarding neuronal spiking synchrony in focal seizures will ultimately require larger datasets and new experiments. Specifically, one would need to test whether inhibitory veto to seizure spread, resulting from ictal core-driven feedforward inhibition, is indeed the main process underlying the highly pathological and sustained (40–60 Hz) oscillations observed in these gamma-band focal seizures.
Although our research microelectrode recordings were restricted to small neocortical patches and although seizure activity might depend on how close the recordings are to the epileptogenic area, the seizure-onset zone and on seizure spread (as well as other clinic pathological features such as etiology, medications, and region of cortex), our study sheds new light on the nature and diversity of neuronal ensemble synchronization in neocortex during human focal epileptic seizures. As single-neuron recordings in people with epilepsy become more widespread, we hope to extend the novel analyses used here to larger patient datasets and more fully reveal the mechanisms and the richness of neural dynamics in human epilepsy.
Footnotes
This research is supported by the National Institute of Neurological Disorders and Stroke grants R01NS079533 (to W.T.) and R01NS062092 (to S.S.C.), and a K01 Career Award NS057389 (to W.T.); by National Science Foundation grants DMS-1007593 and DMS-1309004 (to M.T.H.); and by a Defense Advanced Research Projects Agency (DARPA) contract FA8650-11-1-715 (to M.T.H.), as well as postdoctoral fellowships from the Epilepsy Foundation and the Massachusetts General Hospital Fund for Medical Discovery (to O.J.A.). We thank the patients in this study, as well as the nursing and physician staff.
The authors declare no competing financial interests.
References
- Abeles M. Corticonics: neural circuits of the cerebral cortex. Cambridge: Cambridge UP; 1991. [Google Scholar]
- Agresti A. An introduction to categorical data analysis. New York: Wiley-Interscience; 2007. [Google Scholar]
- Amarasingham A, Harrison MT, Hatsopoulos NG, Geman S. Conditional modeling and the jitter method of spike resampling. J Neurophysiol. 2012;107:517–531. doi: 10.1152/jn.00633.2011. [DOI] [PMC free article] [PubMed] [Google Scholar]
- Amari S. Information geometry on hierarchy of probability distributions. IEEE Trans Inform Theory. 2001;47:1701–1711. doi: 10.1109/18.930911. [DOI] [Google Scholar]
- Benjamini Y, Yekutieli D. The control of the false discovery rate in multiple testing under dependency. Ann Stat. 2001;29:1165–1188. doi: 10.1214/aos/1013699998. [DOI] [Google Scholar]
- Bower MR, Stead M, Meyer FB, Marsh WR, Worrell GA. Spatiotemporal neuronal correlates of seizure generation in focal epilepsy. Epilepsia. 2012;53:807–816. doi: 10.1111/j.1528-1167.2012.03417.x. [DOI] [PMC free article] [PubMed] [Google Scholar]
- Bragin A, Engel J, Jr, Wilson CL, Fried I, Buzsáki G. High-frequency oscillations in human brain. Hippocampus. 1999;9:137–142. doi: 10.1002/(SICI)1098-1063(1999)9:2<137::AID-HIPO5>3.0.CO%3B2-0. [DOI] [PubMed] [Google Scholar]
- Bragin A, Engel J, Jr, Staba RJ. High-frequency oscillations in epileptic brain. Curr Opin Neurol. 2010;23:151–156. doi: 10.1097/WCO.0b013e3283373ac8. [DOI] [PMC free article] [PubMed] [Google Scholar]
- Brody CD. Slow covariations in neuronal resting potentials can lead to artefactually fast cross-correlations in their spike trains. J Neurophysiol. 1998;80:3345–3351. doi: 10.1152/jn.1998.80.6.3345. [DOI] [PubMed] [Google Scholar]
- Brody CD. Correlations without synchrony. Neural Comput. 1999;11:1537–1551. doi: 10.1162/089976699300016133. [DOI] [PubMed] [Google Scholar]
- Brunel N, Wang XJ. What determines the frequency of fast network oscillations with irregular neural discharges? I. Synaptic dynamics and excitation-inhibition balance. J Neurophysiol. 2003;90:415–430. doi: 10.1152/jn.01095.2002. [DOI] [PubMed] [Google Scholar]
- Buzsáki G, Silva FL. High frequency oscillations in the intact brain. Prog Neurobiol. 2012;98:241–249. doi: 10.1016/j.pneurobio.2012.02.004. [DOI] [PMC free article] [PubMed] [Google Scholar]
- Buzsáki G, Wang XJ. Mechanisms of gamma oscillations. Annu Rev Neurosci. 2012;35:203–225. doi: 10.1146/annurev-neuro-062111-150444. [DOI] [PMC free article] [PubMed] [Google Scholar]
- Cymerblit-Sabba A, Schiller Y. Network dynamics during development of pharmacologically induced epileptic seizures in rats in vivo. J Neurosci. 2010;30:1619–1630. doi: 10.1523/JNEUROSCI.5078-09.2010. [DOI] [PMC free article] [PubMed] [Google Scholar]
- Dan Y, Poo MM. Spike timing-dependent plasticity: from synapse to perception. Physiol Rev. 2006;86:1033–1048. doi: 10.1152/physrev.00030.2005. [DOI] [PubMed] [Google Scholar]
- Fisher RS, van Emde Boas W, Blume W, Elger C, Genton P, Lee P, Engel J., Jr Epileptic seizures and epilepsy: definitions proposed by the International League Against Epilepsy (ILAE) and the International Bureau for Epilepsy (IBE) Epilepsia. 2005;46:470–472. doi: 10.1111/j.0013-9580.2005.66104.x. [DOI] [PubMed] [Google Scholar]
- Grenier F, Timofeev I, Steriade M. Neocortical very fast oscillations (ripples, 80–200 Hz) during seizures: intracellular correlates. J Neurophysiol. 2003;89:841–852. doi: 10.1152/jn.00420.2002. [DOI] [PubMed] [Google Scholar]
- Hakami T, McIntosh A, Todaro M, Lui E, Yerra R, Tan KM, French C, Li S, Desmond P, Matkovic Z, O'Brien TJ. MRI-identified pathology in adults with new-onset seizures. Neurology. 2013;81:920–927. doi: 10.1212/WNL.0b013e3182a35193. [DOI] [PubMed] [Google Scholar]
- Harrison MT. Accelerated spike resampling for accurate multiple testing controls. Neural Comput. 2013;25:418–449. doi: 10.1162/NECO_a_00399. [DOI] [PubMed] [Google Scholar]
- Harrison MT, Geman S. A rate and history-preserving resampling algorithm for neural spike trains. Neural Comput. 2009;21:1244–1258. doi: 10.1162/neco.2008.03-08-730. [DOI] [PMC free article] [PubMed] [Google Scholar]
- Harrison MT, Amarasingham A, Truccolo W. Spatio-temporal conditional inference and hypothesis tests for neural ensemble spiking precision. Neural Comput. 2014 doi: 10.1162/NECO_a_00681. in press. [DOI] [PMC free article] [PubMed] [Google Scholar]
- Hochberg LR, Serruya MD, Friehs GM, Mukand JA, Saleh M, Caplan AH, Branner A, Chen D, Penn RD, Donoghue JP. Neuronal ensemble control of prosthetic devices by a human with tetraplegia. Nature. 2006;442:164–171. doi: 10.1038/nature04970. [DOI] [PubMed] [Google Scholar]
- Jarvis MR, Mitra PP. Sampling properties of the spectrum and coherency of sequences of action potentials. Neural Comput. 2001;13:717–749. doi: 10.1162/089976601300014312. [DOI] [PubMed] [Google Scholar]
- Jaynes ET. Information theory and statistical mechanics. Phys Rev. 1957;106:620–679. doi: 10.1103/PhysRev.106.620. [DOI] [Google Scholar]
- Jaynes ET. On the rationale of maximum-entropy methods. Proc IEEE. 1982;70:939–952. doi: 10.1109/PROC.1982.12425. [DOI] [Google Scholar]
- Jiruska P, de Curtis M, Jefferys JG, Schevon CA, Schiff SJ, Schindler K. Synchronization and desynchronization in epilepsy: controversies and hypotheses. J Physiol. 2013;591:787–797. doi: 10.1113/jphysiol.2012.239590. [DOI] [PMC free article] [PubMed] [Google Scholar]
- Keller CJ, Truccolo W, Gale JT, Eskandar E, Thesen T, Carlson C, Devinsky O, Kuzniecky R, Doyle WK, Madsen JR, Schomer DL, Mehta AD, Brown EN, Hochberg LR, Ulbert I, Halgren E, Cash SS. Heterogeneous neuronal firing patterns during interictal epileptiform discharges in the human cortex. Brain. 2010;133:1668–1681. doi: 10.1093/brain/awq112. [DOI] [PMC free article] [PubMed] [Google Scholar]
- Kramer MA, Eden UT. Assessment of cross-frequency coupling with confidence using generalized linear models. J Neurosci Methods. 2013;220:64–74. doi: 10.1016/j.jneumeth.2013.08.006. [DOI] [PMC free article] [PubMed] [Google Scholar]
- Kramer MA, Eden UT, Kolaczyk ED, Zepeda R, Eskandar EN, Cash SS. Coalescence and fragmentation of cortical networks during focal seizures. J Neurosci. 2010;30:10076–10085. doi: 10.1523/JNEUROSCI.6309-09.2010. [DOI] [PMC free article] [PubMed] [Google Scholar]
- Kramer MA, Truccolo W, Eden UT, Lepage KQ, Hochberg LR, Eskandar EN, Madsen JR, Lee JW, Maheshwari A, Halgren E, Chu CJ, Cash SS. Human seizures self-terminate across spatial scales via a critical transition. Proc Natl Acad Sci U S A. 2012;109:21116–21121. doi: 10.1073/pnas.1210047110. [DOI] [PMC free article] [PubMed] [Google Scholar]
- Kumar A, Rotter S, Aertsen A. Spiking activity propagation in neuronal networks: reconciling different perspectives on neural coding. Nat Rev Neurosci. 2010;11:615–627. doi: 10.1038/nrn2886. [DOI] [PubMed] [Google Scholar]
- Martignon L, Deco G, Laskey K, Diamond M, Freiwald W, Vaadia E. Neural coding: higher-order temporal patterns in the neurostatistics of cell assemblies. Neural Comput. 2000;12:2621–2653. doi: 10.1162/089976600300014872. [DOI] [PubMed] [Google Scholar]
- Miller J, Harrison M. Exact sampling and counting for fixed-margin matrices. Ann Stat. 2013;41:1569–1592. doi: 10.1214/13-AOS1131. [DOI] [Google Scholar]
- Mitra PP, Pesaran B. Analysis of dynamic brain imaging data. Biophys J. 1999;76:691–708. doi: 10.1016/S0006-3495(99)77236-X. [DOI] [PMC free article] [PubMed] [Google Scholar]
- Mormann F, Kreuz T, Andrzejak RG, David P, Lehnertz K, Elger CE. Epileptic seizures are preceded by a decrease in synchronization. Epilepsy Res. 2003;53:173–185. doi: 10.1016/S0920-1211(03)00002-0. [DOI] [PubMed] [Google Scholar]
- Netoff TI, Schiff SJ. Decreased neuronal synchronization during experimental seizures. J Neurosci. 2002;22:7297–7307. doi: 10.1523/JNEUROSCI.22-16-07297.2002. [DOI] [PMC free article] [PubMed] [Google Scholar]
- Okun M, Yger P, Marguet SL, Gerard-Mercier F, Benucci A, Katzner S, Busse L, Carandini M, Harris KD. Population rate dynamics and multineuron firing patterns in sensory cortex. J Neurosci. 2012;32:17108–17119. doi: 10.1523/JNEUROSCI.1831-12.2012. [DOI] [PMC free article] [PubMed] [Google Scholar]
- Oram MW, Hatsopoulos NG, Richmond BJ, Donoghue JP. Excess synchrony in motor cortical neurons provides redundant direction information with that from coarse temporal measures. J Neurophysiol. 2001;86:1700–1716. doi: 10.1152/jn.2001.86.4.1700. [DOI] [PubMed] [Google Scholar]
- Perucca P, Dubeau F, Gotman J. Intracranial electroencephalographic seizure-onset patterns: effect of underlying pathology. Brain. 2014;137:183–196. doi: 10.1093/brain/awt299. [DOI] [PubMed] [Google Scholar]
- Schevon CA, Ng SK, Cappell J, Goodman RR, McKhann G, Jr, Waziri A, Branner A, Sosunov A, Schroeder CE, Emerson RG. Microphysiology of epileptiform activity in human neocortex. J Clin Neurophysiol. 2008;25:321–330. doi: 10.1097/WNP.0b013e31818e8010. [DOI] [PMC free article] [PubMed] [Google Scholar]
- Schevon CA, Trevelyan AJ, Schroeder CE, Goodman RR, McKhann G, Jr, Emerson RG. Spatial characterization of interictal high frequency oscillations in epileptic neocortex. Brain. 2009;132:3047–3059. doi: 10.1093/brain/awp222. [DOI] [PMC free article] [PubMed] [Google Scholar]
- Schevon CA, Weiss SA, McKhann G, Jr, Goodman RR, Yuste R, Emerson RG, Trevelyan AJ. Evidence of an inhibitory restraint of seizure activity in humans. Nat Commun. 2012;3:1060. doi: 10.1038/ncomms2056. [DOI] [PMC free article] [PubMed] [Google Scholar]
- Singer W. Dynamic formation of functional networks by synchronization. Neuron. 2011;69:191–193. doi: 10.1016/j.neuron.2011.01.008. [DOI] [PubMed] [Google Scholar]
- Staba RJ, Bragin A. High-frequency oscillations and other electrophysiological biomarkers of epilepsy: underlying mechanisms. Biomark Med. 2011;5:545–556. doi: 10.2217/bmm.11.72. [DOI] [PMC free article] [PubMed] [Google Scholar]
- Steriade M. Interneuronal epileptic discharges related to spike-and-wave cortical seizures in behaving monkeys. Electroencephalogr Clin Neurophysiol. 1974;37:247–263. doi: 10.1016/0013-4694(74)90028-5. [DOI] [PubMed] [Google Scholar]
- Steriade M, Contreras D. Spike-wave complexes and fast components of cortically generated seizures. I. Role of neocortex and thalamus. J Neurophysiol. 1998;80:1439–1455. doi: 10.1152/jn.1998.80.3.1439. [DOI] [PubMed] [Google Scholar]
- Timofeev I, Steriade M. Neocortical seizures: initiation, development and cessation. Neuroscience. 2004;123:299–336. doi: 10.1016/j.neuroscience.2003.08.051. [DOI] [PubMed] [Google Scholar]
- Traub RD, Contreras D, Cunningham MO, Murray H, LeBeau FE, Roopun A, Bibbig A, Wilent WB, Higley MJ, Whittington MA. Single-column thalamocortical network model exhibiting gamma oscillations, sleep spindles, and epileptogenic bursts. J Neurophysiol. 2005;93:2194–2232. doi: 10.1152/jn.00983.2004. [DOI] [PubMed] [Google Scholar]
- Trevelyan AJ, Sussillo D, Watson BO, Yuste R. Modular propagation of epileptiform activity: evidence for an inhibitory veto in neocortex. J Neurosci. 2006;26:12447–12455. doi: 10.1523/JNEUROSCI.2787-06.2006. [DOI] [PMC free article] [PubMed] [Google Scholar]
- Truccolo W, Friehs GM, Donoghue JP, Hochberg LR. Primary motor cortex tuning to intended movement kinematics in humans with tetraplegia. J Neurosci. 2008;28:1163–1178. doi: 10.1523/JNEUROSCI.4415-07.2008. [DOI] [PMC free article] [PubMed] [Google Scholar]
- Truccolo W, Donoghue JA, Hochberg LR, Eskandar EN, Madsen JR, Anderson WS, Brown EN, Halgren E, Cash SS. Single-neuron dynamics in human focal epilepsy. Nat Neurosci. 2011;14 doi: 10.1038/nn.2782. 635:641. [DOI] [PMC free article] [PubMed] [Google Scholar]
- Worrell GA, Parish L, Cranstoun SD, Jonas R, Baltuch G, Litt B. High-frequency oscillations and seizure generation in neocortical epilepsy. Brain. 2004;127:1496–1506. doi: 10.1093/brain/awh149. [DOI] [PubMed] [Google Scholar]
- Worrell GA, Gardner AB, Stead SM, Hu S, Goerss S, Cascino GJ, Meyer FB, Marsh R, Litt B. High-frequency oscillations in human temporal lobe: simultaneous microwire and clinical macroelectrode recordings. Brain. 2008;131:928–937. doi: 10.1093/brain/awn006. [DOI] [PMC free article] [PubMed] [Google Scholar]