

Abstract
Leptin is well known for its role in the regulation of energy homeostasis in adults, a mechanism that at least partially results from the inhibition of the activity of NPY/AgRP/GABA neurons (NAG) in the arcuate nucleus of the hypothalamus (ARH). During early postnatal development in the rodent, leptin promotes axonal outgrowth from ARH neurons, and preautonomic NAG neurons are particularly responsive to leptin's trophic effects. To begin to understand how leptin could simultaneously promote axonal outgrowth from and inhibit the activity of NAG neurons, we characterized the electrochemical effects of leptin on NAG neurons in mice during early development. Here, we show that NAG neurons do indeed express a functional leptin receptor throughout the early postnatal period in the mouse; however, at postnatal days 13–15, leptin causes membrane depolarization in NAG neurons, rather than the expected hyperpolarization. Leptin action on NAG neurons transitions from stimulatory to inhibitory in the periweaning period, in parallel with the acquisition of functional ATP-sensitive potassium channels. These findings are consistent with the idea that leptin provides an orexigenic drive through the NAG system to help rapidly growing pups meet their energy requirements.
Keywords: arcuate nucleus, development, KATP channels, leptin, mouse, NPY
Introduction
Central circuits regulating food intake develop in response to postnatal cues, which ensure that activity levels are appropriate for the availability of nutrients in the postnatal environment. Neonatal rodents receive all necessary nutrition from suckling until postnatal day (P) 15–16, when they transition to independent ingestion (Swithers, 2003). This shift provides additional energy resources for intensive growth and helps initiate autonomic ingestive behavior needed for successful weaning. It has been demonstrated that several hypothalamic circuits that regulate energy balance are formed during the postnatal period (Bouret, 2013), indicating that there are likely long-lasting effects of the postnatal environment on the control of energy expenditure later in life. In the arcuate nucleus of the hypothalamus (ARH), neurons coexpressing neuropeptide Y (NPY), agouti-related peptide (AgRP), and GABA are orexigenic and are sufficient to regulate direct food intake (denoted collectively as NAG neurons) (Aponte et al., 2011, 2012; Krashes et al., 2013). Separate populations of ARH neurons express the POMC peptide and are anorexigenic (Cowley et al., 2001). Both NAG and POMC neuronal activity are regulated by peripheral hormones, such as leptin (Myers et al., 2008).
Leptin is a homeostatic signal from adipose tissue, which acts at least partially in ARH and is known to control energy homeostasis and decrease food intake. NAG neurons are inhibited by leptin through the activation of ATP-sensitive potassium channels (KATP) via phosphoinositide-3-kinase (PI3-K) (Spanswick et al., 1997; van den Top et al., 2004). In contrast, leptin signaling in POMC neurons leads to increased neuronal activity and augments the synthesis of POMC peptides (Mizuno et al., 1998; Cowley et al., 2001). The regulation of hypothalamic neurons by leptin in neonatal rodents appears to be different from that observed in adults. Leptin levels are 2–3 times higher during the second postnatal week than in adults (Ahima and Hileman, 2000), yet there is no evidence to suggest that leptin modulates food intake or energy expenditure at this early stage (Ahima and Hileman, 2000). Indeed, leptin does not acquire its expected anorectic effect until the fourth week of postnatal life (Mistry et al., 1999), when projections from NAG and POMC neurons are fully developed (Bouret et al., 2004a; Grove et al., 2005).
Leptin can directly activate its receptor in NAG neurons and promotes axonal outgrowth via p-Stat3 at P15 (Draper et al., 2010; Bouret et al., 2012). Because robust energy intake is important for normal growth and development, it seems counterintuitive that the postnatal leptin surge would simultaneously promote axonal outgrowth and inhibit neuronal activity in NAG neurons. In the present study, we investigated the direct effect of leptin on NAG neurons during the first 4 weeks of postnatal life. We also fully characterized the expression pattern of functional leptin receptors in NAG and POMC neurons throughout development. Our results support the hypothesis that leptin activates a subpopulation of NAG neurons in immature animals, which generates an orexigenic drive to support rapid growth and development.
Materials and Methods
Animals.
NPY-hrGFP and (Rosa)26sor-tomato (TOM) mice were purchased from The Jackson Laboratory. Leptin receptor (Lepr)-Cre mice were provided by Dr. M.G. Myers (Leshan et al., 2006). All animals were group housed under a 12 h light-dark cycle, and food and water were available ad libitum. Litters were from 6 to 9 pups, and mice were weaned at P21. Only males were used in our studies after weaning. The Oregon Health & Science University Institutional Animal Care and Use Committee or University of Columbia Institutional Animal Care and Use Committee approved all experiments.
Immunohistochemistry.
Mice received an intraperitoneal injection of either leptin (4 mg/kg) or 0.9% NaCl and were kept for 45 min in the cage. Pups from P10–P15 were injected after being removed from their dam. P25 and older mice were fasted overnight before being injected. Mice were then sedated with Avertin (2.5 mg/10 g, Sigma) and perfused with 4% PFA in 0.1 m phosphate (PB) buffer. Brains were removed and postfixed overnight at 4°C, then cryoprotected with 30% sucrose in PB buffer. Cryoprotected tissue was embedded in OCT (Tissue Tek) and frozen at −80°C. The 10-μm-thick coronal sections were collected on slides, and quantitative analyses were performed on 4–6 sections that spanned −1.055 mm to −2.055 mm from bregma (Allen Mouse Brain Atlas; http://mouse.brain-map.org). For young pups, anatomical landmarks, such as the hippocampus and optic tract, were used to choose sections from an equivalent region. In all graphs, counts are expressed per hemisection.
Primary antibody incubation for p-Stat3 and c-Fos was conducted as previously reported (Padilla et al., 2012). Briefly, brain sections were incubated in rabbit anti-phospho-Stat3 (1:500, Cell Signaling Technology, #913) and rabbit anti-cFos (1:500, Calbiochem, #PC38) overnight at 4°C. Secondary antibodies were goat anti-rabbit-Cy3 (1:500, Jackson ImmunoResearch Laboratories, #115-165-205) or goat anti-rabbit Cy5 (1:200, Jackson ImmunoResearch Laboratories, #711-175-152). Before mounting (VectaShield #H-1400), sections were incubated with DAPI (1:500) for 10 min.
FISH.
Frozen sections were processed with TSA Plus Cy3 system (PerkinElmer) following the manufacturer's instructions. Antisense digoxigenin-labeled riboprobes were generated from plasmids containing PCR fragments of NPY 5′-TGCTAGGTAACAAGCGAATGG-3′/5′-AACAACAACAAGGGAAATGG-3, and POMC 5′-TTAAGAGCAGTGACTAAGAGAGGC-3′/5′-CCTAACACAGGTAACTCAAGAGGC-3′. Images and quantification were performed with a well-established technique (Padilla et al., 2010). Briefly, fluorescent microscopy was performed using a Nikon Eclipse 80i equipped with a Retiga EXi camera and X-Cite 120 fluorescent illumination system. TIFF files were acquired using Q Capture Pro software (Qimaging) and analyzed using Adobe Photoshop CS5. Before the FISH protocol, sections were stained with DAPI and imaged for fluorescent markers. Using Photoshop, pre- and post-FISH images were aligned using the DAPI as a reference to generate a composite image. Cells were counted in Photoshop, and fluorescent markers that did not have a corresponding DAPI-stained nucleus were excluded from our counts.
Generation of leptin receptor (Lepr)-Cre:tdtomato(TOM) reporter mice.
Rosa26sor-tomato mice were crossed with the Lepr-Cre mice to create a fluorescence marker of leptin receptors in ARH during postnatal development. To elucidate the efficiency of the TOM (red fluorescence) expression under the control of leptin receptor in ARH, we performed immunohistochemistry for p-Stat3 in the Lepr-TOM mice at P5, P15, P25, and adult (see Fig. 1A,B).
Figure 1.

Comparison of reagents used to characterize leptin-sensitive neurons in the ARH during postnatal development. A, Colocalization (yellow) of Lepr-Cre;Rosa-TOM (red) and leptin-induced p-Stat3+ immunoreactivity (green) in the ARH. B, Quantification of ARH neurons that are TOM and/or p-Stat3-positive. C, Representative image of NPY-GFP+ (green), Lepr-Cre;Rosa-TOM+ (red), and Pomc-FISH+ (blue) neurons at P25. Inset, Colocalizations between NPY-GFP+ and Lepr-Cre;Rosa-TOM+ (yellow), Pomc-FISH+ and Lepr-Cre;Rosa-TOM+ (magenta). There is no colocalization between NPY-GFP+ (green) and Pomc-FISH+ (blue). D, Quantification of colocalization of NPY-GFP and NPY-FISH signals (left) and POMC-GFP and Pomc-FISH signals in the postnatal period on NPY-GFP and POMC-GFP mice, respectively. Error bars indicate mean ± SEM, 4–6 sections per animal from 3 or 4 mice per age.
Electrophysiology.
All recordings were performed in ARH NPY-GFP+ neurons at the following ages: P13–P15, P21–P23, P25–P27, P30, and adult. Coronal slices containing ARH were prepared as previously described (Qiu et al., 2010). Briefly, brain slices (250–300 μm) containing ARH were maintained with constant flow (1–2 ml/min) of aCSF containing the following (in mm): 124 NaCl, 5 KCl, 2.6 NaH2PO4, 2 MgSO4, 1 CaCl2, 10 HEPES, 10 glucose; oxygenated (95% O2, 5% CO2) osmolarity ∼300 at 32°C–33°C. Murine leptin (100 nm) was made up in aCSF (PeproTech). TTX was prepared from a 2 mm stock solution (Alomone Labs). Tolbutamide was prepared from a stock solution of 1 m (Sigma).
For current-clamp experiments, microelectrodes had resistances of 3–6 mΩ and were filled with an internal solution containing the following (in mm): 125 K-gluconate, 2 KCl, 10 EGTA 5 HEPES, 1 ATP, 0.3 GTP; pH 7.25 with KOH, osmolarity ∼295 mosmM. Data acquisition was performed using a multiclamp 700B amplifier (Molecular Devices). Data were filtered at 3 KHz and sampled at 5–10 KHz using a computer interface Digidata 1322 and pClamp 9.2 software (Molecular Devices). The liquid junction potential of 5 mV was corrected in the analysis.
RT-PCR for KATP gene expression in ARH.
Micropunches containing ARH were obtained from P13–P15, P21–P23, P25–P27, P30, and adults. cDNA was isolated using M-MLV reverse transcriptase (Promega). The following primer pairs were designed to amplify Kir 6.1: forward 5′-GCACACAAGAACATCCGAGA-3′, reverse 5′-GGCTGAAAATCAGCGTCTCT-3′; Kir 6.2: forward 5′-CAAGATGCACTTCAGGCAAA-3′, reverse 5′-GTCACAGGTGGGAGGCTTTA-3′; SUR1: forward 5′-TTCTGCAGCCCTTCGTGAAT-3′, reverse 5′-GCTTGCAGGAACGTCCTTTG-3′; SUR2: forward 5′-GGAGACCAAACTGAAATCGG-3′, reverse 5′-TGCGTCACAAGAACAACCG-3′; and AgRP: forward 5′-GGCCTCAAGAAGACAACTGC-3′, reverse 5′-TGCGACTACAGAGGTTCGTG-3′. PCR was performed with a primer final concentration of 200 nm. The 25 μl reactions were incubated at 94°C for 3 min, 35 cycles of amplification at 94°C for 30 s, 60°C for 1 min, and 72°C for 3 min, with a final extension step of 7 min at 72°C. PCR products were visualized in an ethidium bromide-stained agarose gel (1.5%). All PCR products were sequenced using an automated DNA Sequencer ABI 3730 XL (Applied Bioscience). Partial sequences for each product were examined using the BLAST 2.0 search engine (National Center for Biotechnology Information).
Data analysis.
All data are expressed as mean ± SEM. Statistical comparisons were performed using paired, unpaired t tests, two-way ANOVA, and ANOVA as appropriate. Bonferroni correction and Tukey's test were used for post hoc analysis; p < 0.05 was considered significant.
Results
Ontogeny of leptin-sensing neurons in ARH
To characterize the temporal pattern of leptin receptor expression in ARH neurons, we used (Lepr)-Cre:tdtomato(TOM) reporter mice (Leshan et al., 2006), as well as leptin-induced p-Stat3 immunohistochemistry (Fig. 1A,B). Through the first 2 weeks of postnatal development, there is a delay in the appearance of Lepr-TOM+pSTAT3+ double-positive cells relative to TOM+ or P-STAT3+ cells (Fig. 1A). Between P15 and 25, the number of double-positive cells (TOM/p-Stat3) increased from 30 to 50 per hemisection. In adults, we detected the expression of TOM reporter in 70% of p-STAT3+ ARH neurons, which is consistent with previous reports (Scott et al., 2009; Caron et al., 2010). As there is a close correspondence between cells that express an NPY-GFP reporter and Npy transcripts detected by FISH, these techniques were used interchangeably to mark NAG neurons (Fig. 1C,D). For analyses of POMC neurons, we exclusively relied on Pomc-FISH because we observed transient mismatch between POMC-GFP and Pomc-FISH throughout the first 4 weeks of life (Fig. 1D). For example, ∼30–40% of POMC-GFP neurons coexpress detectable levels of Pomc mRNA at P15. This mismatch is consistent with a previous analysis of embryonic POMC-GFP+ neurons (Padilla et al., 2012).
We characterized the acquisition of the Lepr-Cre lineage trace in both NAG and POMC neurons across the postnatal period (Fig. 2A). Throughout the first 2 postnatal weeks, the percentage of Lepr-TOM colocalization with NAG neurons stayed consistent, ranging between 40% and 50%. In contrast, the colocalization of Lepr-TOM in POMC-expressing neurons during this stage was <10%–20%. By the end of the third postnatal week, colocalization of Lepr-TOM with both NAG and Pomc mRNA increased dramatically (75% and 78%, respectively; Fig. 2B). In the adult, colocalization of Lepr-TOM with NAG and Pomc-expressing neurons was ∼70% and 65%, respectively (Fig. 2B). Similar findings in ARH of adults have been reported by others (Baskin et al., 1999). Together, our results indicate that, during the early postnatal period, leptin's primary actions in ARH are on NAG neurons, and not POMC neurons.
Figure 2.
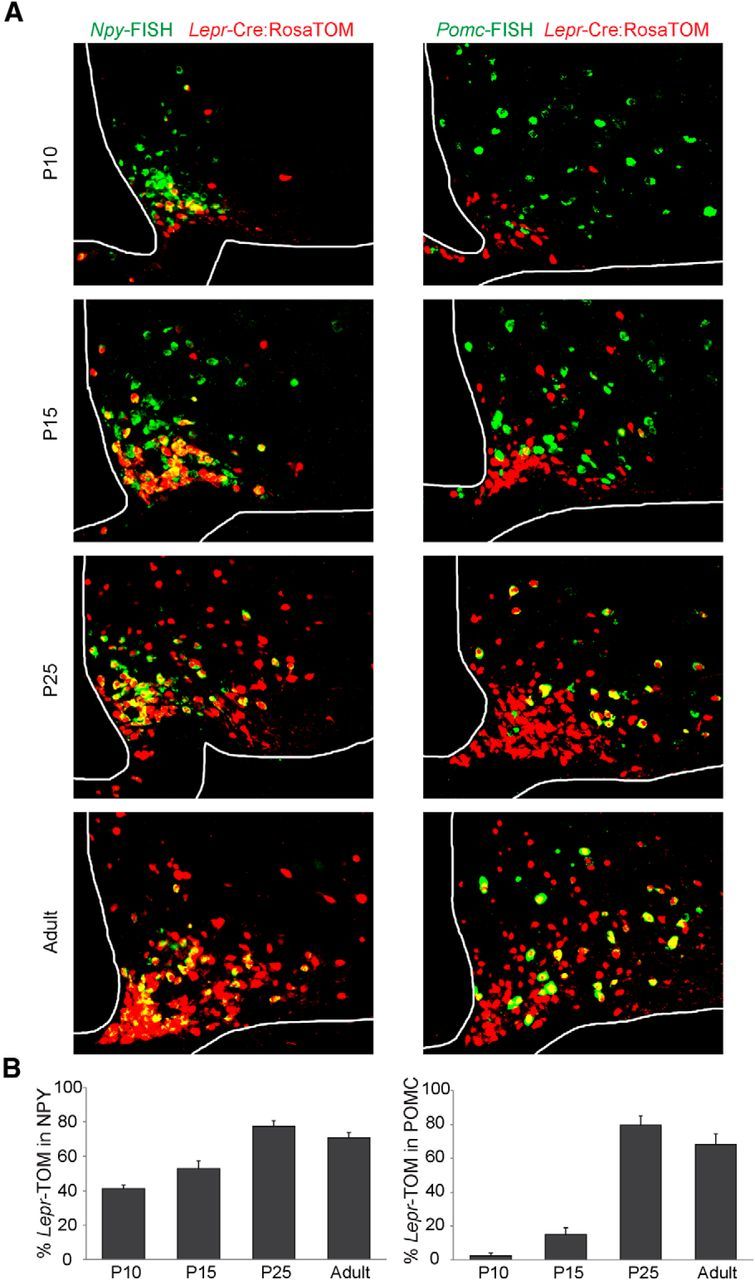
Ontogeny of leptin-sensing neurons in ARH. A, Representative images showing colocalization (yellow) of Npy-FISH (green, left panels) and Pomc-FISH (green, right panels) in ARH Lepr-TOM+ neurons (red). B, Quantification of the percentage of NPY+ (left) and Pomc+ (right) neurons that coexpress Lepr-Cre;Rosa-TOM from P5 through adult. Error bars indicate mean ± SEM; n = 3–6 sections per animal from 3 or 4 mice per age.
Leptin activates NAG neurons in ARH during development
Because leptin is reported to transduce p-Stat3 signals in ARH from P5 (Frontini et al., 2008), we next investigated the ability of exogenous leptin to activate its downstream signaling cascade in NAG neurons during postnatal development. Through P10, leptin induced p-Stat3-immunoreactivity (ir) in relatively few cells, most of which were NPY-GFP+ (Fig. 3C; n = 4–6 sections, 3 or 4 animals, p > 0.05, two-way ANOVA with Bonferroni correction revealed a significant increase in pStat3 expression by leptin injection, F(1,20) = 27.65, p < 0.0001, and was used for all ages in this figure). Between P10 and P15, the percentage of p-Stat3-ir NAG neurons that responded to leptin increased from 15% to 35% (Fig. 3A,C; n = 4–6 sections, 3 or 4 animals, t(20) = 3.3, p < 0.05). These results are consistent with previous studies from our group (Draper et al., 2010). Through the third and fourth weeks of life, the percentage of p-Stat3 colocalization with NAG neurons remained consistent, ranging from 35% to 40% (n = 4–6 sections, 3 or 4 animals, t(20) = 3.4, p < 0.05). This was similar to expression in adults where the percentage of p-Stat3 colocalization with NAG was ∼40% (Fig. 3C; n = 4–6 sections, 3 or 4 animals, t(20) = 3.1, p < 0.05).
Figure 3.
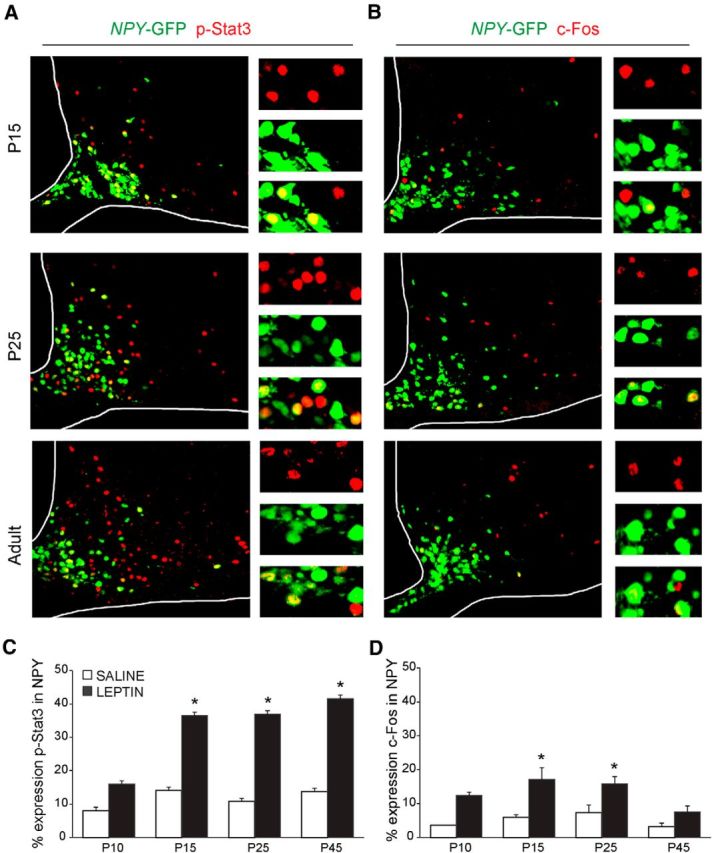
Exogenous leptin activates NAG neurons during development. Representative images of leptin-induced p-Stat3 (red) (A) and c-Fos (red) (B) expression in NPY-GFP+ neurons (green). Insets, Colocalization. Quantification of p-Stat3 (C) and c-Fos (D) immunoreactivity in ARH NPY-GFP+ neurons after intraperitoneal injection of saline or leptin (4 mg/kg) at several ages. Error bars indicate mean ± SEM from 4–6 sections per animal, 3 or 4 mice per age. *p < 0.05 (two-way ANOVA, post hoc Bonferroni correction).
Throughout postnatal development, young animals need to maximize food intake to support rapid growth. Given our results from both colocalization and p-Stat3 studies, we tested the hypothesis that exogenous leptin may be able to induce changes in c-Fos expression (a marker of cell activation) in NAG neurons to stimulate energy consumption. Indeed, we observed that, during the first 2 weeks of life, leptin induced c-Fos-ir in 15%–20% of NAG neurons (Fig. 3B,D; n = 4–6 sections, 2–5 animals, P10, p > 0.05, P15, t(19) = 4.1, p < 0.01, two-way ANOVA with Bonferroni correction revealed a significant increase in c-Fos expression by leptin injection, F(1,19) = 27.78, p < 0.0001, this analysis was used for all ages in Fig. 3D). The percentage of c-Fos colocalization with NAG neurons remained consistent ranging from 15% to 20% by the end of the third week (n = 4–6 sections, 2–5 animals, t(19) = 2.8, p < 0.05), which corresponds with the initiation of autonomic feeding behavior. As animals reached adulthood, c-Fos expression in NAG neurons was low (Fig. 3B,D; n = 4–6 sections, 2–5 animals, p > 0.05), consistent with the well-established inhibitory effects of leptin on these neurons in adults (van den Top et al., 2004).
Differential actions of leptin on NAG neurons during development
There is a vast amount of literature regarding the role of leptin in energy homeostasis during postnatal development (Grove et al., 2005; Bouret, 2013). However, the ability of leptin to inhibit food intake does not become evident until P28 (Mistry et al., 1999). Because NAG neurons are considered orexigenic, we examined the role of leptin to acutely regulate NPY-GFP+ neuronal activity in ARH during postnatal development. Although our immunohistochemistry studies showed evidence that leptin activates p-Stat3 as early as P10, we chose to begin our electrophysiological studies at P13–P15 because this is when pups initiate independent food intake (Swithers, 2003). All recordings were performed in acute coronal brain slices containing ARH at the following ages: P13–P15, P21–P23, P25–P27, P30, and adult (P60–P90). A maximum effective dose of leptin 100 nm was used for all experiments (Cowley et al., 2001). In current-clamp mode, NPY-GFP neurons from P13–P15 mice showed membrane depolarization in the presence of leptin. The magnitude of the depolarization was 5.9 ± 0.4 mV in ∼55% of neurons tested (Fig. 4A; n = 31 cells, 26 animals, t(8) = 12.2, p < 0.0001, paired t test), consistent with the percentage of NPY-GFP neurons that coexpress the Lepr-Cre TOM lineage trace (Fig. 2B). Moreover, we did not observe leptin-mediated inhibition of NAG neurons at this age.
Figure 4.

Leptin activates NAG neurons during postnatal development. Representative traces from brain slices from NPYhrGFP mouse containing ARH. A, Neurons at P13–P15 showed membrane depolarization in the presence of leptin 100 nm; 17 of 31 neurons from 26 animals responded to leptin treatment. B, Leptin 100 nm has dual actions in the membrane potential of neurons between P21 and P23 either leads to depolarization or hyperpolarization. Leptin treatment leads to membrane depolarization in 5 of 12 neurons from 12 animals. In contrast, 3 of 12 neurons were inhibited by leptin. Black-white lines indicate the RMP (resting membrane potential). Bar graphs represent the magnitude of leptin responses in neurons for each age. Dashed line graphs represent changes in membrane potential for individual neurons that were sensitive to leptin 100 nm at each age tested. Results are mean ± SEM. *p < 0.05 (paired t test). ***p < 0.001 (paired t test). ****p < 0.0001 (paired t test).
At P21, when pups are capable of maintaining independent food intake (Swithers, 2003), we observed that leptin induced two different functional responses on NAG neurons. First, leptin caused membrane depolarization (6.9 ± 0.5 mV) in 41% of ARH NPY-GFP+ neurons (5 of 12 cells, 12 animals, t(4) = 11.6, p = 0.0003, paired t test). Second, leptin caused membrane hyperpolarization (7.8 ± 1.4 mV) in 25% of ARH NPY-GFP+ neurons (Fig. 4B; 3 of 12 cells, 12 animals, t(2) = 5.4, p = 0.0316, paired t test). Leptin-induced hyperpolarization in NAG neurons, at P21-P23, exhibited the same electrical properties produced by leptin actions in adult NAG neurons (Spanswick et al., 1997). Furthermore, it is important to note that the differential actions of leptin on NAG neurons were observed in different cells from the same animal. Through the end of the fourth week (P25–P27), leptin continued to induce membrane depolarization (9 ± 0.8 mV) in 26% of NPY-GFP+ neurons (Fig. 5A; 5 of 19 cells, 12 animals, t(4) = 11, p = 0.0004, paired t test). At the same time, we observed that the percentage of ARH NPY-GFP+ neurons that exhibited leptin-mediated membrane hyperpolarization (6.7 ± 1 mV) increased to ∼32% (6 of 19 cells, 12 animals, t(5) = 7.5, p = 0.0007, paired t test). After the fourth week (P30), we found that leptin only causes membrane hyperpolarization (7.5 ± 1.2 mV) in ∼66% of ARH NPY-GFP+ neurons (Fig. 5B; 5 of 8 cells, 4 animals, t = 5.8, df 4 p = 0.0043, paired t test), similar to the level observed in adults. In the adult, leptin-induced membrane hyperpolarization (7.1 ± 0.3 mV) in ∼57% of ARH NPY-GFP+ neurons (Fig. 5C; 12 of 21 cells, 10 animals, t(10) = 22.5, p < 0.0001, paired t test). These results are consistent with well-known inhibitory effects of leptin in adult NAG neurons (van den Top et al., 2004).
Figure 5.

NAG neurons exhibit an adult-like phenotype in the presence of leptin after postnatal day 30. Representative traces from brain slices from NPY-hrGFP mice containing ARH. A, Leptin 100 nm leads to depolarization in 5 of 19 neurons and hyperpolarization in 6 of 19 neurons from 12 animals at P25–P27. B, Leptin causes membrane hyperpolarization and inhibition of spontaneous action potentials in 5 of 8 neurons from 4 animals at P30. C, Leptin 100 nm causes membrane hyperpolarization in 12 of 21 adult neurons from 10 animals. Bar graphs represent the magnitude of leptin responses in neurons for each age. Line graphs represent changes in membrane potential for individual neurons that were sensitive to leptin 100 nm at each age tested. Results are mean ± SEM. **p < 0.01 (paired t test). ***p < 0.001 (paired t test). ****p < 0.0001 (paired t test).
To determine whether leptin-mediated depolarization on NAG neurons during postnatal development is acting at least partially directly on the cell, we evaluated the effects of leptin on the membrane potential of ARH NPY-GFP+ neurons at P13–P15 in the presence of the sodium channel blocker TTX (1 μm). Under these conditions, leptin 100 nm depolarized the membrane potential by 6.4 ± 0.5 mV in ∼45% of neurons (Fig. 6A; 8 of 18 cells, 18 animals, ANOVA with post hoc Tukey's revealed significant changes in membrane potential, F(1.8,13.1) = 67.07, p < 0.0001, resting membrane potential (RMP) vs TTX + leptin, q = 0.6, df 7, p < 0.0001, TTX vs TTX + leptin, q = 12.94, df 7, p < 0.0001). When similar experiments were conducted in adult ARH NPY-GFP+ neurons, we observed that leptin hyperpolarized the membrane potential by 7.1 ± 0.6 mV in ∼45% of the neurons (Fig. 6B; 5 of 11 cells, 7 animals, ANOVA post hoc Tukey's shows significant changes in membrane potential, F(1.3,5.3) = 64.06, p = 0.0003, RMP vs TTX + leptin, q = 5, df 4, p < 0.01, TTX vs TTX + leptin, q = 12.2, df 4, p < 0.001).
Figure 6.

Leptin effects, at least partially, are directly induced in NAG neurons. Representative traces of leptin effects on NAG neurons in the presence of TTX (1 μm). A, Leptin 100 nm leads to membrane depolarization in 8 of 18 neurons from 18 animals at P13–P15 under the presence of TTX (1 μm). B, Leptin 100 nm induces membrane hyperpolarization in 5 of 11 adult neurons in the presence of TTX (1 μm, 7 animals). Bar graphs represent the magnitude of the leptin-induced responses in either pup or adult neurons. Results are mean ± SEM. ****p < 0.0001 (ANOVA, post hoc Tukey's test). ***p < 0.001 (ANOVA, post hoc Tukey's test).
The electrical properties of NAG neurons changed across postnatal development
During the first 2 weeks of life (P13–P15), NAG neurons had an RMP of −56 ± 2.3 mV, and only 47% of the neurons tested exhibited frequent spontaneous action potentials (n = 31 cells, 26 animals). As pups initiated autonomic feeding (P21–P23), NAG neurons exhibited RMP of −54 ± 1 mV and the percentage of NAG neurons that exhibited frequent spontaneous action potentials remained at 50% (n = 12 cells, 14 animals). By the end of the fourth week of life (P25–P27), NAG neurons began to display similar baseline characteristics as adult NAG neurons. The number of ARH NPY-GFP+ neurons exhibiting frequent spontaneous action potentials increased to ∼91%, and the RMP was −57 ± 1.4 (n = 19 cells, 12 animals). After 1 month of age (P30), the percentage of frequent spontaneous action potentials in NPY-GFP+ neurons and the RMP stayed consistent (−56 ± 2 mV, n = 8 cells, 4 animals). In adults, we observed that the RMP was slightly reduced to −52 ± 1 mV, and 90% of ARH NPY-GFP+ neurons fired spontaneous action potentials (n = 21 cells, 10 animals).
Differences in leptin signaling and regulation of NAG neurons during postnatal development
Leptin regulation of NAG neuronal activity is well characterized in adult rodents. Activation of LepRb receptors in NAG neurons by leptin causes membrane hyperpolarization through the phosphorylation of KATP channels via PI3-K (Williams et al., 2009). To examine whether KATP channels are downstream effectors of the leptin signaling cascade during postnatal development, we recorded leptin-mediated responses in ARH NPY-GFP neurons at P13–P15, P25–P27, P30, and adults in the presence of tolbutamide 200 μm, a potent KATP channel antagonist (Spanswick et al., 1997). At P15, when pups initiated ingestion of solid food, 59% of NAG neurons were depolarized by leptin and application of tolbutamide did not alter leptin-mediated membrane depolarization. The magnitude of the depolarization was 6.9 ± 0.9 mV in the presence of leptin and 13.7 ± 2.3 mV in the presence of leptin + tolbutamide (Fig. 7A; 7 of 12 cells, 8 animals, RMP vs Lep, q = 10.7, df 6, p < 0.001, RMP vs Lep + Tol, q = 8.1, df 6, p < 0.01, ANOVA post hoc Tukey's F(1.1,6.7) = 30.11, p = 0009). Given the similarity in responses to leptin between P21–P23 and P25–P27 (Figs. 4B and 5A), we chose P25–P27 for this set of experiments. Current-clamp recordings in ARH NPY-GFP+ neurons at P25–P27 revealed that ∼26% of the leptin-mediated responses caused membrane depolarization of 9 ± 0.8 mV, which were enhanced by the addition of tolbutamide (15.4 ± 2.5 mV, 6 of 19 cells, 12 animals, RMP vs Lep, q = 15.6, df 4, p < 0.001, RMP vs Lep + Tol, q = 8.6, df 4, p < 0.01, ANOVA post hoc Tukey's, F(1,4.1) = 35.04, p = 0.0035). In contrast, leptin inhibited ∼32% of ARH NPY-GFP+ neurons at P25–P27, with membrane hyperpolarization of 6.7 ± 1 mV (5 of 19 cells, 12 animals, RMP vs Lep, q = 10.6, df 5, p < 0.01, RMP vs Lep + Tol, q = 8.6, df 5, p < 0.05, ANOVA post hoc Tukey's, F(1.2,6) = 33.8, p = 0.0009). The presence of tolbutamine blocked the inhibitory effects of leptin, consistent with a role for KATP channels in leptin signaling transduction in NAG neurons at this age (Fig. 7B). By P30, NAG neurons exhibited an adult-like phenotype, with leptin-induced membrane hyperpolarization of 7.4 ± 1.6 mV that was blocked by application of tolbutamide (Fig. 7C; 4 of 7 cells, 4 animals, RMP vs Lep, q = 6.3, df 3, p < 0.05, Lep vs Lep + Tol, q = 6.1, df 3, p < 0.05, ANOVA post hoc Tukey's, F(1.2,3.6) = 17.21, p = 0.01). In summary, we found that tolbutamide blocked the inhibitory effects of leptin on NAG neurons after weaning and in the adult (Figs. 7B,C and 8; for adult only, 3 of 7 cells, 3 animals, RMP vs Lep, q = 13.3, df 2, p < 0.05, RMP vs Lep + Tol, q = 12.7, df 2, p < 0.05, ANOVA post hoc Tukey's, F(1.3,2.7) = 112.5, p = 0.0026), consistent with reports that glucose-responsive neurons in the rat ARH are inhibited by leptin through activation of KATP channels (Spanswick et al., 1997).
Figure 7.

Differences in leptin signaling in NAG neurons during postnatal development. A, Tracing from a P13–P15 neuron showing that leptin-induced depolarization was not changed by a KATP channel blocker (tolbutamide). Leptin induces membrane depolarization in 7 of 12 neurons from 8 animals. B, Leptin effects on neurons were excitatory in 6 of 19 neurons or inhibitory in 5 of 19 neurons at this age (12 animals). Tolbutamide 200 μm completely reversed leptin-induced hyperpolarization. C, Leptin-mediated hyperpolarization at P30 was reverted by tolbutamide treatment. Four of 7 neurons from 4 animals responded to leptin treatment. Dashed line indicates the RMP. Bar graphs represent the magnitude of leptin responses in the absence and presence of tolbutamide. Results are mean ± SEM. *p < 0.05 (ANOVA, post hoc Tukey's). **p < 0.01(ANOVA, post hoc Tukey's). ***p < 0.001 (ANOVA, post hoc Tukey's). Lep, Leptin; Lep+Tol, leptin + tolbutamide.
Figure 8.

Leptin effects in adult mouse NAG neurons are blocked by tolbutamide. Representative trace from an adult neuron showing that leptin-mediated hyperpolarization was blocked by tolbutamide treatment. Three of 7 neurons from 3 animals responded to leptin. Dashed line indicates the RMP. Bar graphs represent the magnitude of leptin responses in the absence and presence of tolbutamide. Results are mean ± SEM. *p < 0.05 (ANOVA, post hoc Tukey's test). Lep, Leptin; Lep+Tol, leptin + tolbutamide.
Acquisition of functional KATP channels in developing NAG neurons
We next examined when NAG neurons begin to express key components of KATP channels. In adults, KATP channels are heteromultimeric protein complexes consisting of two subunits: an inward rectifying K+ channel (Kir6.1 or Kir6.2) and a sulfonylurea receptor (SUR1 or SUR2). All four subunits (Kir6.1, Kir6.2, SUR1, and SUR2) are expressed in the hypothalamus (Karschin et al., 1997; Miki et al., 2001; Ibrahim et al., 2003). To determine whether expression of KATP channels differs with age, we used two approaches to assess KATP channel function, at the same stages: (1) PCR from micro-punches isolated from ARH at P13–P15, P21–P23, P25–P27, P30, and adult; and (2) current-clamp recordings were performed in brain slices containing ARH from a NPY-GFP mice using 50 μm diazoxide, a potent agonist of KATP channels (van den Top et al., 2007).
During the second week of life (P13–P15), we did not detect expression of any KATP channel components in the ARH, and the KATP channel opener diazoxide failed to modify neuronal activity in NAG neurons at this postnatal age (Figs. 9A and 10A; 6 of 6 cells, 6 animals, p = 0.2675, paired t test). At P21–P23, we could detect Kir6.1, Kir6.2, SUR1, and SUR2 expression in ARH (Fig. 9B). At this age, only half of the NAG neurons showed functional KATP channels, and activation of KATP channels by diazoxide treatment led to a subtle membrane hyperpolarization (3.6 ± 1.3 mV; Fig. 10B; 5 of 9 cells, 2 animals, p = 0.2593, paired t test). By the end of the fourth week (P25–P27), the number of functional channels in NAG neurons increased to ∼71%. There was also a 1.75-fold increase in the magnitude of diazoxide effects on NAG neurons (6.3 ± 0.4 mV; Figs. 9C and 10C; 5 of 7 cells, 3 animals, t(4) = 15.2, p = 0.0001, paired t test). After P30, KATP channels in ARH shared similar functional properties with adult NAG neurons (Fig. 9D); 100% of the NPY-GFP+ neurons responded to diazoxide, and the effects were 2.93-fold greater than at P21 (9.1 ± 0.7 mV; Fig. 10D; 7 of 7 cells, 2 animals, t(6) = 11.7, p < 0.0001, paired t test). In adults, all four KATP components were expressed in ARH, and diazoxide caused membrane hyperpolarization in 100% of NAG neurons (5.7 ± 0.7 mV, Figs. 9E and 10E; 6 of 6 cells, 3 animals, t(5) = 9.4, p = 0.0002, paired t test).
Figure 9.

Development of KATP channels in NAG neurons. A–E, RT-PCR mRNA expression for inward rectifying potassium channels subunits Kir6.1 and Kir6.2, the sulfonylurea receptor subunits 1 and 2 (SUR1 and SUR2), and AgRP, in ARH of NPY-hrGFP mice at the following ages: P13–P15, P21–P23, P25–P27, P30, and adult (left). Amplify-stained PCR products of expected sizes (Kir6.1 448 bp, Kir 6.2 256 bp, SUR1 475 bp, SUR2 215 bp, and AgRP 247 bp). −cDNA indicates those in which cDNA was omitted from the PCR. ARH micro-punches were pooled from 4 animals for each age. These experiments were replicated three different times (60 animals). Representative traces from individual age matched neurons in current-clamp mode showing the effects of diazoxide 50 μm (right).
Figure 10.
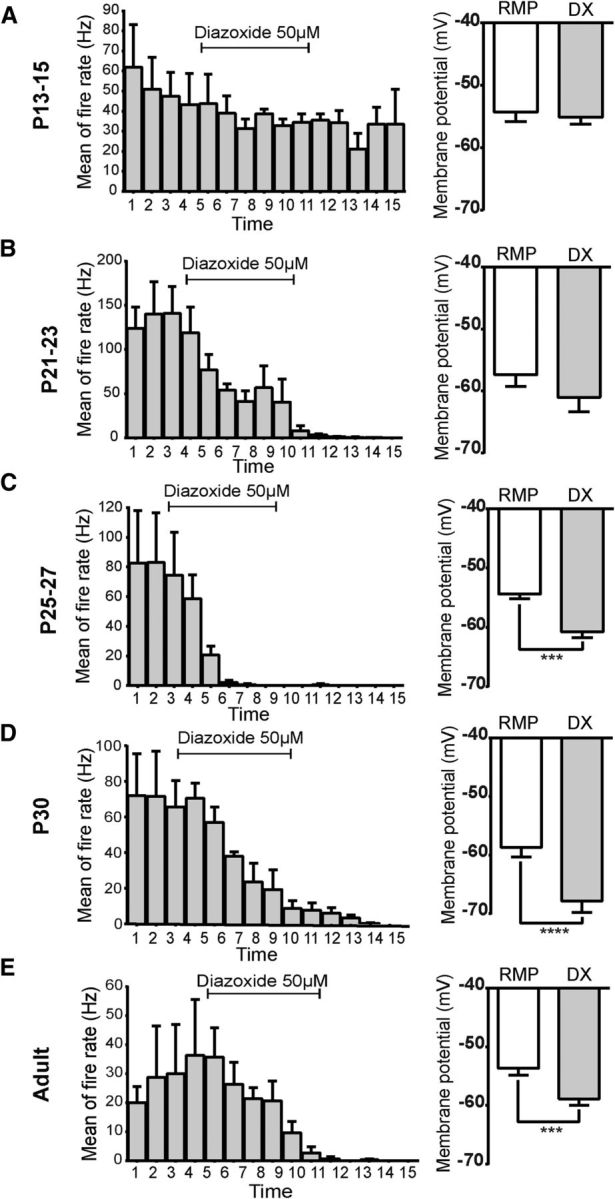
Functional characterization of KATP channels in NAG neurons during postnatal development. A, Diazoxide 50 μm was applied for 6 min and did not change the mean of fire rate or the membrane potential during the entire application in 6 neurons from 6 animals at P13–P15. B–E, Diazoxide-induced responses decreased the fire rate and hyperpolarized the membrane potential of neurons at P21–P23 (5 of 9 neurons, 2 animals), P25–P27 (5 of 7 neurons, 3 animals), P30 (7 neurons, 2 animals), and adults (6 neurons, 3 animals). Bar graphs represent the magnitude of the diazoxide-dependent hyperpolarization in neurons for each age. Results are mean ± SEM. ***p < 0.001 (paired t test). ****p < 0.0001 (paired t test). DX, Diazoxide.
Discussion
In the present study, we examined the ontogeny of leptin receptors in ARH throughout the first 4 weeks of life. During the first 2 weeks of life, we found that most of the LepRb receptors are colocalized with NAG neurons. At this stage, when pups are initiating independent ingestion, we report that: (1) leptin is an excitatory signal to NAG neurons, and (2) NAG neurons do not express functional KATP channels. As the animals progress through the third and fourth postnatal weeks, leptin signaling progressively transitions to the adult phenotype.
Spatial and temporal pattern of leptin receptor expression during postnatal development
Studies from several independent labs demonstrated differences in the regulation of energy balance by leptin between adults and neonates (Mistry et al., 1999; Ahima and Hileman, 2000; Proulx et al., 2002). Our neuroanatomical studies show that, during the first 2 weeks of postnatal life, LepRb expression is limited to the ventral medial portion of ARH and is primarily colocalized with NAG neurons, suggesting that POMC neurons may not yet play a role in energy homeostasis. Consistent with these results, previous studies have shown that Pomc mRNA expression in ARH first increases in the third week of postnatal life (Mann et al., 1999; Ahima and Hileman, 2000). The developmental delay in leptin receptor expression in POMC neurons could, in theory, act to promote the orexigenic drive needed to support the rapid growth of neonates. Moreover, at this age, leptin does not reduce body weight in neonatal rodents (Mistry et al., 1999; Proulx et al., 2002). As young animals reach prepuberty in the fourth week, we observed that the distribution of LepRb in NAG and POMC neurons transitions to the adult phenotype. In this study, a delay in the appearance of Lepr-TOM+pSTAT3+ double-positive cells relative to TOM+ or P-Stat3+ cells could stem from several possible causes. TOM+ cells could represent neurons: (1) in which the downstream Stat3 pathway is not yet activated, (2) that are activated with a different temporal pattern, or (3) that transiently expressed Lepr (Caron et al., 2010). PStat3+ cells could represent neurons: (1) that have low expression of Lepr and thus have not had enough Cre to direct recombination (Scott et al., 2009) or (2) that are activated by other Lepr+ neurons (Zeltser et al., 2012).
Leptin modulates NAG neuronal activity during postnatal development
Although food intake is not regulated by leptin in the neonatal period, previous studies established that leptin acts as a neurotrophic factor for the development of ARH neuronal projections (Bouret et al., 2004b, 2012). Follow-up studies revealed that NAG neurons projecting to the autonomic nervous system are preferentially responsive to leptin signals in the neonatal period (Bouyer and Simerly, 2013). Although it is well established that leptin hyperpolarizes NAG neurons and causes increased energy expenditure in adults (van den Top et al., 2004; Belgardt and Bruning, 2010), here we demonstrated, using both immunohistochemical and electrophysiological approaches, that exogenous leptin can activate NAG neurons during the second week of postnatal life. Leptin induces a significant depolarization in the membrane potential of NAG neurons at P15 and P21–P23, but there was no correlation of spontaneous firing activity under these conditions. In this study, we examined pStat3 activation 45 min after leptin injection. However, there is the possibility of different kinetics of pStat3 activation throughout development, and further studies are needed to investigate this.
Our focus in this work was to investigate the ontogeny of leptin signaling in NAG neurons during postnatal development. The electrophysiological properties of the conductance that causes membrane depolarization in NAG neurons by leptin were not studied. Nevertheless, the depolarizing effects of leptin on NAG neurons during development could be attributed to the lack of functional KATP channels. In general, the opening of KATP channels causes membrane hyperpolarization and reduction of electrical activity. Conversely, inhibition of KATP channels causes the opposite effect, leading to membrane depolarization and increases of electrical activity through an influx of Ca2+ ions via voltage-gated calcium channels (VGCC) (Chapman et al., 1999). Activation of KATP channels by leptin reduces intracellular calcium concentration [Ca2+]i and inhibits VGCC currents in adult NAG neurons (Wang et al., 2008). As NAG neurons express L-type calcium channels, it is possible to speculate that leptin depolarizes neonatal NAG neurons through the activation of transient receptor potential channels (Qiu et al., 2010) and then increases [Ca2+]i through VGCC channels. There was a difference in the membrane potential of leptin-mediated depolarization in the presence of tolbutamide at P13–P15. However, these results were not statistically significant, raising the possibility that tolbutamide could block other ion channels in a nonspecific manner at this age. Our studies using diazoxide support this theory because no changes in the firing rate or membrane potential of NAG neurons at P13-P15 were observed.
Animals initiate autonomic feeding behavior and are weaned at ∼P21. Our results showed that leptin's effects on NAG neurons progressively transition to the adult phenotype after weaning. The percentage of NAG neurons inhibited by leptin (as defined by membrane hyperpolarization) increases from 25% at P21 to 66% by P30. However, according to a previous study, leptin's regulation of food intake is not evident until P28 (Mistry et al., 1999). It is possible that leptin is unable to decrease food intake until hypothalamic circuits are completely developed at the end of the fourth week (Grove et al., 2005). Although our data suggest that functional KATP channels are essential for the ability of leptin to inhibit NAG neurons, further research is needed to clarify the underlying mechanisms for the switch of leptin actions on NAG neurons from stimulatory to inhibitory.
The ontogeny of leptin inhibitory effects on NAG neurons
The importance of KATP channels in the regulation of energy homeostasis is well established (Sohn et al., 2013). Previous studies have shown that KATP channels are expressed in multiple hypothalamic areas, including the ventromedial hypothalamic nucleus, lateral hypothalamic area, and ARH (Ashford et al., 1990; Ibrahim et al., 2003; Wang et al., 2004; Claret et al., 2007). Functional KATP channels consist of four pore-forming subunits Kir6.x (Kir6.1 or Kir6.2) and two regulatory subunits SURx (SUR1, or SUR2) (Hibino et al., 2010). Our PCR studies showed that all four subunits of KATP channels are expressed in ARH after P21. In addition, our electrophysiological studies at this age are consistent with the involvement of Kir6.2 and SUR1 as one of the pore-forming combinations in NAG neurons. However, we cannot rule out that other pore subunit combinations of KATP channels may occur in ARH because we also detected Kir6.1 and SUR2 transcription. Although we have provided the first evidence of leptin-mediated depolarization of NAG neurons, further studies are needed to elucidate the interaction between ATP and KATP channels in NAG neurons during development.
KATP channels are involved in the metabolic effects of leptin in ARH. In adult NAG neurons, acute inhibition of cellular activity by leptin is mediated through the activation of KATP channels via the PI3-K signaling cascade (Myers et al., 2008). Here, we demonstrated that expression of functional KATP channels in ARH does not occur until the end of the third week of life. Consistent with these results, sulfonylurea receptor binding studies in the rat hypothalamus showed that binding levels increased from P21 to P35 and were slightly reduced by P120 (Xia and Haddad, 1991; Xia et al., 1993). In addition, during the first two postnatal weeks in the rodent, leptin levels are 2 or 3 times higher than in the adult (Ahima et al., 1998). However, leptin does not inhibit growth, acute ingestion, or energy expenditure during this period in mice and rats (Grove et al., 2005). Because this is an important growth period, a delay in the expression of KATP channels in the NAG neurons until the end of the third week could act to maximize food consumption needed to support rapid growth.
Implications for understanding how postnatal leptin influences/programs feeding circuits
As the preautonomic subpopulation of NAG neurons is reported to be preferentially sensitive to the neurotrophic effects of leptin in the neonatal period (Bouyer and Simerly, 2013), it is possible that these are the same neurons that we found to be depolarized by leptin. If this is the case, because optogenetic activation of preautonomic NAG neurons is sufficient to direct food intake (Atasoy et al., 2012), it raises the possibility that leptin's actions on these neurons during the postnatal period may generate an orexigenic drive to fuel rapid growth. In agreement with this hypothesis, previous studies reported that administration of leptin at low doses enhances body mass in neonatal rodents (Kraeft et al., 1999; Mistry et al., 1999) and can rescue physiological consequences of maternal undernutrition (Vickers et al., 2005). In contrast, treatment of neonatal rodents with a leptin antagonist was associated with a transient reduction in body weight gain (Attig et al., 2008). Further studies are needed in this area to characterize the effects of leptin as an orexigenic signal during the rapid growth phase of rodents in the preweaning period.
Footnotes
This work was supported by NIH Grants P51 OD011092 Oregon National Primate Research Center, R01 HD014643 to M.S.S., and R01 DK079194 to K.L.G., and R01 DK089038 to L.M.Z.; the Columbia Diabetes and Endocrinology Research Core P30 DK063608; and American Diabetes Association Grant 7-13-MI-06 to A.F.B. and K.L.G., and Grant 7-11-BS-179 to A.J.d.S. and L.M.Z.
The authors declare no competing financial interests.
References
- Ahima RS, Hileman SM. Postnatal regulation of hypothalamic neuropeptide expression by leptin: implications for energy balance and body weight regulation. Regul Pept. 2000;92:1–7. doi: 10.1016/S0167-0115(00)00142-7. [DOI] [PubMed] [Google Scholar]
- Ahima RS, Prabakaran D, Flier JS. Postnatal leptin surge and regulation of circadian rhythm of leptin by feeding: implications for energy homeostasis and neuroendocrine function. J Clin Invest. 1998;101:1020–1027. doi: 10.1172/JCI1176. [DOI] [PMC free article] [PubMed] [Google Scholar]
- Aponte Y, Atasoy D, Sternson SM. AGRP neurons are sufficient to orchestrate feeding behavior rapidly and without training. Nat Neurosci. 2011;14:351–355. doi: 10.1038/nn.2739. [DOI] [PMC free article] [PubMed] [Google Scholar]
- Ashford ML, Boden PR, Treherne JM. Glucose-induced excitation of hypothalamic neurones is mediated by ATP-sensitive K+ channels. Pflugers Arch. 1990;415:479–483. doi: 10.1007/BF00373626. [DOI] [PubMed] [Google Scholar]
- Atasoy D, Betley JN, Su HH, Sternson SM. Deconstruction of a neural circuit for hunger. Nature. 2012;488:172–177. doi: 10.1038/nature11270. [DOI] [PMC free article] [PubMed] [Google Scholar]
- Attig L, Solomon G, Ferezou J, Abdennebi-Najar L, Taouis M, Gertler A, Djiane J. Early postnatal leptin blockage leads to a long-term leptin resistance and susceptibility to diet-induced obesity in rats. Int J Obes (Lond) 2008;32:1153–1160. doi: 10.1038/ijo.2008.39. [DOI] [PubMed] [Google Scholar]
- Baskin DG, Breininger JF, Schwartz MW. Leptin receptor mRNA identifies a subpopulation of neuropeptide Y neurons activated by fasting in rat hypothalamus. Diabetes. 1999;48:828–833. doi: 10.2337/diabetes.48.4.828. [DOI] [PubMed] [Google Scholar]
- Belgardt BF, Bruning JC. CNS leptin and insulin action in the control of energy homeostasis. Ann N Y Acad Sci. 2010;1212:97–113. doi: 10.1111/j.1749-6632.2010.05799.x. [DOI] [PubMed] [Google Scholar]
- Bouret SG. Organizational actions of metabolic hormones. Front Neuroendocrinol. 2013;34:18–26. doi: 10.1016/j.yfrne.2013.01.001. [DOI] [PMC free article] [PubMed] [Google Scholar]
- Bouret SG, Draper SJ, Simerly RB. Formation of projection pathways from the arcuate nucleus of the hypothalamus to hypothalamic regions implicated in the neural control of feeding behavior in mice. J Neurosci. 2004a;24:2797–2805. doi: 10.1523/JNEUROSCI.5369-03.2004. [DOI] [PMC free article] [PubMed] [Google Scholar]
- Bouret SG, Draper SJ, Simerly RB. Trophic action of leptin on hypothalamic neurons that regulate feeding. Science. 2004b;304:108–110. doi: 10.1126/science.1095004. [DOI] [PubMed] [Google Scholar]
- Bouret SG, Bates SH, Chen S, Myers MG, Jr, Simerly RB. Distinct roles for specific leptin receptor signals in the development of hypothalamic feeding circuits. J Neurosci. 2012;32:1244–1252. doi: 10.1523/JNEUROSCI.2277-11.2012. [DOI] [PMC free article] [PubMed] [Google Scholar]
- Bouyer K, Simerly RB. Neonatal leptin exposure specifies innervation of presympathetic hypothalamic neurons and improves the metabolic status of leptin-deficient mice. J Neurosci. 2013;33:840–851. doi: 10.1523/JNEUROSCI.3215-12.2013. [DOI] [PMC free article] [PubMed] [Google Scholar]
- Caron E, Sachot C, Prevot V, Bouret SG. Distribution of leptin-sensitive cells in the postnatal and adult mouse brain. J Comp Neurol. 2010;518:459–476. doi: 10.1002/cne.22219. [DOI] [PubMed] [Google Scholar]
- Chapman JC, McClenaghan NH, Cosgrove KE, Hashmi MN, Shepherd RM, Giesberts AN, White SJ, Ammälä C, Flatt PR, Dunne MJ. ATP-sensitive potassium channels and efaroxan-induced insulin release in the electrofusion-derived BRIN-BD11 beta-cell line. Diabetes. 1999;48:2349–2357. doi: 10.2337/diabetes.48.12.2349. [DOI] [PubMed] [Google Scholar]
- Claret M, Smith MA, Batterham RL, Selman C, Choudhury AI, Fryer LG, Clements M, Al-Qassab H, Heffron H, Xu AW, Speakman JR, Barsh GS, Viollet B, Vaulont S, Ashford ML, Carling D, Withers DJ. AMPK is essential for energy homeostasis regulation and glucose sensing by POMC and AgRP neurons. J Clin Invest. 2007;117:2325–2336. doi: 10.1172/JCI31516. [DOI] [PMC free article] [PubMed] [Google Scholar]
- Cowley MA, Smart JL, Rubinstein M, Cerdán MG, Diano S, Horvath TL, Cone RD, Low MJ. Leptin activates anorexigenic POMC neurons through a neural network in the arcuate nucleus. Nature. 2001;411:480–484. doi: 10.1038/35078085. [DOI] [PubMed] [Google Scholar]
- Draper S, Kirigiti M, Glavas M, Grayson B, Chong CN, Jiang B, Smith MS, Zeltser LM, Grove KL. Differential gene expression between neuropeptide Y expressing neurons of the dorsomedial nucleus of the hypothalamus and the arcuate nucleus: microarray analysis study. Brain Res. 2010;1350:139–150. doi: 10.1016/j.brainres.2010.03.082. [DOI] [PMC free article] [PubMed] [Google Scholar]
- Frontini A, Bertolotti P, Tonello C, Valerio A, Nisoli E, Cinti S, Giordano A. Leptin-dependent STAT3 phosphorylation in postnatal mouse hypothalamus. Brain Res. 2008;1215:105–115. doi: 10.1016/j.brainres.2008.03.078. [DOI] [PubMed] [Google Scholar]
- Grove KL, Grayson BE, Glavas MM, Xiao XQ, Smith MS. Development of metabolic systems. Physiol Behav. 2005;86:646–660. doi: 10.1016/j.physbeh.2005.08.063. [DOI] [PubMed] [Google Scholar]
- Hibino H, Inanobe A, Furutani K, Murakami S, Findlay I, Kurachi Y. Inwardly rectifying potassium channels: their structure, function, and physiological roles. Physiol Rev. 2010;90:291–366. doi: 10.1152/physrev.00021.2009. [DOI] [PubMed] [Google Scholar]
- Ibrahim N, Bosch MA, Smart JL, Qiu J, Rubinstein M, Rønnekleiv OK, Low MJ, Kelly MJ. Hypothalamic proopiomelanocortin neurons are glucose responsive and express K(ATP) channels. Endocrinology. 2003;144:1331–1340. doi: 10.1210/en.2002-221033. [DOI] [PubMed] [Google Scholar]
- Karschin C, Ecke C, Ashcroft FM, Karschin A. Overlapping distribution of K(ATP) channel-forming Kir6.2 subunit and the sulfonylurea receptor SUR1 in rodent brain. FEBS Lett. 1997;401:59–64. doi: 10.1016/S0014-5793(96)01438-X. [DOI] [PubMed] [Google Scholar]
- Kraeft S, Schwarzer K, Eiden S, Nuesslein-Hildesheim B, Preibisch G, Schmidt I. Leptin responsiveness and gene dosage for leptin receptor mutation (fa) in newborn rats. Am J Physiol. 1999;276:E836–E842. doi: 10.1152/ajpendo.1999.276.5.E836. [DOI] [PubMed] [Google Scholar]
- Krashes MJ, Shah BP, Koda S, Lowell BB. Rapid versus delayed stimulation of feeding by the endogenously released AgRP neuron mediators GABA, NPY, and AgRP. Cell Metab. 2013;18:588–595. doi: 10.1016/j.cmet.2013.09.009. [DOI] [PMC free article] [PubMed] [Google Scholar]
- Leshan RL, Bjornholm M, Munzberg H, Myers MG., Jr Leptin receptor signaling and action in the central nervous system. Obesity. 2006;14(Suppl 5):208S–212S. doi: 10.1038/oby.2006.310. [DOI] [PubMed] [Google Scholar]
- Mann PE, Foltz G, Rigero BA, Bridges RS. The development of POMC gene expression in the medial basal hypothalamus of prepubertal rats. Brain Res Dev Brain Res. 1999;116:21–28. doi: 10.1016/S0165-3806(99)00071-1. [DOI] [PubMed] [Google Scholar]
- Miki T, Liss B, Minami K, Shiuchi T, Saraya A, Kashima Y, Horiuchi M, Ashcroft F, Minokoshi Y, Roeper J, Seino S. ATP-sensitive K+ channels in the hypothalamus are essential for the maintenance of glucose homeostasis. Nat Neurosci. 2001;4:507–512. doi: 10.1038/87455. [DOI] [PubMed] [Google Scholar]
- Mistry AM, Swick A, Romsos DR. Leptin alters metabolic rates before acquisition of its anorectic effect in developing neonatal mice. Am J Physiol. 1999;277:R742–R747. doi: 10.1152/ajpregu.1999.277.3.R742. [DOI] [PubMed] [Google Scholar]
- Mizuno TM, Kleopoulos SP, Bergen HT, Roberts JL, Priest CA, Mobbs CV. Hypothalamic pro-opiomelanocortin mRNA is reduced by fasting and [corrected] in ob/ob and db/db mice, but is stimulated by leptin. Diabetes. 1998;47:294–297. doi: 10.2337/diab.47.2.294. [DOI] [PubMed] [Google Scholar]
- Myers MG, Cowley MA, Münzberg H. Mechanisms of leptin action and leptin resistance. Annu Rev Physiol. 2008;70:537–556. doi: 10.1146/annurev.physiol.70.113006.100707. [DOI] [PubMed] [Google Scholar]
- Padilla SL, Carmody JS, Zeltser LM. Pomc-expressing progenitors give rise to antagonistic neuronal populations in hypothalamic feeding circuits. Nat Med. 2010;16:403–405. doi: 10.1038/nm.2126. [DOI] [PMC free article] [PubMed] [Google Scholar]
- Padilla SL, Reef D, Zeltser LM. Defining POMC neurons using transgenic reagents: impact of transient Pomc expression in diverse immature neuronal populations. Endocrinology. 2012;153:1219–1231. doi: 10.1210/en.2011-1665. [DOI] [PMC free article] [PubMed] [Google Scholar]
- Proulx K, Richard D, Walker CD. Leptin regulates appetite-related neuropeptides in the hypothalamus of developing rats without affecting food intake. Endocrinology. 2002;143:4683–4692. doi: 10.1210/en.2002-220593. [DOI] [PubMed] [Google Scholar]
- Qiu J, Fang Y, Rønnekleiv OK, Kelly MJ. Leptin excites proopiomelanocortin neurons via activation of TRPC channels. J Neurosci. 2010;30:1560–1565. doi: 10.1523/JNEUROSCI.4816-09.2010. [DOI] [PMC free article] [PubMed] [Google Scholar]
- Scott MM, Lachey JL, Sternson SM, Lee CE, Elias CF, Friedman JM, Elmquist JK. Leptin targets in the mouse brain. J Comp Neurol. 2009;514:518–532. doi: 10.1002/cne.22025. [DOI] [PMC free article] [PubMed] [Google Scholar]
- Sohn JW, Elmquist JK, Williams KW. Neuronal circuits that regulate feeding behavior and metabolism. Trends Neurosci. 2013;36:504–512. doi: 10.1016/j.tins.2013.05.003. [DOI] [PMC free article] [PubMed] [Google Scholar]
- Spanswick D, Smith MA, Groppi VE, Logan SD, Ashford ML. Leptin inhibits hypothalamic neurons by activation of ATP-sensitive potassium channels. Nature. 1997;390:521–525. doi: 10.1038/37379. [DOI] [PubMed] [Google Scholar]
- Swithers SE. Do metabolic signals stimulate intake in rat pups? Physiol Behav. 2003;79:71–78. doi: 10.1016/S0031-9384(03)00106-9. [DOI] [PubMed] [Google Scholar]
- van den Top M, Lee K, Whyment AD, Blanks AM, Spanswick D. Orexigen-sensitive NPY/AgRP pacemaker neurons in the hypothalamic arcuate nucleus. Nat Neurosci. 2004;7:493–494. doi: 10.1038/nn1226. [DOI] [PubMed] [Google Scholar]
- van den Top M, Lyons DJ, Lee K, Coderre E, Renaud LP, Spanswick D. Pharmacological and molecular characterization of ATP-sensitive K(+) conductances in CART and NPY/AgRP expressing neurons of the hypothalamic arcuate nucleus. Neuroscience. 2007;144:815–824. doi: 10.1016/j.neuroscience.2006.09.059. [DOI] [PubMed] [Google Scholar]
- Vickers MH, Gluckman PD, Coveny AH, Hofman PL, Cutfield WS, Gertler A, Breier BH, Harris M. Neonatal leptin treatment reverses developmental programming. Endocrinology. 2005;146:4211–4216. doi: 10.1210/en.2005-0581. [DOI] [PubMed] [Google Scholar]
- Wang JH, Wang F, Yang MJ, Yu DF, Wu WN, Liu J, Ma LQ, Cai F, Chen JG. Leptin regulated calcium channels of neuropeptide Y and proopiomelanocortin neurons by activation of different signal pathways. Neuroscience. 2008;156:89–98. doi: 10.1016/j.neuroscience.2008.04.079. [DOI] [PubMed] [Google Scholar]
- Wang R, Liu X, Hentges ST, Dunn-Meynell AA, Levin BE, Wang W, Routh VH. The regulation of glucose-excited neurons in the hypothalamic arcuate nucleus by glucose and feeding-relevant peptides. Diabetes. 2004;53:1959–1965. doi: 10.2337/diabetes.53.8.1959. [DOI] [PubMed] [Google Scholar]
- Williams KW, Scott MM, Elmquist JK. From observation to experimentation: leptin action in the mediobasal hypothalamus. Am J Clin Nutr. 2009;89:985S–990S. doi: 10.3945/ajcn.2008.26788D. [DOI] [PMC free article] [PubMed] [Google Scholar]
- Xia Y, Haddad GG. Major differences in CNS sulfonylurea receptor distribution between the rat (newborn, adult) and turtle. J Comp Neurol. 1991;314:278–289. doi: 10.1002/cne.903140206. [DOI] [PubMed] [Google Scholar]
- Xia Y, Eisenman D, Haddad GG. Sulfonylurea receptor expression in rat brain: effect of chronic hypoxia during development. Pediatr Res. 1993;34:634–641. doi: 10.1203/00006450-199311000-00015. [DOI] [PubMed] [Google Scholar]
- Zeltser LM, Seeley RJ, Tschöp MH. Synaptic plasticity in neuronal circuits regulating energy balance. Nat Neurosci. 2012;15:1336–1342. doi: 10.1038/nn.3219. [DOI] [PubMed] [Google Scholar]