

Abstract
Diabetes mellitus, a disorder of glucose regulation, is a global burden affecting 366 million people across the world. An artificial “closed-loop” system able to mimic pancreas activity and release insulin in response to glucose level changes has the potential to improve patient compliance and health. Herein we develop a glucose-mediated release strategy for the self-regulated delivery of insulin using an injectable and acid-degradable polymeric network. Formed by electrostatic interaction between oppositely charged dextran nanoparticles loaded with insulin and glucose-specific enzymes, the nanocomposite-based porous architecture can be dissociated and subsequently release insulin in a hyperglycemic state through the catalytic conversion of glucose into gluconic acid. In vitro insulin release can be modulated in a pulsatile profile in response to glucose concentrations. In vivo studies validated that these formulations provided improved glucose control in type 1 diabetic mice subcutaneously administered with a degradable nano-network. A single injection of the developed nano-network facilitated stabilization of the blood glucose levels in the normoglycemic state (<200 mg/dL) for up to 10 days.
Keywords: drug delivery, diabetes, insulin, glucose-responsive, closed-loop, nano-network
Diabetes mellitus, characterized by accumulating glucose concentrations in the blood, is a major global public health epidemic which currently affects an estimated 366 million people across the world.1 Diabetes is a result of the body's inability to produce enough insulin (type 1) or cells that do not respond to the insulin that is produced (type 2). Current standard care for type 1 diabetic patients and advanced type 2 diabetic patients requires consistent monitoring of blood glucose levels and subsequent insulin injections to achieve normoglycemia.2 However, such self-administration, known as open-loop insulin delivery, can be painful and result in poor compliance and glucose control.3,4 Lack of tight control of blood glucose levels accounts for many chronic complications of diabetes such as limb amputation, blindness, and kidney failure, while hypoglycemia results in risks of seizures, unconsciousness, brain damage, or death.5 In addition, there are challenges to accurate monitoring of daily glycemic fluctuations in order to intervene with the appropriate insulin treatments.6,7
Significant effort has been focused on developing a “closed-loop” system capable of continuously delivering accurate levels of insulin in response to in vivo glucose levels.4,8 One strategy is to integrate both a glucose-sensing moiety and a sensortriggered insulin releasing element within one system.4 A semiautomated closed-loop insulin delivery device has been created using a continuous glucose-monitoring sensor and an external insulin infusion pump. However, challenges, such as guaranteeing accurate signal feedback and preventing biofouling, associated with this implantable device still persist today.4 An alternative approach has been to develop polymeric biomaterials to achieve chemically controlled closed-loop insulin delivery.3,4 Example approaches have been developed by integration of glucose-sensing moieties such as glucose oxidase (GOx),9–13 lectin (ConA),14,15 and synthetic phenylboronic acid (PBA).16–20
GOx is an enzyme which catalyzes the conversion of glucose to gluconic acid in the presence of oxygen shown in the following reaction:21
Previous glucose-responsive systems with GOx typically entrap or immobilize the enzyme within biomaterials, causing a local decrease in pH with increasing glucose concentrations.13,22,23 As a result, materials can be designed to adapt to subtle pH changes which alter the material properties of the device and allow for tailorable release of loaded insulin in response to increasing blood glucose concentrations. On the basis of this strategy, a number of bulk hydrogel matrices or membranes have been developed.3,4 However, bulk hydrogel systems exhibit slow response to changes in glucose concentration due to mass transport limitations,4 while GOx-containing membranes suffer from low mechanical strength, which can result in premature insulin leakage.4 In this report, we develop an injectable polymeric nanoparticle-cross-linked network (designated nano-network) capable of glucose-mediated insulin delivery. Using chemically modified dextran (designated m-dextran) as an acid-degradable and biocompatible matrix material, we have demonstrated that the resulting nano-network can be utilized for glucose-regulated insulin delivery.
RESULTS AND DISCUSSION
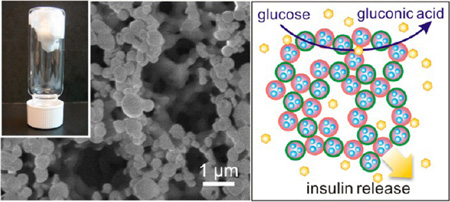
A schematic of the nano-network is shown in Figure 1. Oppositely charged degradable nanoparticles interact and self-assemble through electrostatic forces24 to create a cohesive gel-like network. The produced gel network forms a stable three-dimensional, porous structure, which yields an increased surface area to volume ratio for maximum interaction between glucose and GOx (Figure 2b). Materials of this design have been reported to enable the release of payloads with near zero-order kinetics.25 Additionally, the nanonetwork produces shear-thinning behavior due to the disruption of particle–particle interactions as the applied shear force is increased. Once the external force is withdrawn, the strong cohesive property is recovered, which allows for convenient molding and injection (Figure 2d).
Figure 1.

Schematic of the glucose-responsive nano-network. (a) Nanoparticles (NPs) encapsulating insulin and glucose-specific enzymes (GOx, glucose oxidase; CAT, catalase) are made of acidic sensitive acetal-modified dextran (b) and coated with chitosan and alginate, respectively. (c) Nano-network (NN) is formed by mixing oppositely charged nanoparticles together and efficiently degrades to release insulin upon the catalytic generation of gluconic acid under hyperglycemic conditions. (d) Schematic of glucose-mediated insulin delivery for type 1 diabetes treatment using the STZ-induced diabetic mice model.
Figure 2.

Characterization of the glucose-responsive nano-network. SEM images of nanoparticles (NPs) coated with chitosan and alginate (a) and formed nano-network (b). Inset is a gel-like nano-network adhered to the bottom of an inverted vial. (c) Laser scanning confocal microscopy image of the nano-network consisting of chitosan-coated NPs (encapsulated with FITC-stained insulin) and alginate-coated nanoparticles (encapsulated with rhodamine-stained insulin). (d) Viscosity and shear-thinning behaviors of the nano-network compared with pure nanoparticles. Inset shows that the collected nano-network is injectable with sufficient cohesiveness through a conventional syringe.
The nanoparticles used to form this nano-network were prepared by a double emulsion (water-in-oil-in-water)-based solvent evaporation/extraction method and comprised four components: acid-degradable polymeric matrix, polyelectrolyte-based surface coatings, encapsulated glucose-specific enzymes (GOx and catalase (CAT)), and recombinant insulin. Dextran was selected due to its biocompatibility, biodegradability, and ease of modification.26 To enable water-soluble dextran to encapsulate hydrophilic payloads, hydroxyls of dextran were modified with pendant acetals (designated m-dextran) via an acid-catalyzed reaction with ethoxypropene (Supporting Information Figures S1–S3).27 The m-dextran is soluble in organic solvents typically used for emulsion techniques, such as dichloromethane and acetone. More importantly, the incorporation of ethoxypropene provides a pH-sensitive element, which is expected to hydrolyze under mildly acidic aqueous conditions and thus unveiling the natural hydroxyl groups of dextran (Supporting Information Figure S1). The complete hydrolysis of m-dextran results in regeneration of water-soluble native dextran together with ethanol and acetone, which show insignificant toxicity in small quantities (Supporting Information Figure S4). The enzyme GOx is the glucose-responsive factor for generating pH stimulus, while the CAT is applied to offer oxygen (O2) to assist GOx's catalysis and consume undesired hydrogen peroxide (H2O2) produced by the reaction (Supporting Information Figure S5), which maybe toxic in vivo and deactivates GOx.23,28 The weight ratio of GOx to CAT was optimized as 4:1 by analyzing the catalytic capability of enzyme mixtures at different concentrations (Figure S5). The final weight ratio of m-dextran/insulin/enzymes for preparation of glucose-responsive particles was optimized and determined as 87/13/1.3, based on the loading efficiency of insulin as well as response speed.
In order to obtain oppositely charged nanoparticles, chitosan and alginate, two polysaccharides that are used in humans,29,30 were employed as surface modifiers to coat dextran nanoparticles. Both chitosan and alginate were exploited to introduce both a positive and negative surface charge, respectively, on dextran nanoparticles. Utilizing a double emulsion procedure, two types of dextran particles were prepared separately with an insulin loading capacity of 7.9±0.8 wt% for the chitosan-coated particles and 11.4 ± 0.1 wt % for the alginate-coated particles (Supporting Information Table S1). As shown in the scanning electron microscopy (SEM) images in Figure 2a, both chitosanand alginate-coated nanoparticles have nearly monodisperse particle sizes. The average hydrodynamic particle sizes determined by dynamic light scattering (DLS) for chitosan-coated and alginate-coated particles were 340 and 293 nm, respectively (Supporting Information Figure S6). The zeta-potentials for both particles were 10.6±1.9 mV (chitosan-coated) and −11.5± 1.7 mV (alginate-coated) (Supporting Information Table S2). The uniform and small size of these nanoparticles provided the cohesive strength, while the opposite zeta-potentials promoted tight particle packing as a result of the electrostatic interaction.
The cohesive nano-network loaded with both enzymes and insulin (designated NN(E+I)) was created by mixing the oppositely charged dextran nanoparticle solutions. The SEM image in Figure 2b illustrates that nanoparticles were joined together to form a bulk porous structure composed of a 3D network with microchannels. The formation of domains consisting of tightly packed agglomerates suggests that the cohesive nature of the nano-network resulted from an equilibrium of interparticle attractions (agglomerates) and repulsions (pores). To further validate the interaction between oppositely charged particles, insulin conjugated with two different fluorescent dyes was encapsulated into nanoparticles coated with chitosan and alginate. As demonstrated in Figure 2c, the 3D laser scanning confocal microscopy (LSCM) indicates that particles in the resulting network were compacted without noticeable mobility. To investigate the injectability of the nano-network, the viscosities of each nanoparticle formulation and resulting nanonetwork with the same solid content were measured as a function of shear rate (Figure 2d). The initial viscosity of the nano-network at low shear rates compared to pure nanoparticles confirmed the formation of attractive electrostatic interaction and compact nanoparticle packing. The cohesive forces were reduced at high shear rate, resulting in the low viscosities that allow for convenient injection of the nano-network through syringes (Figure 2d).
To examine the glucose-responsive dissociation of the nano-network, gels were collected in microcentrifuge tubes and incubated with PBS solutions in the absence or presence of glucose, both at a hyperglycemic level (400 mg dL−1) and a normal level (100 mg dL−1). The nano-network material exposed to the hyperglycemic solution gradually dissociated over time, as shown in Figure 3a. After 8 h, the incubated solution became transparent due to the thorough hydrolysis of the modified dextran into native dextran. Meanwhile, the recorded pH values of incubating solutions substantiated that the degradation of the network correlated to a decrease of the solution pH from 7.4 to 4.2, confirming the enzymatic conversion of glucose to gluconic acid. In contrast, both of the control samples (no glucose and 100 mg dL−1 glucose) did not display observable dissociation over the 8 h time course, consistent with lack of change in the solution pH (Figure 3b). Additionally, we observed that the viscosity of the nano-network at low shear rates steadily decreased when exposed to hyperglycemic conditions (Supporting Information Figure S7), as a result of decreasing cohesive forces due to the changing charges of polyelectrolytes as the pH decreases. The overall conformational structure of released insulin from the nano-network was maintained to that of native insulin demonstrated by the circular dichroism (CD) spectrum in Figure 3c.
Figure 3.

Glucose-responsive degradation of nano-network and insulin release. (a) Pictures of the nano-network incubated in different glucose concentrations in 1× PBS solution: 0, 100, and 400 mg/dL at 37 °C over time. (b) Relevant pH changes in different incubation solutions with nano-networks. (c) CD spectra of insulin solution and insulin released from the nanonetwork incubated with 400 mg/dL glucose at 37 °C for 8 h. (d) In vitro accumulated insulin release of the nano-network in different glucose concentrations at 37 °C. (e) Self-regulated profile of the nano-network presents the rate of insulin release as a function of glucose concentration. Data points represent mean ± SD (n = 2) in (a), (d), and (e).
We next assessed insulin release kinetics in response to varying glucose levels. Accumulated insulin release studies were performed and confirmed that faster insulin release was achieved from the nano-networks under a hyperglycemic environment, as plotted in Figure 3d. In contrast, limited insulin release from the nano-networks was observed within 15 h of incubation at the normal glucose level and glucose-free PBS buffer. These results are also consistent with the above-mentioned dissociation response. Meanwhile, the solubility of insulin is increased under an acidic environment, which further enhances the insulin release rate.22 Furthermore, the insulin release profile of nano-networks presented a pulsatile pattern when the glucose concentration was cyclically varied between the normal and hyperglycemic levels every 2 h for several repetitions, as shown in Figure 3e. The nanonetwork responded to changes of glucose levels, and a maximum 3.6-fold increase in the insulin release rate was obtained when the glucose level was switched to the hyperglycemic state. Moreover, the release rates at both hyperglycemic and normoglycemic levels stably increased to a maximum point and then gradually decreased. The “acceleration period” of the release rate can be attributed to the progressively attenuated cohesive force and dissociated structure of the network. Collectively, these results point to the degradation of the nano-network and the subsequent insulin release is a glucose-mediated and pH-dependent process. Like a smart valve system, the insulin release through the nano-network is facilitated at a high glucose level and inhibited at a low glucose level.
To examine the efficacy of the insulin-loaded nanonetwork for diabetes treatment, streptozotocin (STZ)- induced diabetic mice31 were subcutaneously injected with PBS solution, human recombinant insulin solution, nano-network loaded with insulin and enzymes (NN(E+I)), nano-network loaded with insulin only (NN(I)), and nano-network loaded with enzymes only (NN(E)). The blood glucose (BG) levels of administrated mice in each group were then monitored over time. As shown in the plots in Figure 4a and Figure S8 (Supporting Information), the BG levels of diabetic mice treated with one injection of NN-EI were stably maintained in the normoglycemia (<200 mg/dL) range for up to 10 days without peaks of hyperglycemic or hypoglycemic states. For some of the treated mice, the BG levels were maintained in the normoglycemic range for over 2 weeks, as shown in Figure 4b. The average BG levels of the NN(E+I) group gradually increased due to a decrease in the insulin content or loss of bioactivity of encapsulated insulin but were still significantly lower than the original BG level for up to 3 weeks. Correspondingly, the plasma human insulin in mice injected with NN(E+I) can be detected over the 3 week time course (Figure 4c).
Figure 4.

In vivo studies of the nano-network for type 1 diabetes treatment. Blood glucose levels (a) and plasma human insulin concentration (c) in STZ-induced C57B6 diabetic mice after subcutaneous injection with 1× PBS, nano-network encapsulated insulin and enzymes (NN(E+I)), nano-network encapsulated insulin only (NN(I)), nano-network encapsulated with enzymes only (NN(E)), or pure insulin solution. (b) Changes of the mice number in different groups within the normoglycemic range (<200 mg/dL) over the administration time. (d) Glycated albumin percentages of mice treated with PBS, NN(E+I), NN(I), NN(E), and insulin solution. Student's t-test: *p < 0.05, ***p < 0.001. Data points represent mean ± SD (n = 8).
The rapid decrease in BG levels in the first 12 h (Figure 4a and Figure S8) is likely due to the initial burst of the insulin released in the solution part or adhered on the surface of the nano-network. However, the subsequent release of the remaining insulin encapsulated in nanoparticles, mediated by enzymatic catalysis, took place more slowly (Figure 4a). In contrast, the BG levels of mice treated with NN(I) maintained BG levels within the normal range for 2 days before returning to the hyperglycemic state. Meanwhile BG levels of mice injected with insulin solution increased to the hyperglycemic range on the second day after administration. In the absence of enzymes, NN(I) cannot undergo an acidic degradation event to effectively release insulin, and thus the BG levels of administrated mice were notably higher than those treated with NN(E+I). Without a loading matrix, pure insulin was quickly cleared and resulted in a rapid decrease in plasma insulin concentration on the next day of administration (Figure 4a).
To investigate the possible effect of the catalytic consumption of glucose on the decrease of the BG levels, we also treated diabetic mice with NN(E). However, the conversion of glucose through enzymes did not show a detectable effect in lowering BG levels (Figure 4a). The glucose responsiveness was tested in vivo by an intravenous glucose tolerance test at 6 day post-injection (Supporting Information). Mice treated with NN(E+I) showed a rapid increase in BG levels upon glucose injection followed by a slightly delayed decrease to finally reach normal BG levels at 80 min in comparison with healthy animals (Supporting Information Figure S9). We also tested the glycated albumin level in serum, a medium term (2–3 weeks) indicator of diabetic control.32 As shown in Figure 4d, the glycated albumin ratio (glycated albumin/total albumin) was prominently decreased 1.6-fold 2 weeks after administration with NN(E+I). In addition, after a 4 week post-administration period, the group treated with NN(E+I) gained higher body condition scores compared with control groups. Taken together, sustained insulin release from the degradable insulin-loaded nano-network and the pharmacological duration of insulin activity have been observed.
To assess the biocompatibility of the nano-network, the cytotoxicity of nanoparticles coated with chitosan or alginate and their degradation products toward HeLa cells was evaluated at various concentrations ranging from 0.05 to 1.2 mg/mL. For all concentrations studied, m-dextran-based nanoparticles and relevant degradation products did not show significant decrease of cell viability (Supporting Information Figure S4). To further investigate in vivo biocompatibility and degradability of the nano-network, the sizes of skin protrusion due to the subcutaneous injection were monitored over time. As shown in Figure 5a, the average lump sizes in the injection sites of mice treated with NN(E+I) steadily decreased, suggesting glucose-mediated degradation was substantially triggered. No significant skin protrusion can be found after 4 weeks (Figure 5b,c). However, for mice treated with NN(I), the lump sizes did not obviously decrease, even after 4 weeks. Figure 5d represents the histological response of the injected nano-network. During the first 2weeks, inflammatory cells, such as polymorphonuclear cells (PMN) and macrophages, were found to have infiltrated into both NN(E+I) and NN(I), where the nano-network region was avascular and a cellular, and a fibrin network separated the nano-network from the muscle region. This inflammatory reaction can be attributed to the acute inflammation which often occurs when biomaterials are subcutaneously implanted. After 4 weeks, the NN(E+I) had completely degraded and the affected region was covered with connective tissue. However, a noticeable inflammatory region can still be observed in the samples administrated with NN(I).
Figure 5.

In vivo biocompatibility analysis. (a) Changes of lump sizes in the injection sites of STZ-induced C57B6 diabetic mice treated with NN(E+I) and NN(I) over time. (b) Pictures of mice dorsum and relevant skins (c) treated with subcutaneous injection of NN(E+I) or NN(I) after 4 weeks. Scale bars: 1 cm for (b) and 2mm for (c). (d) H&E stained sections of subcutaneously injected NN(E+I) or NN(I) with surrounding tissues after 2 and 4 weeks, respectively. The regions of skin muscles, fat tissues, and nano-networks are indicated by M, F, and NN, respectively. Scale bar: 200 µm.
CONCLUSION
In conclusion, we report a new platform for glucose-mediated delivery of insulin through an injectable nano-network. Consisting of oppositely charged dextran nanoparticles encapsulating insulin and glucose-specific enzymes, the gel-like 3D scaffold can be effectively dissociated to release insulin in a hyperglycemic condition, where the catalytic conversion of glucose into gluconic acid and the subsequent degradation of the polymeric matrix are facilitated. This formulation design provides a potential delivery strategy for both self-regulated and long-term diabetes management.
METHODS
Materials
All chemicals were purchased from Sigma-Aldrich unless otherwise specified and were used as received. Human recombinant insulin (Zn salt, 27.5 IU/mg) was purchased from Invitrogen. The deionized water was prepared by a Millipore NanoPure purification system (resistivity higher than 18.2 MΩ · cm−1).
Preparation of m-Dextran
Briefly,1.0 g of dextran(Mn~9–11kDa) was added to a flame-dried round-bottom flask and purged with nitrogen. Ten milliliters of anhydrous dimethyl sulfoxide was added to the flask and stirred until complete dissolution of the dextran. Pyridinium p-toluenesulfonate (PPTS, 15.6 mg, 0.062 mmol) was added to the solution followed by the addition of 2-ethoxypropene (4.16 mL, 37 mmol). The reaction mixture was purged with nitrogen briefly and then sealed with parafilm to prevent reactant evaporation. The reaction was stirred at room temperature for 30 min, resulting in m-dextran. At that point, the reaction was quenched by the addition of 1 mL of triethylamine. The mixture was then precipitated and washed three times in basic water (pH ~8) to prevent undesired degradation and collected by centrifugation (8000 rpm, 15 min). The product was lyophilized to remove residual water and resulted in a white solid. IR (KBr, cm−1): 3485, 2971, 2862, 1471, 1374, 1246, 1203, 1047, 806, 746, 549. 1H NMR (400 MHz, CDCl3): δ 5.21 (br, 1H), 4.87 (br, 1H), 4.10–3.70 (br, 12H), 3.46 (br, 4H), 1.30 (br, 16H), 1.11 (br, 8H).
Preparation of Glucose-Responsive Nanoparticles and Nano-Network
Dextran nanoparticles were prepared by an improved double emulsion (water-in-oil-in-water) solvent evaporation/extraction method. Briefly, 5.8 mL of organic phase (dichloromethane (DCM)) containing 240 mg of m-dextran was emulsified with 0.5 mL of aqueous phase containing 35 mg of human recombinant insulin (Invitrogen, USA) only or together with 3.5 mg of enzymes (weight ratio of glucose oxidase to catalase 4:1) by sonication for 45 cycles (1 s each with a duty cycle of 60%). Thereafter, the primary emulsion was immediately poured into 25 mL of the chitosan or alginate aqueous solution (1%) and sonicated for 45 cycles. The double emulsion was subsequently transferred into 150 mL of chitosan (Mn = 612 kDa; degree of deacetylation = 96.1%) or alginate (Mv = 1.6 × 10⁵) aqueous solution (0.2%). The mixed suspension was stirred at room temperature to eliminate DCM by evaporation. After 2 h, the resulting nanoparticles were cleaned and collected by repeating a procedure of centrifuging at 10 000 rpm and resuspending in distilled water three times. The product was dried by lyophilization and stored at 4 °C. To obtain nano-network gels, chitosan- or alginate-coated nanoparticles were separately dispersed in deionized water (w/v = 20%) and mixed together (w/w = 1/1) in a bath sonitator for 2 min. The prepared nano-network gel was collected by centrifuging at 3000 rpm for 3 min and stored at 4 °C. The loading capacity (LC) and encapsulation efficiency (EE) of insulin-encapsulated nanoparticles were determined by measuring the amount of non-encapsulated insulin through BCA (bicinchoninic acid) protein assay and using insulin-free particles as basic correction. LC and EE were calculated as LC = (A − B)/C, EE = (A − B)/A, where A was expected encapsulated amount of insulin, B was the free amount of insulin in the collection solution, and C was the total weight of the particles.
In Vitro Release Studies
After preparation of the nanonetwork, various solutions (PBS, 100 or 400 mg dL−1 glucose, 500 µL) were added to each tube and incubated at 37 °C on an orbital shaker to evaluate the release of insulin. At predetermined time points, the sample was centrifuged (8000 rpm, 30 s) and 12 µL of the supernatant was removed for analysis. Twelve microliters of fresh solution was then added to the tube to maintain a constant volume and placed back within the incubator. Total insulin content was measured using a Coomassie Plus protein assay. The absorbance of the well was detected at 595 nm, and the concentration was interpolated from an insulin standard curve and a calibration curve using the nano-network with enzymes only. To evaluate the material's ability to adapt to cyclical changes in glucose levels, each nanonetwork sample was first incubated in 400 mg dL−1 glucose (500 µL) for 2 h at 37 °C. At that point, the sample was centrifuged (8000 rpm, 30 s) and all of the supernatant was recovered. The sample was washed twice with PBS and then incubated in 100 mg dL−1 glucose (500 µL) for another 2 h. This cycle was repeated numerous times. Similarly, insulin concentration was determined using the Coomassie Plus protein assay.
In Vivo Studies Using STZ-Induced Diabetic Mice
The efficacy of the insulin-loaded nano-network for diabetes treatment was evaluated in vivo by assessment of glycemia in STZ-induced adult diabetic mice (male C57B6, Jackson Lab, USA). Mice were cared for under supervision of MIT's Division of Comparative Medicine and in compliance with NIT's Principles of Laboratory Animal Care. The blood glucose levels of mice were continuously tested for 2 days before administration by collecting blood (~3 µL) from the tail vein and measuring using the Clarity GL2Plus glucose monitor (VWR, USA). Eight diabetic mice were selected for each group administered with PBS solution, insulin solution, nano-network loaded with human recombinant insulin and enzymes, nano-network loaded with insulin only, or nano-network with enzyme only. One hundred fifty microliters of the aqueous solution or nano-network was injected using a 1 cc syringe with a 19 gauge needle into the subcutaneous dorsum of mice (insulin dose = 60 mg/kg) that had been anesthetized with 1% isoflurane. The glucose level of each mouse was monitored over time (every 30 min or 2 h for the first 12 h in the day of administration and once per day in the morning for following days). To measure in vivo insulin concentration, blood samples (25 µL) were drawn from the tail vein of mice and collected into Sarstedt serum gel microtubes. Serum samples (5 µL) were stored frozen at −20 °C until assayed. Plasma insulin concentrations were determined using the human insulin ELISA kit (Calbiotech, USA). To quantitatively determine ratios of glycated albumin over total albumin concentration, collected serum samples (7 µL) were analyzed 1 day before administration and 2 weeks after administration using the mouse glycated albumin kit (Crystal Chem, USA).
Acknowledgment
This work was supported by Grant 09PGT1D027 from the Leona M. and Harry B. Helmsley Charitable Trust Foundation, and a generous gift from the Tayebati Family Foundation.
Footnotes
Conflict of Interest: The authors declare no competing financial interest.
Supporting Information Available: Experimental details for preparation and characterization of the nano-network, in vitro and in vivo studies. This material is available free of charge via the Internet at http://pubs.acs.org.
REFERENCES AND NOTES
- 1.International Diabetes Federation. 2011 http://www.idf.org/media-events/press-releases/2011. [Google Scholar]
- 2.Owens DR, Zinman B, Bolli GB. Insulins Today and Beyond. Lancet. 2001;358:739–746. doi: 10.1016/S0140-6736(01)05842-1. [DOI] [PubMed] [Google Scholar]
- 3.Bratlie KM, York RL, Invernale MA, Langer R, Anderson DG. Materials for Diabetes Therapeutics. Adv. Healthcare Mater. 2012;1:267–284. doi: 10.1002/adhm.201200037. [DOI] [PMC free article] [PubMed] [Google Scholar]
- 4.Ravaine V, Ancla C, Catargi B. Chemically Controlled Closed-Loop Insulin Delivery. J. Controlled Release. 2008;132:2–11. doi: 10.1016/j.jconrel.2008.08.009. [DOI] [PubMed] [Google Scholar]
- 5.The Effect of Intensive Treatment of Diabetes on the Development and Progression of Long-Term Complications in Insulin-Dependent Diabetes Mellitus. The Diabetes Control and Complications Trial Research Group. N. Engl. J. Med. 1993;329:977–986. doi: 10.1056/NEJM199309303291401. [DOI] [PubMed] [Google Scholar]
- 6.Jeandidier N, Boivin S. Current Status and Future Prospects of Parenteral Insulin Regimens, Strategies and Delivery Systems for Diabetes Treatment. Adv. Drug Delivery Rev. 1999;35:179–198. doi: 10.1016/s0169-409x(98)00072-6. [DOI] [PubMed] [Google Scholar]
- 7.Owens DR. New Horizons-Alternative Routes for Insulin Therapy. Nat. Rev. Drug Discovery. 2002;1:529–540. doi: 10.1038/nrd836. [DOI] [PubMed] [Google Scholar]
- 8.Kumareswaran K, Evans ML, Hovorka R. Artificial Pancreas: An Emerging Approach To Treat Type 1 Diabetes. Expert Rev. Med. Devices. 2009;6:401–410. doi: 10.1586/erd.09.23. [DOI] [PubMed] [Google Scholar]
- 9.Ishihara K, Kobayashi M, Ishimaru N, Shinohara I. Glucose-Induced Permeation Control of Insulin through a Complex Membrane Consisting of Immobilized Glucose- Oxidase and a Poly(amine) Polym. J. 1984;16:625–631. [Google Scholar]
- 10.Ito Y, Casolaro M, Kono K, Imanishi Y. An Insulin-Releasing System That Is Responsive to Glucose. J. Controlled Release. 1989;10:195–203. [Google Scholar]
- 11.Podual K, Doyle FJ, Peppas NA. Preparation and Dynamic Response of Cationic Copolymer Hydrogels Containing Glucose Oxidase. Polymer. 2000;41:3975–3983. [Google Scholar]
- 12.Podual K, Doyle FJ, Peppas NA. Glucose-Sensitivity of Glucose Oxidase-Containing Cationic Copolymer Hydrogels Having Poly(ethylene glycol) Grafts. J. Controlled Release. 2000;67:9–17. doi: 10.1016/s0168-3659(00)00195-4. [DOI] [PubMed] [Google Scholar]
- 13.Gordijo CR, Koulajian K, Shuhendler AJ, Bonifacio LD, Huang HY, Chiang S, Ozin GA, Giacca A, Wu XY. Nanotechnology-Enabled Closed Loop Insulin Delivery Device: In Vitro and In Vivo Evaluation of Glucose-Regulated Insulin Release for Diabetes Control. Adv. Funct. Mater. 2011;21:73–82. [Google Scholar]
- 14.Brownlee M, Cerami A. Glucose-Controlled Insulin- Delivery System–Semi-synthetic Insulin Bound to Lectin. Science. 1979;206:1190–1191. doi: 10.1126/science.505005. [DOI] [PubMed] [Google Scholar]
- 15.Makino K, Mack EJ, Okano T, Kim SW. A Microcapsule Self-Regulating Delivery System for Insulin. J. Controlled Release. 1990;12:235–239. [Google Scholar]
- 16.Kataoka K, Miyazaki H, Bunya M, Okano T, Sakurai Y. Totally Synthetic Polymer Gels Responding to External Glucose Concentration: Their Preparation and Application to On-Off Regulation of Insulin Release. J. Am. Chem. Soc. 1998;120:12694–12695. [Google Scholar]
- 17.Kataoka K, Miyazaki H, Okano T, Sakurai Y. Sensitive Glucose-Induced Change of the Lower Critical Solution Temperature of Poly[N,N-dimethylacrylamide-co-3-(acrylamido) phenyl-boronic acid] in Physiological Saline. Macromolecules. 1994;27:1061–1062. [Google Scholar]
- 18.Wu WT, Mitra N, Yan ECY, Zhou SQ. Multifunctional Hybrid Nanogel for Integration of Optical Glucose Sensing and Self-Regulated Insulin Release at Physiological pH. ACS Nano. 2010;4:4831–4839. doi: 10.1021/nn1008319. [DOI] [PubMed] [Google Scholar]
- 19.Matsumoto A, Ishii T, Nishida J, Matsumoto H, Kataoka K, Miyahara Y. A Synthetic Approach toward a Self- Regulated Insulin Delivery System. Angew. Chem., Int. Ed. 2012;51:2124–2128. doi: 10.1002/anie.201106252. [DOI] [PubMed] [Google Scholar]
- 20.Kim H, Kang YJ, Kang S, Kim KT. Monosaccharide- Responsive Release of Insulin from Polymersomes of Polyboroxole Block Copolymers at Neutral pH. J. Am. Chem. Soc. 2012;134:4030–4033. doi: 10.1021/ja211728x. [DOI] [PubMed] [Google Scholar]
- 21.Wu Q, Wang L, Yu HJ, Wang JJ, Chen ZF. Organization of Glucose-Responsive Systems and Their Properties. Chem. Rev. 2011;111:7855–7875. doi: 10.1021/cr200027j. [DOI] [PubMed] [Google Scholar]
- 22.Fischel-Ghodsian F, Brown L, Mathiowitz E, Brandenburg D, Langer R. Enzymatically Controlled Drug Delivery. Proc. Natl. Acad. Sci. U. S. A. 1988;85:2403–2406. doi: 10.1073/pnas.85.7.2403. [DOI] [PMC free article] [PubMed] [Google Scholar]
- 23.Traitel T, Cohen Y, Kost J. Characterization of Glucose- Sensitive Insulin Release Systems in Simulated In Vivo Conditions. Biomaterials. 2000;21:1679–1687. doi: 10.1016/s0142-9612(00)00050-8. [DOI] [PubMed] [Google Scholar]
- 24.Gilchrist JF, Chan AT, Weeks ER, Lewis JA. Phase Behavior and 3D Structure of Strongly Attractive Microsphere- Nanoparticle Mixtures. Langmuir. 2005;21:11040–11047. doi: 10.1021/la051998k. [DOI] [PubMed] [Google Scholar]
- 25.Tao SL, Desai TA. Microfabricated Drug Delivery Systems: From Particles to Pores. Adv. Drug Delivery Rev. 2003;55:315–328. doi: 10.1016/s0169-409x(02)00227-2. [DOI] [PubMed] [Google Scholar]
- 26.Naessens M, Cerdobbel A, Soetaert W, Vandamme EJ. Dextran Dextrinase and Dextran of Gluconobacter Oxydans. J. Ind. Microbiol. Biotechnol. 2005;32:323–334. doi: 10.1007/s10295-005-0259-5. [DOI] [PubMed] [Google Scholar]
- 27.Bachelder EM, Beaudette TT, Broaders KE, Dashe J, Fréchet JMJ. Acetal-Derivatized Dextran: An Acid-Responsive Biodegradable Material for Therapeutic Applications. J. Am. Chem. Soc. 2008;130:10494–10495. doi: 10.1021/ja803947s. [DOI] [PMC free article] [PubMed] [Google Scholar]
- 28.Zhang K, Wu XY. Modulated Insulin Permeation across a Glucose-Sensitive Polymeric Composite Membrane. J. Controlled Release. 2002;80:169–178. doi: 10.1016/s0168-3659(02)00024-x. [DOI] [PubMed] [Google Scholar]
- 29.Kumar MNVR, Muzzarelli RAA, Muzzarelli C, Sashiwa H, Domb AJ. Chitosan Chemistry and Pharmaceutical Perspectives. Chem. Rev. 2004;104:6017–6084. doi: 10.1021/cr030441b. [DOI] [PubMed] [Google Scholar]
- 30.Pawar SN, Edgar KJ. Alginate Derivatization: A Review of Chemistry, Properties and Applications. Biomaterials. 2012;33:3279–3305. doi: 10.1016/j.biomaterials.2012.01.007. [DOI] [PubMed] [Google Scholar]
- 31.Konrad RJ, Mikolaenko I, Tolar JF, Liu K, Kudlow JE. The Potential Mechanism of the Diabetogenic Action of Streptozotocin: Inhibition of Pancreatic Beta-Cell O-GlcNAc-Selective N-Acetyl-β-d-Glucosaminidase. Biochem. J. 2001;356:31–41. doi: 10.1042/0264-6021:3560031. [DOI] [PMC free article] [PubMed] [Google Scholar]
- 32.Yoshiuchi K, Matsuhisa M, Katakami N, Nakatani Y, Sakamoto K, Matsuoka T, Umayahara Y, Kosugi K, Kaneto H, Yamasaki Y, et al. Glycated Albumin Is a Better Indicator for Glucose Excursion than Glycated Hemoglobin in Type 1 and Type 2 Diabetes. Endocr. J. 2008;55:503–507. doi: 10.1507/endocrj.k07e-089. [DOI] [PubMed] [Google Scholar]