Abstract
Energy sensing by the AMP-activated protein kinase (AMPK) is of fundamental importance in cell biology. In the pancreatic beta cell, AMPK is a central regulator of insulin secretion. The capacity of the beta cell to increase insulin output is a critical compensatory mechanism in prediabetes, yet its molecular underpinnings are unclear. Here we delineate a complex consisting of the AMPK-related kinase SIK2, the CDK5 activator CDK5R1/p35, and the E3 ligase PJA2 essential for beta cell functional compensation. Following glucose stimulation, SIK2 phosphorylates p35 at Ser91, to trigger its ubiquitination via PJA2 and promote insulin secretion. Furthermore SIK2 accumulates in beta cells in models of metabolic syndrome to permit compensatory secretion; in contrast, beta cell knockout of SIK2 leads to accumulation of p35 and impaired secretion. This work demonstrates that the SIK2-PJA2-p35 complex is essential for glucose homeostasis and provides a link between p35-CDK5 and the AMPK family in excitable cells.
Keywords: SIK2, CDK5R1/p35, CDK5, beta cell, islet, beta cell compensation, AMPK, PJA2, glucose signalling, insulin secretion, insulin, calcium, hyperglycemia, diabetes
A longstanding goal in pancreatic beta cell biology has been to understand fundamental mechanisms of insulin secretion in order to improve cell function for the treatment of diabetes. Secretion of insulin promotes storage of glucose for use during fasting as well as for the suppression of gluconeogenesis during feeding, the loss of which contributes to disease progression1. The need for insulin is further enhanced by the phenomenon of insulin resistance, in which insulin signalling pathways in peripheral tissues become defective. Prediabetes, or glucose intolerance, is characterized by mild hyperglycemia that is maintained by a compensatory increase in insulin secretion from the beta cell compartment. The critical role of the pancreatic beta cell in preventing T2D has been further underscored by genome-wide association studies that revealed significant enrichment for genes central to beta cell function as T2D susceptibility loci2. Indeed, the transition from glucose intolerance/prediabetes to a diagnosis of diabetes occurs when beta cells fail to compensate for the increasing demand for insulin3–6. Understanding and harnessing this innate capacity represents a promising strategy to prevent and treat diabetes, yet mechanistic insight into the functional compensation process remains limited.
We and others previously demonstrated a critical role for the tumour suppressor Liver kinase B1 (LKB1) as a central regulator of critical aspects of beta cell biology, including cell size, proliferation, and insulin secretion7–9. Biochemical and genetic evidence indicates that LKB1 phosphorylates and activates AMPK, a key regulator of cellular energy metabolism, as well as a large family of AMPK-related kinases. In this regard, while we showed that loss of AMPK activity directly underlies the beta cell hypertrophy and increase in insulin content in LKB1 beta cell knockout mice, precisely how LKB1 regulates insulin secretion is still unclear.
Salt inducible kinase 2 (SIK2) is a AMPK family member that was originally identified by its homology to SIK1, which accumulated in the adrenal glands of rats fed a high salt diet10. Since then SIK2 has been implicated in diverse biological scenarios, including melanogenesis, mitotic spindle formation, liver steatosis, neuronal survival, cancer progression, and gluconeogenesis11–19. SIK2 is thought to exert its biological effects via regulation of gene expression by phosphorylation and inhibition of Creb-regulated transcriptional coactivator (CRTC) proteins, transcriptional coactivators for cyclic AMP response element binding protein (CREB), which itself is essential for beta cell function and survival20–22.
To gain insight into the role of SIK2 in the adult beta cell, we generated an inducible, beta cell-specific knockout model and report here that SIK2 is required for glucose-induced insulin secretion and is essential for adaptive beta cell functional compensation in models of hyperglycemia/obesity. We delineate a pathway wherein SIK2 phosphorylates the cyclin-dependent kinase 5 regulator 1 (CDK5R1, also known as p35), leading to its ubiquitination by the E3 ligase PJA2 (also known as praja2), required for activation of calcium entry and insulin secretion.
Results
Ablation of Sik2 in adult beta cells results in glucose intolerance
To gain insight into the role of SIK2 in the beta cell, we generated mice with floxed Sik2 alleles and mated them to mice carrying the Pdx1-CreER transgene to generate Sik2 adult beta cell knockout (SABKO) mice. PCR analysis confirmed the specific ablation of Sik2 gene in islets and not in any other metabolic tissue (Figure 1a). Western blotting for SIK2 in isolated islets, cerebral cortex, and hypothalamus confirmed that SIK2 protein loss occurred only in the islets of SABKO mice (Figure 1b). Furthermore, SABKO mice displayed nearly complete loss of Sik2 mRNA compared to control Sik2loxP/loxP littermates (S/S), while mRNA levels for the remaining SIKs, SIK1 and SIK3, were unchanged (Supplementary Fig. 1a). While islets from SABKO mice displayed normal morphology and insulin staining (Figure 1c), AMPK-mTOR signalling and CRTC2-CREB activity (Supplementary Fig. 1b–g), SABKO mice displayed elevated blood glucose due to a 30% reduction in plasma insulin after refeeding (Figure 1d). These changes were seen in both male and female SABKO animals only after tamoxifen treatment, without a change in body weight or insulin sensitivity (Supplementary Fig. 2a–g).
Figure 1. Deletion of Sik2 in adult beta cells leads to glucose intolerance due to impaired stimulus-dependent insulin secretion.
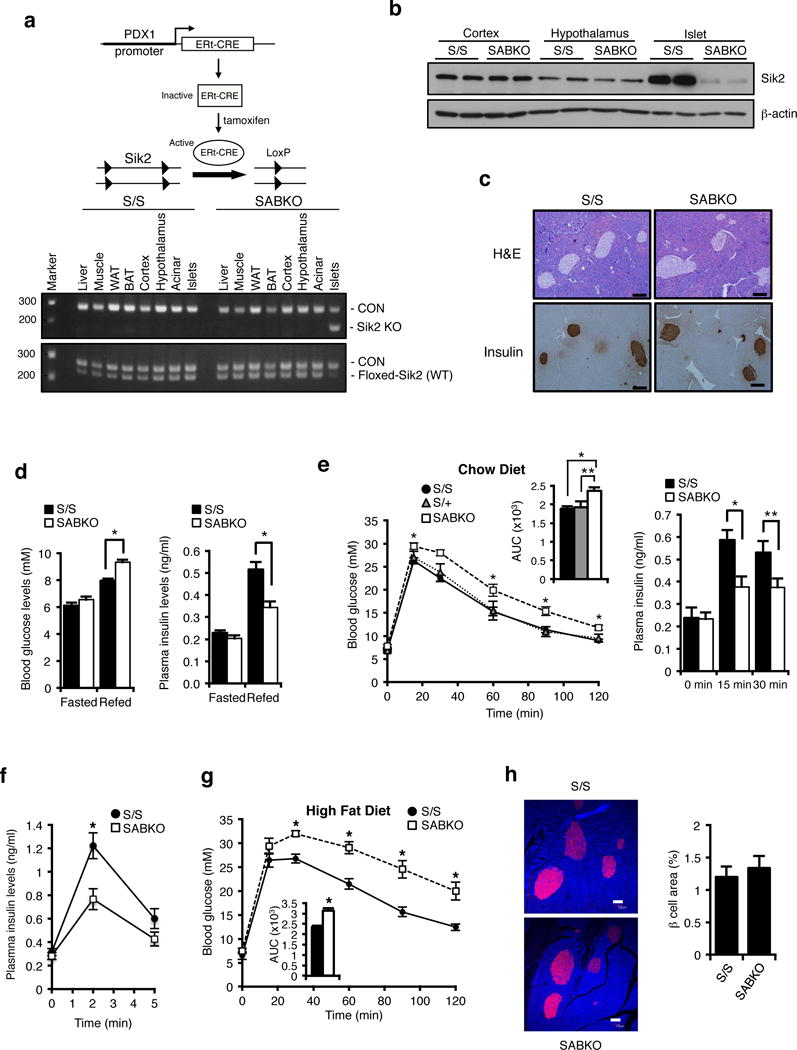
(a) (Top) Adult Sik2loxP/loxP mice carrying the Pdx1-CreERt2 transgene were injected with tamoxifen to induce β cell specific deletion of Sik2. (Bottom) PCR analysis of genomic DNA from various tissues in S/S and SABKO mice. (b) Western blot analysis of SIK2 levels from extracts of cortex, hypothalamus, and islets in S/S and SABKO mice. (c). (Top) Pancreatic sections from control S/S and SABKO mice stained with H&E. Bar = 100 um. (Bottom) Immunostaining of pancreatic sections of control S/S and SABKO mice stained with insulin antibody. Bar = 100 um. (d) (Left) Blood glucose levels of fasted and 2 h refed control (S/S, n=31 mice) and SABKO (n=34 mice) animals were measured 1 week after tamoxifen treatment. (Right) Plasma insulin levels after 2 h of refeeding in control (S/S, n=20 mice) and SABKO (n=12 mice) animals. (e) (Left) Glucose tolerance test (2 mg glucose/g, IP injection) for tamoxifen-treated S/S (n=31), S/+ (n=6 mice), and SABKO (n=26 mice) mice. Blood glucose concentrations were determined at indicated times. Area under the curves (AUC) is shown at top right. (Right) Plasma insulin levels at 15 min and 30 min post glucose injection during GTT for control S/S (n=13 mice) and SABKO (n=13 mice) animals. (f) Plasma insulin levels at 2 min and 5 min after L-arginine injection (1 mg/g body weight) in S/S (n=12 mice) and SABKO (n=11 mice) animals. (g) Glucose tolerance test on control S/S (n=9 mice) and SABKO (n=8 mice) animals after 16 weeks on HFD. Area under the curve (AUC) is shown. (h) (Left) Immunostaining of pancreatic sections of control S/S and SABKO mice after 20 weeks on HFD. Sections were stained with insulin antibody (red) and CellMask Blue cytoplasmic/nuclear stain (blue). Bar = 100 um. (Right) Quantification of beta cell area in S/S (n=4 mice) and SABKO (n=4 mice) mice. All error bars represent s.e.m. Statistical significance for all data was determined using two-tailed unpaired Student’s t-test (* p < 0.01, ** p < 0.05). (a–c) Data are representative of two independent experiments. The statistics source data for (h) is provided in Supplementary Table 1.
Dynamic analysis of glucose clearance in SABKO mice compared to controls was similarly impaired, which we attributed to a 30–40% reduction in plasma insulin levels (Figure 1e, Supplementary Fig. 2h–2k). Insulin secretion triggered directly by arginine injection was also attenuated in SABKO mice, indicating that loss of SIK2 in beta cells causes a direct insulin secretion defect in vivo (Figure 1f). To provoke an increased functional response from the β cell, control and SABKO mice were fed a high fat diet (HFD) to mimic conditions of human metabolic syndrome. While all animals had indistinguishable body weights and food intake after 17–18 weeks on HFD (Supplementary Fig. 3a, b), SABKO animals had significantly elevated blood glucose and lower plasma insulin levels after refeeding (Supplementary Fig. 3c, d). Interestingly, SABKO mice on HFD also displayed a pronounced deficiency in glucose clearance compared to control animals (Figure 1g), which again correlated with reduced plasma insulin (Supplementary Fig. 3e) and became worse with time on HFD (Supplementary Fig. 3f). These defects were not due to a reduction in beta cell mass (Figure 1h and Supplementary Fig. 3g), or rates of proliferation or apoptosis (Supplementary Fig. 3h–k).
First phase insulin secretion is impaired in SABKO islets
As insulin content in SABKO islets was also unchanged (Figure 2a), we suspected that defective insulin secretion may underlie the impaired glucose clearance phenotype. Static glucose-stimulated insulin secretion (GSIS) assays revealed that isolated islets lacking SIK2 secrete ~40% less insulin following stimulation with glucose (Figure 2b). Furthermore, acute inactivation of SIK2 in control islets with lentiviral shRNA targeting SIK2 reduced GSIS to levels observed from SABKO islets (Figure 2b) without affecting content (Supplementary Fig. 4a). A reduction in GSIS was also observed in islets following treatment with the pan-Sik inhibitor HG-9-91-01 (Figure 2c and Supplementary Fig. 4b), indicating that SIK2 and not SIK1 or SIK3 is specifically required in the beta cell for insulin secretion. We confirmed these results in the glucose-responsive insulinoma cell line MIN6, in which SIK2 silencing impaired GSIS (Supplementary Fig. 4c), and overexpression of SIK2 WT but not a kinase-dead SIK2 mutant increased both basal and GSIS without changing insulin content (Figure 2d and Supplementary Fig. 4d, e). Analysis of secretion dynamics from control and SABKO islets by perifusion showed that SABKO beta cells secreted less insulin in the first phase following stimulation with high glucose as well as following direct membrane depolarization with KCl (Figure 2e), which was also observed in static GSIS assays (Figure 2f). Glucose-stimulated insulin secretion involves oxidation of nutrients and consequent generation of ATP, cell membrane depolarization, extracellular calcium influx, and ultimately insulin granule release23–25. Both mitochondrial respiration (oxygen consumption, OCR) and extracellular acidification rate (ECAR) were unchanged in SIK2 knockdown MIN6 cells, indicating that the defect in insulin secretion does not result from impaired cellular energetics or metabolism (Supplementary Fig. 4f, g). Taken together, we conclude that there is specific requirement for SIK2 during first phase insulin secretion.
Figure 2. SIK2 is required for glucose-stimulated insulin secretion at a step downstream of depolarization.
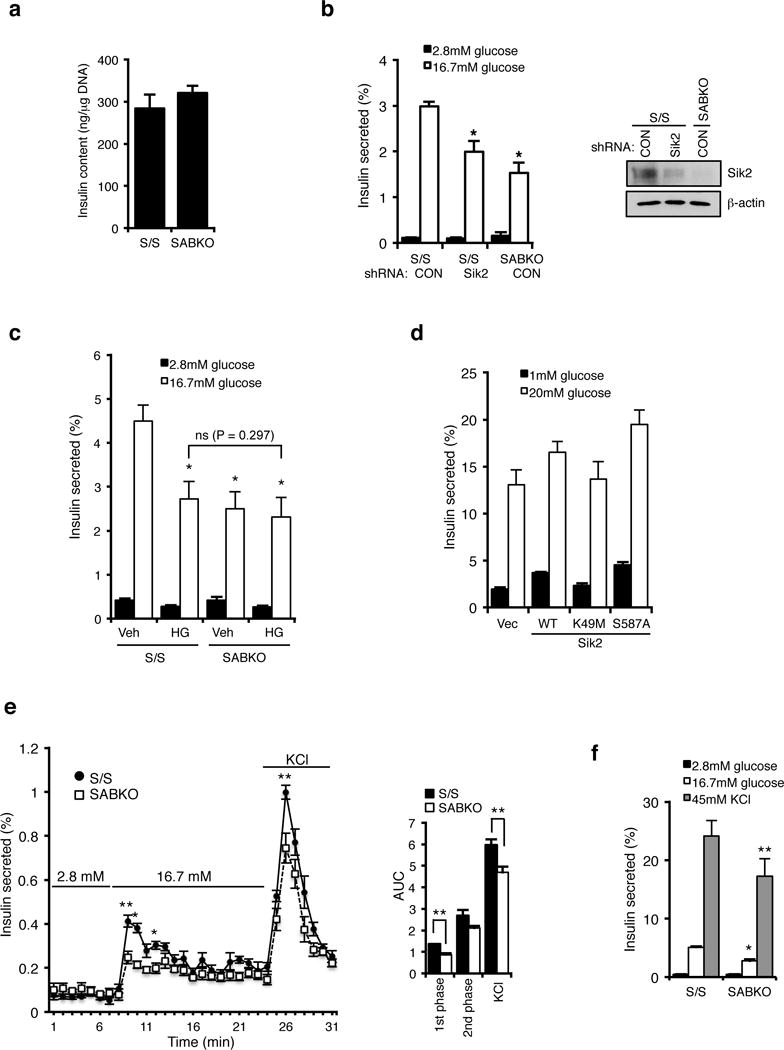
(a) Insulin content (ng insulin/μg DNA) is unchanged in control S/S (n= 3 mice) and SABKO (n= 3 mice) islets. (b) (Left) Insulin secretion from S/S (n= 3 mice for each condition) and SABKO (n= 3 mice) islets infected with control or SIK2 shRNA. Islets were treated with low (2.8 mM) and high (16.7 mM) glucose for 1 hr. (Right) Western blot analysis of SIK2 levels in islets indicated in the left panel. Data is representative of three independent experiments. (c) Insulin secretion from S/S (n= 3 mice for each condition) and SABKO (n= 3 mice for each condition) islets pre-treated with DMSO or pan-Sik inhibitor HG-9-91-01 (0.5 μM) for 24 hr followed by incubation with low (2.8 mM, 1 hr) and high (16.7 mM, 1hr) glucose in the presence or absence of 0.5 μM HG-9-91-01. (d) Insulin secretion from MIN6 cells infected with SIK2 WT, kinase inactive (K49M), or constitutively active (S587A) mutant. Cells were treated with low (1 mM) and high (20 mM) glucose for 1 hr. Data are mean ± s.d. from n=3 technical replicates from a single experiment, and are representative of three independent experiments with consistent results. (e) Glucose stimulated insulin secretion assay by perifusion of 75 islets from control S/S (n=3 mice) and SABKO (n=3 mice) mice. (Left) Percentage of total islet insulin secretion in each fraction following treatment with indicated amount of glucose or KCl is shown. (Right) Histogram showing area under the curves for perifusion GSIS data is shown, separated into first phase (8–12 min) and second phase (12–24 min) high glucose (16.7 mM) and response to depolarization (45 mM KCl). (f) Insulin secretion from S/S (n=3 mice) and SABKO (n=3 mice) islets treated with low (2.8 mM) and high (16.7 mM) glucose, and 45 mM KCl for 1 hr. All error bars represent s.d. Statistical significance for all data was determined using two-tailed unpaired Student’s t-test (* p < 0.01, ** p < 0.05). The statistics source data for (a–c and f) are provided in Supplementary Table 1.
SIK2 phosphorylates CDK5R1/p35
These data prompted us to identify a SIK2 target required for first phase insulin secretion at a step downstream of mitochondrial metabolism. We identified an LXBS/TXSXXXL motif, the consensus phosphorylation site for SIK220, surrounding Ser91 of Cyclin dependent kinase 5 regulatory subunit 1 (CDK5R1, also known as p35; Figure 3a). p35 is an activator of the atypical cell cycle kinase CDK5, which is enriched in the nervous system and also inhibits insulin secretion in the beta cell by blocking calcium ion influx26–29. We confirmed that FLAG-SIK2 WT, but not a kinase-dead FLAG-SIK2 mutant, directly phosphorylates recombinant p35 WT in vitro (Figure 3b), which is prevented by mutation of Ser91 to Ala (Figure 3c). When we evaluated the effect of a panel of inhibitors targeting SIKs, AMPKs, CDKs, CAMK, and PKA in this setting, only MRT199665 and HG-9-91-01, which share overlapping specificity for all SIKs1-3, blocked p35 phosphorylation (Figure 3d). To rule out that a kinase copurifying with SIK2 was responsible for the phosphorylation of p35 at Ser91, we used recombinant SIK2 protein purified from baculovirus-infected insect cells and again only p35 WT, but not the S91A mutant, was phosphorylated (Figure 3e). Furthermore, phosphorylation of p35 was blocked by treatment with the Sik inhibitor HG-9-91-01 (Figure 3e). Western blotting with phospho-specific Ser91 antibody revealed that silencing SIK2 reduced phosphorylation of overexpressed p35-V5 at Ser91 in MIN6 cells (Figure 3f). Detection of phosphoSer91 on endogenous p35 proved more challenging, however, we noticed that when SIK2 was silenced endogenous p35 protein accumulated (Figure 3g). When we included of the 26S proteasome inhibitor MG132 in the culture medium we detected phosphoSer91 on endogenous p35, which was reduced when SIK2 was silenced (Figure 3h). Taken together, these data indicate that SIK2 directly phosphorylates p35 at Ser91.
Figure 3. SIK2 phosphorylates CDK5R1/p35.
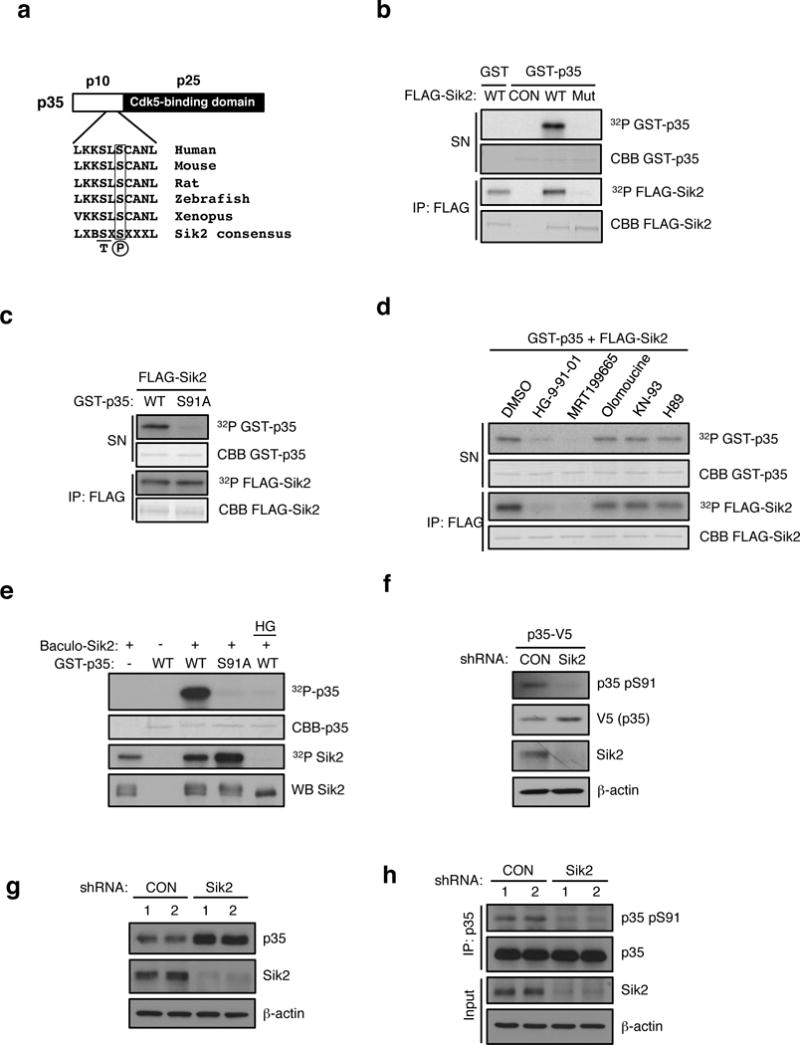
(a) Schematic of p35 showing N-terminal p10 domain, C-terminal p25 CDK5 binding domain and the location of Ser 91. Conservation of consensus SIK2 phosphorylation site at Ser91 of p35 using standard single letter amino acid nomenclature is shown. B= basic residue, X = any amino acid. (b) In vitro kinase assay using FLAG-SIK2 wild type (WT) or K49M kinase dead mutant (Mut) showing incorporation of 32P into full-length GST-p35 in the reaction supernatant. Autophosphorylation and coomassie blue staining of immunoprecipitated FLAG-SIK2 protein remaining on beads is shown in bottom two panels. CON = Empty vector control. (c) In vitro kinase assay using immunoprecipitates of FLAG-SIK2 and GST-p35 WT and S91A mutant as substrates. 32P and coomassie blue (CBB) staining of GST-p35 substrates and immunoprecipitated FLAG-SIK2 are shown. (d) In vitro kinase assay was performed with FLAG-SIK2 and GST-p35 WT in the presence of DMSO, HG-9-91-01 (100 nM), MRT199665 (200 nM), Olomoucine (60 μM), KN-93 (10 μM), or H89(1 μM). 32P and coomassie blue (CBB) staining of GST-p35 substrates and immunoprecipitated FLAG-SIK2 are shown. (e) In vitro kinase assay was performed with GST-p35 (WT and S91A) and recombinant SIK2 purified from Sf9 cells infected with baculovirus in the presence or absence of HG-9-91-01 (100 nM). (f) Western blot analysis of pSer91 levels on p35-V5 in MIN6 cells infected with non-targeting control (CON) or SIK2 shRNA with anti-p35 pSer91 antibody. (g) Western blot analysis of endogenous p35 levels in SIK2 knockdown MIN6 cells. (h) Western blot anaylsis of pSer91 levels in IPs of endogenous p35 in control or SIK2 shRNA expressing MIN6 cells treated with MG132 (10 uM for 24h). All western blot data are representative of three independent experiments with consistent results.
PJA2 ubiquitinates CDK5R1 (p35)
We next evaluated the role of the phosphorylation at Ser91 by SIK2 in the regulation of p35 protein stability. When we overexpressed SIK2, levels of p35 decreased, an effect that required the kinase activity of SIK2 and Ser91 of p35 (Figure 4a). To test if SIK2 triggers degradation of p35 following phosphorylation at Ser91, we monitored p35 levels in the presence of MG13230. Following MG132 treatment, p35 levels increased even in the presence of SIK2 WT, indicating that phosphorylation of p35 at Ser91 by SIK2 leads to p35 turnover by the proteasome (Figure 4a). When cells were treated with MG132, we detected poly-ubiquitination of p35-V5 WT but not the Ser91Ala mutant (Figure 4b), demonstrating that phosphorylation of p35 by SIK2 leads to its polyubiquitination. Consistent with this, p35 protein also accumulated in SABKO islets as well as in wt islets following pharmacological inhibition of SIKs with HG-9-91-01 (Figure 4c). Silencing of AMPK alpha1, LKB1, SIK1 or SIK3 in MIN6 cells had no effect on p35 accumulation, thus we conclude that SIK2 has a specific role in regulating p35 stability (as with GSIS, shown above; Supplementary Fig. 5a–c). We next used a proteomic approach to identify proteins that interact with p35, and we identified PJA2 (also known as Praja2 or Neurodap1)31 as a candidate ubiquitin E3 ligase for p35. Whereas silencing PJA2 led to the accumulation of endogenous p35 (Figure 4d), overexpression of FLAG-PJA2 WT but not a catalytically-inactive mutant reduced levels of p35-V5 protein, an effect that was blocked by MG132 treatment (Figure 4e). Importantly, silencing either SIK2 or PJA2 resulted in a reduction in poly-ubiquitnation of p35 (Figure 4f). Furthermore, silencing PJA2 prevented degradation of p35 that occurred in cells overxpressing SIK2 (Figure 4g). Taken together, these data show that SIK2 reduces p35 protein abundance by promoting its ubiquitination by the E3 ligase PJA2.
Figure 4. PJA2 ubiquitinates CDK5R1/p35.
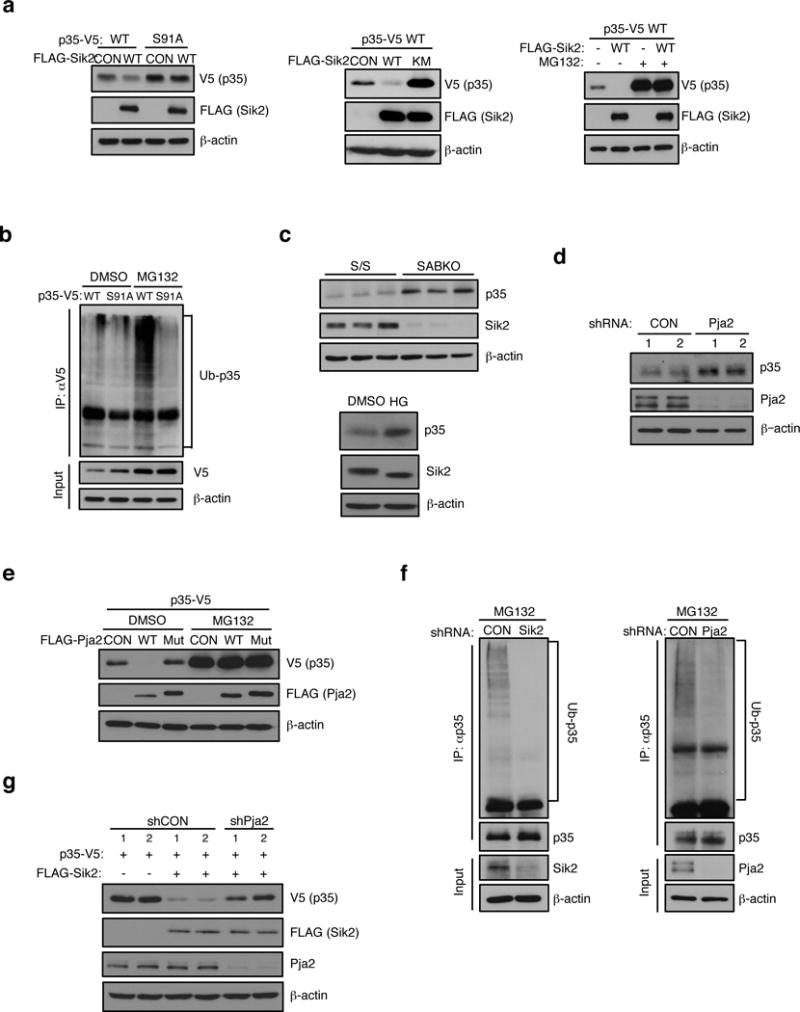
(a) (Left) Western blot analysis of p35-V5 and S91A mutant levels in HEK293T cells expressing empty vector control or FLAG-SIK2 cDNA. (Middle) Western blot analysis showing levels of p35-V5 in extracts from HEK293T transfectant co-expressing empty vector control (CON), FLAG-SIK2 WT or K49M mutant (Mut). (Right) Western blot analysis of p35-V5 levels in extracts from HEK293T transfectants coexpressing empty vector (−) or FLAG-SIK2 WT. The effect of treatment with DMSO control (−) or MG132 proteasome inhibitor (10 μM for 24 h) is shown. (b) Western blot analysis of poly-ubiquitination levels on p35-V5 immunoprecipitated from HEK293T cells expressing p35-V5 WT or S91A mutant cDNA. Treatment with DMSO or MG132 (10 μM for 24 h) is indicated. (c). (Top) Western blot analysis of endogenous p35 levels in SABKO islets. (Bottom) Western blot analysis of p35 expression in mouse islets treated with DMSO or 0.5 μM HG-9-91-01 for 24 h. (d) Western blot analysis of endogenous p35 levels in mouse islets infected with PJA2 shRNA. (e) Western blot analysis of p35-V5 levels in extracts from MIN6 cells coexpressing empty vector (−) or FLAG-PJA2 WT or the ring-domain mutant (C633A/C670A, Mut). The effect of treatment with DMSO control (−) or MG132 (20 μM for 24 h) is shown. (f) (Left) Western blot analysis showing poly-Ub levels in p35 immunoprecipitates isolated from MIN6 cell extracts following infection with non-targeting control (CON) or SIK2 shRNA. Cells were treated with 20 μM MG132 for 24 h. (Right) Western blot analysis showing poly-Ub levels in p35 immunoprecipitates isolated from MIN6 cell extracts following infection with non-targeting control (CON) or PJA2 shRNA. Cells were treated with 20 μM MG132 for 24 h. (g) Western blot analysis of p35-V5 levels in extracts from HEK293T transfectants coexpressing FLAG-SIK2 WT together with or without shRNA targeting PJA2. All western blot data are representative of three independent experiments with consistent results.
The SIK2-p35-PJA2 complex is required for calcium mobilization in the beta cell
We next wanted to determine the consequence of modulating SIK2-p35 signalling on beta cell function. Consistent with a previous report26, silencing p35 enhanced insulin secretion in MIN6 cells cultured in high glucose without affecting insulin content (Figure 5a and Supplementary Fig. 6a). In contrast, overexpression of p35 WT reduced GSIS, an effect that was more pronounced with the Ser91A construct (Figure 5b and Supplementary Fig. 6b). Silencing SIK2 in MIN6 cells increased phosphorylation of Ser783 on the critical p35-CDK5 target voltage-dependent calcium channel (VDCC) (Figure 5c), which correlates with inhibition of channel activity26. A similar increase in pVDCC signal was also observed in SABKO islets (Supplementary Fig. 6c). We observed reduced calcium influx following overexpression of p35 (Figure 5d) or silencing SIK2 (Figure 5e) in MIN6 cells, consistent with a requirement for SIK2 to turnover p35. Silencing p35 in wt islets similarly led to an increase in calcium influx, and rescued the impaired calcium entry phenotype observed in SABKO islets (Figure 5f). Furthermore, PJA2 knockdown similarly resulted in an increase in pVDCC levels and impaired calcium entry in MIN6 cells (Figures 5g–5h). Coimmunoprecipitation experiments demonstrated that not only SIK2 and p35, but p35 and PJA2 form a complex in MIN6 cells (Figure 5i). Taken together, we conclude that the signalling cassette consisting of SIK2-p35-PJA2 regulates calcium entry in the beta cell via phosphorylation of VDCC in response to glucose.
Figure 5. The SIK2-p35-PJA2 complex is required for calcium mobilization in the beta cell.
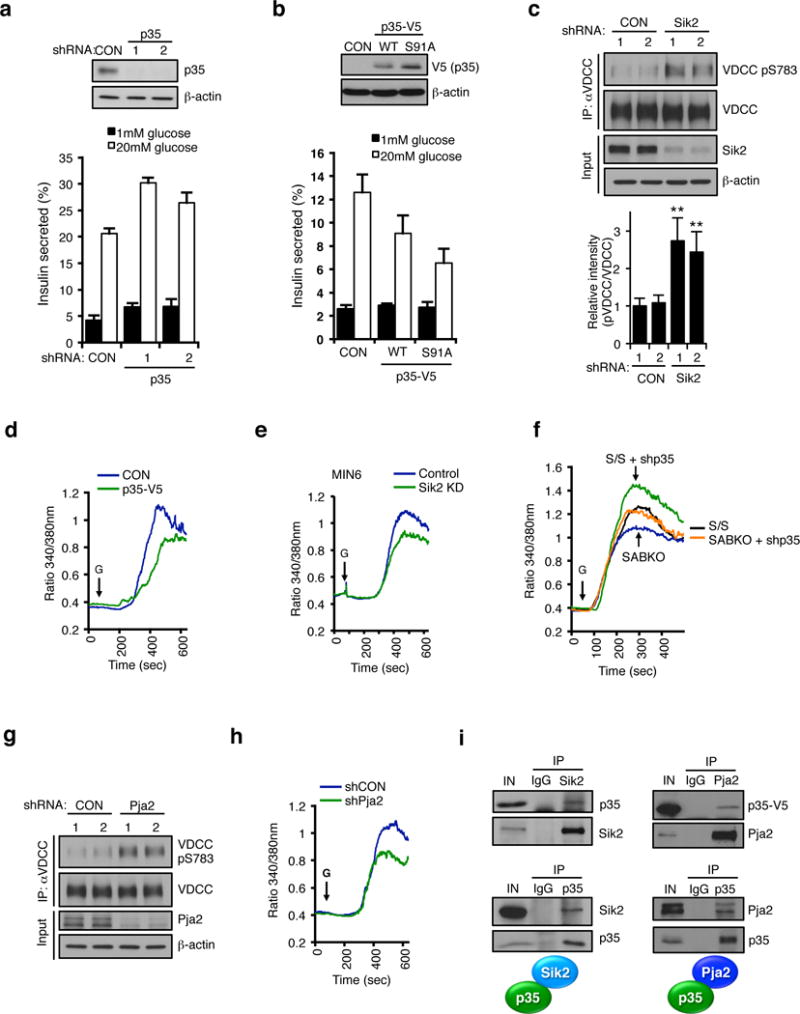
(a) (Top) Western blot of p35 levels in MIN6 cells infected with lentivirus expressing non-targeting control (CON) or p35 shRNA. (Bottom) GSIS assay in control or p35 knockdown MIN6 cells. (b) (Top) Western blot of p35-V5 levels in MIN6 cells infected with lentivirus expressing empty vector (CON), p35-V5 WT or S91A and (bottom) corresponding GSIS assay. Data in a and b are mean ± s.d. from n=3 technical replicates from a single experiment, and are representative of three independent experiments with consistent results. (c) (Top) Western blot showing pSer783 levels on VDCC immunoprecipitated from control or SIK2 knockdown MIN6 cells. (Bottom) Histogram showing relative intensity of VDCC phosphorylation levels normalized to total VDCC. Data is mean ± s.d. from n=3 independent experiments. (d and e) Real time intracellular calcium measurements in (d) control and p35-overexpressing or (e) SIK2 knockdown MIN6 cells. Data is from a single experiment performed in triplicate, representative of three experiments. (f) Real time intracellular calcium measurements in dissociated islet cells from S/S control and SABKO mice following infection with control or p35 shRNA. Data are averaged from n=3 experiments with > 150 total cells per genotype. (g) Western blot showing pSer783 levels on VDCC immunoprecipitated from control or PJA2 knockdown MIN6 cells. (h) Real time intracellular calcium measurements with Fura-2 dye in control and PJA2 knockdown MIN6 cells. Data is from a single experiment performed in triplicate, representative of three experiments. (i) (Top left) Western blot of immunoprecipitates of enodgenous SIK2 and IgG control from MIN6 cell extracts for presence of endogenous p35. (Bottom left) Western blot of immunoprecipitates of endogenous p35 and IgG control from MIN6 cells. (Top right) Western blot of immunoprecipitates of endogenous PJA2 from extracts of HEK293T cells expressing p35-V5. (Bottom right) Western blot of immunoprecipitates of endogenous p35 and IgG control from MIN6 cell extracts for presence of endogenous PJA2. All error bars represent s.d. Statistical significance for all data was determined using two-tailed unpaired Student’s t-test (** p < 0.05). All western blot data are representative of three independent experiments with consistent results. The statistics source data for (c) is provided in Supplementary Table 1.
The SIK2-p35-PJA2 complex is required for insulin secretion
As noted above, calcium entry is a critical trigger in the classical GSIS pathway. This prompted us to look at the requirement for the SIK2-p35-PJA2 complex in insulin secretion. Silencing p35 restored normal insulin secretion in SABKO islets (Figure 6a) as did pharmacological inhibition of CDKs with olomoucine (Figure 6b). For its part, silencing PJA2 also reduced GSIS in MIN6 cells and islets by 50%, without reducing insulin content (Figures 6c, Supplementary Fig. 7a–c). Importantly, silencing p35 in PJA2 knockdown cells rescued the insulin secretion defect (Figure 6d), as did treatment with olomoucine (Figure 6e), consistent with the notion that PJA2 promotes GSIS by turning over p35. Taken together, these data support a direct role for the SIK2-PJA2-p35 cassette in the regulation of insulin secretion in the beta cell.
Figure 6. The SIK2-p35-PJA2 complex is required for insulin secretion.
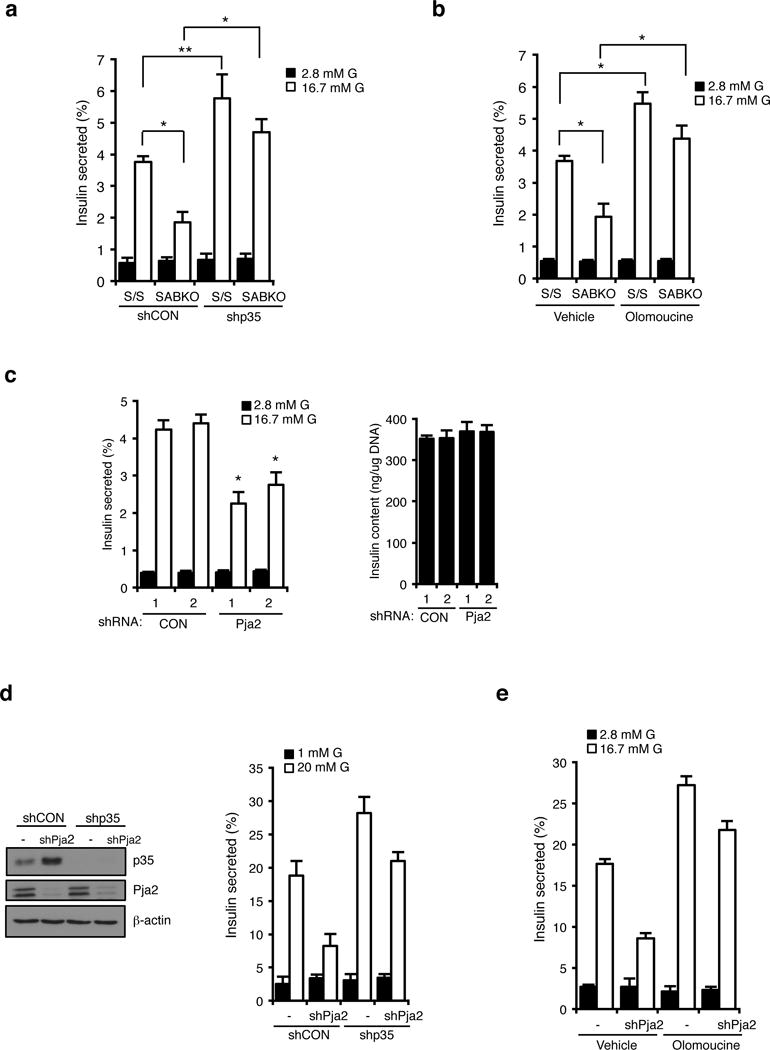
(a) Percentage of insulin secretion in S/S (n=3 mice for each condition) and SABKO (n=3 mice for each condition) islets infected with non-targeting control (CON) or p35 shRNA after treatment with 2.8 mM and 16.7 mM glucose. (b) Insulin secretion in S/S (n=3 mice for each condition) and SABKO (n=3 mice for each condition) islets treated with DMSO (vehicle) or olomoucine. S/S and SABKO islets were treated with DMSO or olomoucine (50 μM) for 1.5 h before GSIS assay. Islets were then treated with 2.8 mM and 16.7 mM glucose in the presence or absence of olomoucine. (c). (Left) Insulin secretion from islets (n=3 mice for each condition) infected with non-targeting control (CON) or PJA2 shRNA after treatment with 2.8 mM and 16.7 mM glucose. (Right) Insulin content from cells shown in the left panel. (d) (Left) Western blot anaylsis of p35 levels in MIN6 cells infected with lentivirus expressing non-targeting control (CON) or PJA2 shRNA together with or without p35 shRNA. Data is representative of three independent experiments. (Right) Percentage of insulin secretion (normalized to total insulin content) in MIN6 cells infected with lentivirus expressing non-targeting control (CON) or PJA2 shRNA together with or without p35 shRNA. Cells were treated with 1 mM or 20 mM glucose. (e) GSIS assay showing percent insulin secretion (normalized to total insulin content) in control or PJA2 knockdown MIN6 cells treated with DMSO (vehicle) or olomoucine. Cells were treated with DMSO or olomoucine (50 μM) for 1.5 h before GSIS assay. Cells were then treated with 1 mM and 20 mM glucose in the presence or absence of olomoucine (50 μM). Data in d and e are mean ± s.d. from n=3 technical replicates from a single experiment, and are representative of three independent experiments with consistent results. All error bars represent s.d. Statistical significance for all data was determined using two-tailed unpaired Student’s t-test (* p < 0.01, ** p < 0.05). The statistics source data for (a–c) are provided in Supplementary Table 1.
SIK2 is required for beta cell functional compensation
The requirement of SIK2 for effective glucose homeostasis prompted us to evaluate the status of SIK2 in animal models of obesity and prediabetes. Western blot analysis of SIK2 protein in islets from ob/ob mice32 increases 2.5-fold compared to islets from B6 controls, without a change in SIK2 mRNA (Supplementary Fig. 8a). Elevated SIK2 with a concomitant reduction in p35 was also seen in islets from mice on a HFD (Figure 7b). Importantly, silencing SIK2 in ob/ob islets reduced the insulin hypersecretion phenotype of islets from ob/ob mice (Figure 7c, d). As insulin content was also unaffected by SIK2 silencing in this context (Supplementary Fig. 8b), we conclude that functional adaptation of islets to hyperglycemia requires higher levels of SIK2. The common feature of hyperglycemia in the ob/ob and HFD models prompted us to evaluate whether SIK2 is regulated by glucose. SIK2 protein levels were low after overnight culture in low glucose and increased directly as a function of ambient glucose concentration, an effect that was blocked by treatment with 2-deoxyglucose, an inhibitor of glycolysis (Figure 7e). Whereas treatment of MIN6 cells with the mTOR inhibitor rapamycin had no effect in this setting, proteasome inhibition in MIN6 and islets increased SIK2 levels in low glucose (Figure 7f). As in vitro kinase activity present in SIK2 immunoprecipitates correlated with the amount of total SIK2 protein, we conclude that the intrinsic activity of SIK2 is not regulated by glucose (Figure 7g). SIK2 mRNA levels were the same in wt and ob/ob mice suggesting that transcription or mRNA stability played no role in this setting (Supplementary Fig. 8c). We next analyzed SIK2 protein levels in islets isolated from diabetic mice that display impaired GSIS. Interestingly, SIK2 protein is reduced in islets from db/db mice on the BKS-Dock7m background, indicating an uncoupling between glucose levels and SIK2 accumulation (Figure 7h). These data are consistent with the notion that stabilization of SIK2 is required to maintain insulin secretion in the face of dietary or genetic predisposition to obesity.
Figure 7. SIK2 is essential for beta cells to meet insulin demand in models of metabolic syndrome.
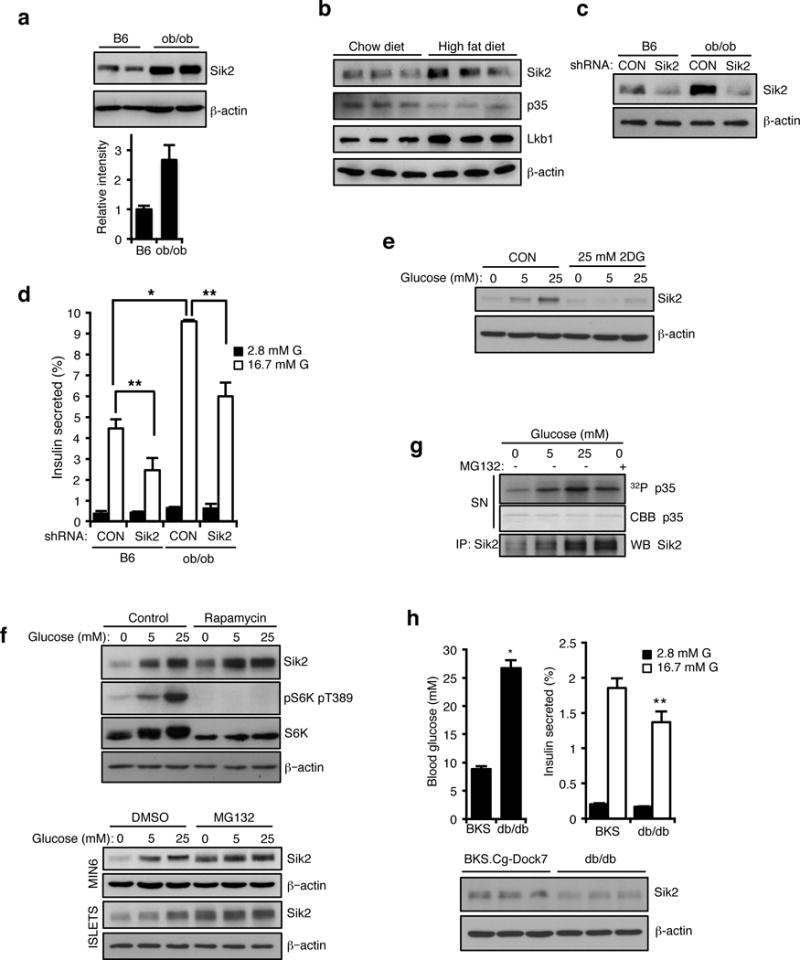
(a) (Top) Western blot analysis of SIK2 protein levels in islets from control C57BL/6J (B6) and B6.V-Lepob/J (ob/ob) mice. (Bottom) Histogram showing relative intensity of SIK2 protein levels normalized to beta actin loading control. Data are mean ± s.d. from n=2 mice from a single experiment, and are representative of three independent experiments with consistent results. (b) Western blot analysis for SIK2, p35 and Lkb1 levels in islets of high fat diet-fed (20 weeks) and age matched control (normal chow diet) mice. (c) Western blot analysis of SIK2 protein levels in islets from B6 and ob/ob mice infected with non-targeting control or SIK2 shRNA lentivirus. (d) Static GSIS assay using islets from B6 and ob/ob mice infected with non-targeting control or SIK2 shRNA lentivirus (n=3 mice for each condition). Error bars represent s.d. (e) Western blot anaylsis of SIK2 levels. MIN6 cells were cultured for 15 h in 0, 5 or 25 mM glucose in the presence or absence of 2DG (25 mM). (f) (Top) Western blot anaylsis of SIK2 levels. MIN6 cells were pretreated with 100 nM rapamycin or EtOH (control) for 3h, then cultured for 15 h in 0, 5 or 25 mM glucose in the presence or absence of 100 nM rapamycin. (Bottom) Western blot anaylsis of SIK2 levels. MIN6 cells and mouse islets were pre-treated with MG132 (20 μM) or DMSO vehicle for 3h, then cultured for 15 h in 0, 5 or 25 mM glucose in the presence or absence of MG132. (g) In vitro kinase assay using GST-p35 WT and SIK2 purified from MIN6 cells cultured for 15 h in 0, 5 or 25 mM glucose together with or without 20 μM MG132. (h) Top left: Blood glucose levels of random-fed BKS.Cg-Dock7 (BKS) and BKS.Cg-Dock7m +/+ Leprdb/J (db/db) mice (n=6 for both strains). Error bars represent s.e.m. Top right: Percentage of insulin secretion from islets of BKS and db/db mice (n=3 mice for both strains). Error bars represent s.d. (Bottom) Western blot analysis of SIK2 protein levels in islets from BKS and db/db mice. Statistical significance for all data was determined using two-tailed unpaired Student’s t-test (* p < 0.01, ** p < 0.05). All western blot data are representative of two or three independent experiments with consistent results. The statistics source data for (d and h) are provided in Supplementary Table 1.
Discussion
Here we have delineated a pathway essential for first phase insulin secretion and for functional compensation in the beta cell wherein calcium entry is coordinated in response to hyperglycemia through SIK2 and PJA2. Following glucose stimulation, this kinase-E3 ligase module targets p35, an essential activator of CDK5, in order to relieve inhibitory phosphorylation of VDCC and activate calcium influx26. The linearity of this pathway is supported by genetic evidence, whereby silencing p35 can rescue defects in calcium entry and insulin secretion resulting from silencing SIK2 or PJA2. Interestingly, PJA2 is activated by the second messenger cAMP33 which accumulates in the beta cell in response to incretin hormone stimulation and crosstalk with glucose-calcium signalling34. Our data place PJA2 in the insulin secretion pathway and raise the possibility that PJA2 is a central regulator of beta cell function.
The AMPK family consists of 14 kinases, including three SIKs, raising the possibility of redundancy within the family35. However, regulation of both p35 levels and insulin secretion appears to be unique to SIK2, as knockdown of SIK1 and SIK3 had no effect in this regard (Supplementary Fig. 8d, e), and treatment with pan-Sik inhibitor had no affect on insulin secretion in islets lacking SIK2. In all cell types AMPK is activated under low energy conditions to mobilize energy stores, and in the beta cell acts to restrain protein synthesis and insulin production under the control of the upstream AMPK kinase, LKB17,8,36. In contrast to LKB1, ablation of SIK2 in the beta cell had no effect on mTOR signalling, and in return, mTOR signalling appears not to contribute to SIK2 accumulation in high glucose. Interestingly, recent work has also shown that AMPK family member Sad-A (also known as Brsk2) mediates mTOR signalling to promote beta cell size and function37. For its part, AMPK activity was reduced yet its protein levels unchanged in high glucose, consistent with our previous work7. Our observation that SIK2 protein accumulates in excess glucose without effect on its intrinsic activity indicates that there is diversity within the AMPK family both in the response to nutrient status and effects on insulin secretion. As SIK2 is ubiquitously expressed, its responsiveness to ambient glucose concentrations has implications for scenarios in which cells depend on glycolytic metabolism as a primary energy source. Taken together, our data indicate that the net effect of glucose stimulation on the AMPK family is to promote insulin production and secretion through inhibition of AMPK and accumulation of SIK2 (Figure 8).
Figure 8. Regulation of SIK2 and AMPK by glucose in the beta cell.
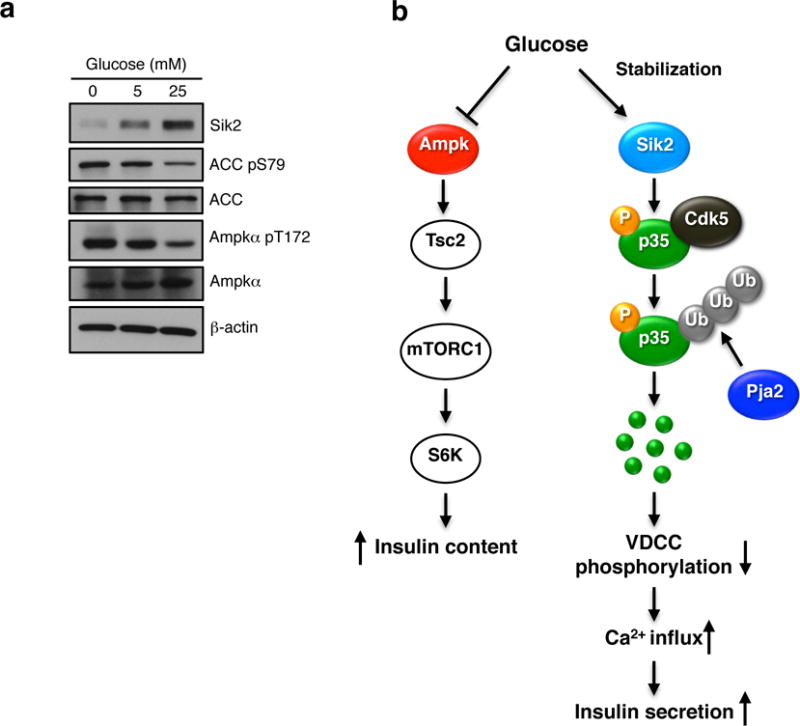
(a) Western blot anaylsis showing SIK2 and phosphorylation of ACC and AMPKα in MIN6 cells cultured for 15 h in 0, 5 or 25 mM glucose. Data is representative of three independent experiments. (b) Integrated model for AMPK-family mediated control of beta cell function. Left: the AMPK-mTOR signalling: In response to glucose, AMPK catalytic activity (left) is inhibited due to increase in ATP: AMP ratio. This in turn leads to depression of TORC1 and insulin biosynthesis. Right: the SIK2-p35-CDK5-PJA2 pathway: unlike AMPK, SIK2 protein, and in turn net activity, is increased in high glucose. SIK2 phosphorylates p35 at Ser91 which triggers its ubiquitination by the E3 ligase PJA2, resulting in activation of calcium signalling and insulin secretion.
From an organism perspective, our data demonstrating that SIK2 is required for insulin secretion are consistent with the recent observation that SIK2 and SIK3 in Drosophila regulate anabolic effects via antagonism of the Hippo pathway38. While SIKs have also been reported to regulate energy storage in the brain and fat in the fly via repression of FOXO1 and CREB gene expression programs39–41, we observe unaltered CRTC2 phosphorylation and CREB target gene activation in SABKO islets. Thus SIK2 functions to regulate secretory events, but not CREB-dependent gene expression in the beta cell.
Our work provides a mechanistic framework for understanding beta cell functional adaptation. Dynamic analyses of human islet function following nutrient stimulation has revealed that impaired first phase insulin release is a hallmark of T2D, and progressive impairment of first phase secretion occurs as beta cells fail to compensate for the increasing demand3–5,42–47. That SIK2 is causally linked to enhanced insulin secretion is highlighted by the reversal of hypersecretion following silencing of SIK2 in islets isolated from obese mice. Furthermore, the accumulation of SIK2 in islets from compensating mice and the reduction of SIK2 in islets from diabetic mice that show secretory impairment highlights the importance of this pathway.
Neurons and beta cells share several common features, including ontology, electrical excitability, and use of cAMP and calcium signalling pathways48. Unlike SIK2, p35 appears exclusively in brain and islets, and accumulates in both tissues in the absence of SIK2, indicating conservation of the p35-SIK2 cassette in these settings (Supplementary Fig. 8f, g) In the brain, the p35-CDK5 complex is require for CNS development and the pain response, and aberrant CDK5 activity is associated with ischemic stress and Alzheimer’s disease49. Emerging evidence indicates that CDK5 is also key metabolic regulator50 and potential target for anti-diabetes drugs51. Our work provides the first link between the energy sensing LKB1-AMPK family and p35-CDK5, two key regulatory networks in excitable cell biology, and suggest that activating SIK2 and PJA2 in the beta cell may be beneficial for treatment of symptoms associated with insulin deficiency.
Supplementary Material
Acknowledgments
We would like to thank members of the Screaton Lab and M. Wheeler for helpful comments and Z-Y. Lin for proteomic analysis. We acknowledge the Department of Laboratory Medicine and Pathology Core Facility at the University of Ottawa and Kim Yates at University of Ottawa Animal Care for technical assistance. This work was supported by grants from the Canadian Diabetes Association (#OG-3-11-3328-RS), the Canadian Institutes of Health Research (CIHR) MOP-97772, and Canadian Foundation for Innovation (CFI) to R.A.S., operating grant from CIHR (MOP-84314) to A-C.G., by a Japan Society for the Promotion of Science Fellows to JS (10J00366), and Canadian Diabetes Studentship to A.F. A-C.G. holds the Canada Research Chair in Functional Proteomics and the Lea Reichmann Chair in Cancer Proteomics. R.A.S. holds the Canada Research Chair in Apoptotic Signalling.
Footnotes
AUTHOR CONTRIBUTIONS
J.S. performed most of the experiments. A.F. helped with physiological analyses and performed metabolic analyses in Supplementary Fig. 4f–g. C.R. assisted with animal husbandry and physiological analyses. S.B. performed imaging based analysis of MIN6 cell proliferation in Supplementary Figs 3h–j and beta cell mass in Fig 1h and Supplementary Fig. 3g. C.D., M.A., and N.B assisted with the design and generation of Sik2 knockout construct. A-C.G. performed proteomic analyses of the p35 complex. S-P.Y. generated Sik2fl/fl and Sik2ko/+ animals. R.A.S. conceived and supervised the study. J.S. and R.A.S. wrote the manuscript.
References
- 1.Nolan CJ, Damm P, Prentki M. Type 2 diabetes across generations: from pathophysiology to prevention and management. Lancet. 2011;378:169–181. doi: 10.1016/S0140-6736(11)60614-4. [DOI] [PubMed] [Google Scholar]
- 2.Florez JC. Newly identified loci highlight beta cell dysfunction as a key cause of type 2 diabetes: where are the insulin resistance genes? Diabetologia. 2008;51:1100–1110. doi: 10.1007/s00125-008-1025-9. [DOI] [PubMed] [Google Scholar]
- 3.Nolan CJ. Failure of islet beta-cell compensation for insulin resistance causes type 2 diabetes: what causes non-alcoholic fatty liver disease and non-alcoholic steatohepatitis? Journal of gastroenterology and hepatology. 2010;25:1594–1597. doi: 10.1111/j.1440-1746.2010.06473.x. [DOI] [PubMed] [Google Scholar]
- 4.Kahn SE. The relative contributions of insulin resistance and beta-cell dysfunction to the pathophysiology of Type 2 diabetes. Diabetologia. 2003;46:3–19. doi: 10.1007/s00125-002-1009-0. [DOI] [PubMed] [Google Scholar]
- 5.Prentki M, Nolan CJ. Islet beta cell failure in type 2 diabetes. J Clin Invest. 2006;116:1802–1812. doi: 10.1172/JCI29103. [DOI] [PMC free article] [PubMed] [Google Scholar]
- 6.Mari A, et al. Impaired beta cell glucose sensitivity rather than inadequate compensation for insulin resistance is the dominant defect in glucose intolerance. Diabetologia. 2010;53:749–756. doi: 10.1007/s00125-009-1647-6. [DOI] [PubMed] [Google Scholar]
- 7.Fu A, et al. Loss of Lkb1 in adult beta cells increases beta cell mass and enhances glucose tolerance in mice. Cell Metab. 2009;10:285–295. doi: 10.1016/j.cmet.2009.08.008. [DOI] [PubMed] [Google Scholar]
- 8.Granot Z, et al. LKB1 regulates pancreatic beta cell size, polarity, and function. Cell Metab. 2009;10:296–308. doi: 10.1016/j.cmet.2009.08.010. [DOI] [PMC free article] [PubMed] [Google Scholar]
- 9.Sun G, et al. LKB1 deletion with the RIP2.Cre transgene modifies pancreatic beta-cell morphology and enhances insulin secretion in vivo. Am J Physiol Endocrinol Metab. 2010;298:E1261–1273. doi: 10.1152/ajpendo.00100.2010. [DOI] [PMC free article] [PubMed] [Google Scholar]
- 10.Wang Z, Takemori H, Halder SK, Nonaka Y, Okamoto M. Cloning of a novel kinase (SIK) of the SNF1/AMPK family from high salt diet-treated rat adrenal. FEBS Lett. 1999;453:135–139. doi: 10.1016/s0014-5793(99)00708-5. [DOI] [PubMed] [Google Scholar]
- 11.Bricambert J, et al. Salt-inducible kinase 2 links transcriptional coactivator p300 phosphorylation to the prevention of ChREBP-dependent hepatic steatosis in mice. J Clin Invest. 2010;120:4316–4331. doi: 10.1172/JCI41624. [DOI] [PMC free article] [PubMed] [Google Scholar]
- 12.Horike N, et al. Downregulation of SIK2 expression promotes the melanogenic program in mice. Pigment Cell Melanoma Res. 2010;23:809–819. doi: 10.1111/j.1755-148X.2010.00760.x. [DOI] [PubMed] [Google Scholar]
- 13.Ahmed AA, et al. SIK2 is a centrosome kinase required for bipolar mitotic spindle formation that provides a potential target for therapy in ovarian cancer. Cancer Cell. 2010;18:109–121. doi: 10.1016/j.ccr.2010.06.018. [DOI] [PMC free article] [PubMed] [Google Scholar]
- 14.Liu Y, et al. Salt-inducible kinase is involved in the regulation of corticotropin-releasing hormone transcription in hypothalamic neurons in rats. Endocrinology. 2012;153:223–233. doi: 10.1210/en.2011-1404. [DOI] [PMC free article] [PubMed] [Google Scholar]
- 15.Muraoka M, et al. Involvement of SIK2/TORC2 signaling cascade in the regulation of insulin-induced PGC-1alpha and UCP-1 gene expression in brown adipocytes. Am J Physiol Endocrinol Metab. 2009;296:E1430–1439. doi: 10.1152/ajpendo.00024.2009. [DOI] [PubMed] [Google Scholar]
- 16.Dentin R, et al. Insulin modulates gluconeogenesis by inhibition of the coactivator TORC2. Nature. 2007;449:366–369. doi: 10.1038/nature06128. [DOI] [PubMed] [Google Scholar]
- 17.Nagel S, et al. Amplification at 11q23 targets protein kinase SIK2 in diffuse large B-cell lymphoma. Leuk Lymphoma. 2010;51:881–891. doi: 10.3109/10428191003699878. [DOI] [PubMed] [Google Scholar]
- 18.Imielinski M, et al. Mapping the hallmarks of lung adenocarcinoma with massively parallel sequencing. Cell. 2012;150:1107–1120. doi: 10.1016/j.cell.2012.08.029. [DOI] [PMC free article] [PubMed] [Google Scholar]
- 19.Sasaki T, et al. SIK2 is a key regulator for neuronal survival after ischemia via TORC1-CREB. Neuron. 2011;69:106–119. doi: 10.1016/j.neuron.2010.12.004. [DOI] [PubMed] [Google Scholar]
- 20.Screaton RA, et al. The CREB coactivator TORC2 functions as a calcium- and cAMP-sensitive coincidence detector. Cell. 2004;119:61–74. doi: 10.1016/j.cell.2004.09.015. [DOI] [PubMed] [Google Scholar]
- 21.Jhala US, et al. cAMP promotes pancreatic beta-cell survival via CREB-mediated induction of IRS2. Genes Dev. 2003;17:1575–1580. doi: 10.1101/gad.1097103. [DOI] [PMC free article] [PubMed] [Google Scholar]
- 22.Eberhard CE, Fu A, Reeks C, Screaton RA. CRTC2 Is Required for beta-Cell Function and Proliferation. Endocrinology. 2013;154:2308–2317. doi: 10.1210/en.2012-2088. [DOI] [PubMed] [Google Scholar]
- 23.Newgard CB, McGarry JD. Metabolic coupling factors in pancreatic beta-cell signal transduction. Annu Rev Biochem. 1995;64:689–719. doi: 10.1146/annurev.bi.64.070195.003353. [DOI] [PubMed] [Google Scholar]
- 24.MacDonald PE, Joseph JW, Rorsman P. Glucose-sensing mechanisms in pancreatic beta-cells. Philos Trans R Soc Lond B Biol Sci. 2005;360:2211–2225. doi: 10.1098/rstb.2005.1762. [DOI] [PMC free article] [PubMed] [Google Scholar]
- 25.Newsholme P, Bender K, Kiely A, Brennan L. Amino acid metabolism, insulin secretion and diabetes. Biochem Soc Trans. 2007;35:1180–1186. doi: 10.1042/BST0351180. [DOI] [PubMed] [Google Scholar]
- 26.Wei FY, et al. Cdk5-dependent regulation of glucose-stimulated insulin secretion. Nat Med. 2005;11:1104–1108. doi: 10.1038/nm1299. [DOI] [PubMed] [Google Scholar]
- 27.Lew J, et al. A brain-specific activator of cyclin-dependent kinase 5. Nature. 1994;371:423–426. doi: 10.1038/371423a0. [DOI] [PubMed] [Google Scholar]
- 28.Tsai LH, Delalle I, Caviness VS, Jr, Chae T, Harlow E. p35 is a neural-specific regulatory subunit of cyclin-dependent kinase 5. Nature. 1994;371:419–423. doi: 10.1038/371419a0. [DOI] [PubMed] [Google Scholar]
- 29.Cheung ZH, Ip NY. Cdk5: a multifaceted kinase in neurodegenerative diseases. Trends Cell Biol. 2012;22:169–175. doi: 10.1016/j.tcb.2011.11.003. [DOI] [PubMed] [Google Scholar]
- 30.Patrick GN, Zhou P, Kwon YT, Howley PM, Tsai LH. p35, the neuronal-specific activator of cyclin-dependent kinase 5 (Cdk5) is degraded by the ubiquitin-proteasome pathway. J Biol Chem. 1998;273:24057–24064. doi: 10.1074/jbc.273.37.24057. [DOI] [PubMed] [Google Scholar]
- 31.Nakayama M, Miyake T, Gahara Y, Ohara O, Kitamura T. A novel RING-H2 motif protein downregulated by axotomy: its characteristic localization at the postsynaptic density of axosomatic synapse. J Neurosci. 1995;15:5238–5248. doi: 10.1523/JNEUROSCI.15-07-05238.1995. [DOI] [PMC free article] [PubMed] [Google Scholar]
- 32.Zhang Y, et al. Positional cloning of the mouse obese gene and its human homologue. Nature. 1994;372:425–432. doi: 10.1038/372425a0. [DOI] [PubMed] [Google Scholar]
- 33.Lignitto L, et al. Control of PKA stability and signalling by the RING ligase praja2. Nat Cell Biol. 2011;13:412–422. doi: 10.1038/ncb2209. [DOI] [PubMed] [Google Scholar]
- 34.Holz GG, Habener JF. Signal transduction crosstalk in the endocrine system: pancreatic beta-cells and the glucose competence concept. Trends Biochem Sci. 1992;17:388–393. doi: 10.1016/0968-0004(92)90006-u. [DOI] [PMC free article] [PubMed] [Google Scholar]
- 35.Manning G, Whyte DB, Martinez R, Hunter T, Sudarsanam S. The protein kinase complement of the human genome. Science. 2002;298:1912–1934. doi: 10.1126/science.1075762. [DOI] [PubMed] [Google Scholar]
- 36.Fu A, Eberhard CE, Screaton RA. Role of AMPK in pancreatic beta cell function. Molecular and cellular endocrinology. 2013;366:127–134. doi: 10.1016/j.mce.2012.06.020. [DOI] [PubMed] [Google Scholar]
- 37.Nie J, et al. SAD-A kinase controls islet beta-cell size and function as a mediator of mTORC1 signaling. Proc Natl Acad Sci U S A. 2013;110:13857–13862. doi: 10.1073/pnas.1307698110. [DOI] [PMC free article] [PubMed] [Google Scholar]
- 38.Wehr MC, et al. Salt-inducible kinases regulate growth through the Hippo signalling pathway in Drosophila. Nat Cell Biol. 2013;15:61–71. doi: 10.1038/ncb2658. [DOI] [PMC free article] [PubMed] [Google Scholar]
- 39.Wang B, et al. A hormone-dependent module regulating energy balance. Cell. 2011;145:596–606. doi: 10.1016/j.cell.2011.04.013. [DOI] [PMC free article] [PubMed] [Google Scholar]
- 40.Wang B, et al. The insulin-regulated CREB coactivator TORC promotes stress resistance in Drosophila. Cell Metab. 2008;7:434–444. doi: 10.1016/j.cmet.2008.02.010. [DOI] [PMC free article] [PubMed] [Google Scholar]
- 41.Choi S, Kim W, Chung J. Drosophila salt-inducible kinase (SIK) regulates starvation resistance through cAMP-response element-binding protein (CREB)-regulated transcription coactivator (CRTC) J Biol Chem. 2011;286:2658–2664. doi: 10.1074/jbc.C110.119222. [DOI] [PMC free article] [PubMed] [Google Scholar]
- 42.Polonsky KS, et al. Abnormal patterns of insulin secretion in non-insulin-dependent diabetes mellitus. N Engl J Med. 1988;318:1231–1239. doi: 10.1056/NEJM198805123181903. [DOI] [PubMed] [Google Scholar]
- 43.O’Rahilly S, Turner RC, Matthews DR. Impaired pulsatile secretion of insulin in relatives of patients with non-insulin-dependent diabetes. N Engl J Med. 1988;318:1225–1230. doi: 10.1056/NEJM198805123181902. [DOI] [PubMed] [Google Scholar]
- 44.Seino S, Shibasaki T, Minami K. Dynamics of insulin secretion and the clinical implications for obesity and diabetes. J Clin Invest. 2011;121:2118–2125. doi: 10.1172/JCI45680. [DOI] [PMC free article] [PubMed] [Google Scholar]
- 45.Byrne MM, Sturis J, Sobel RJ, Polonsky KS. Elevated plasma glucose 2 h postchallenge predicts defects in beta-cell function. The American journal of physiology. 1996;270:E572–579. doi: 10.1152/ajpendo.1996.270.4.E572. [DOI] [PubMed] [Google Scholar]
- 46.Weyer C, Bogardus C, Mott DM, Pratley RE. The natural history of insulin secretory dysfunction and insulin resistance in the pathogenesis of type 2 diabetes mellitus. J Clin Invest. 1999;104:787–794. doi: 10.1172/JCI7231. [DOI] [PMC free article] [PubMed] [Google Scholar]
- 47.Mitrakou A, et al. Role of reduced suppression of glucose production and diminished early insulin release in impaired glucose tolerance. N Engl J Med. 1992;326:22–29. doi: 10.1056/NEJM199201023260104. [DOI] [PubMed] [Google Scholar]
- 48.Rulifson EJ, Kim SK, Nusse R. Ablation of insulin-producing neurons in flies: growth and diabetic phenotypes. Science. 2002;296:1118–1120. doi: 10.1126/science.1070058. [DOI] [PubMed] [Google Scholar]
- 49.Su SC, Tsai LH. Cyclin-dependent kinases in brain development and disease. Annu Rev Cell Dev Biol. 2011;27:465–491. doi: 10.1146/annurev-cellbio-092910-154023. [DOI] [PubMed] [Google Scholar]
- 50.Lalioti V, et al. The atypical kinase Cdk5 is activated by insulin, regulates the association between GLUT4 and E-Syt1, and modulates glucose transport in 3T3-L1 adipocytes. Proc Natl Acad Sci U S A. 2009;106:4249–4253. doi: 10.1073/pnas.0900218106. [DOI] [PMC free article] [PubMed] [Google Scholar]
- 51.Choi JH, et al. Antidiabetic actions of a non-agonist PPARgamma ligand blocking Cdk5-mediated phosphorylation. Nature. 2011;477:477–481. doi: 10.1038/nature10383. [DOI] [PMC free article] [PubMed] [Google Scholar]
Associated Data
This section collects any data citations, data availability statements, or supplementary materials included in this article.


