Abstract
In this study, primary cultured cerebral cortical neurons of Sprague-Dawley neonatal rats were treated with 0.25, 0.5, and 1.0 μM calmodulin-dependent protein kinase II inhibitor KN-93 after 50 μM N-methyl-D-aspartic acid-induced injury. Results showed that, compared with N-methyl-Daspartic acid-induced injury neurons, the activity of cells markedly increased, apoptosis was significantly reduced, leakage of lactate dehydrogenase decreased, and intracellular Ca2+ concentrations in neurons reduced after KN-93 treatment. The expression of caspase-3, phosphorylated calmodulin-dependent protein kinase II and total calmodulin-dependent protein kinase II protein decreased after KN-93 treatment. And the effect was apparent at a dose of 1.0 μM KN-93. Experimental findings suggest that KN-93 can induce a dose-dependent neuroprotective effect, and that the underlying mechanism may be related to the down-regulation of caspase-3 and calmodulin- dependent protein kinase II expression.
Keywords: neural regeneration, brain injury, calmodulin-dependent protein kinase II, KN-93, N-methyl-Daspartic acid, caspase-3, calcium ion, apoptosis, neuroprotection, grant-supported paper, photographs-containing paper, neuroregeneration
Research Highlights
KN-93, a calmodulin-dependent protein kinase II inhibitor, has a neuroprotective effect, and its underlying mechanism of action may be related to the down-regulation of caspase-3 and calmodulin-dependent protein kinase II expression.
Abbreviations
CaMKII, calmodulin-dependent protein kinase II; NMDA, N-methyl-D-aspartic acid; MAP-2, microtubuleassociated 2; NSE, neuron-specific enolase; LDH, lactate dehydrogenase; PI, propidium iodide
INTRODUCTION
Intracellular calcium ion ([Ca2+]i) balance is fundamental for normal electrophysiological activity of neurons in the central nervous system[1]. Recent studies have shown that an overload of intracellular calcium is a common cause of neuronal injury[2,3,4,5]. [Ca2+]i can relay signals that trigger apoptosis and has been shown to play an important role in the early period of apoptosis[6]. Activation by cleavage of the proteolytic enzymes caspases is a key step in the apoptotic process[7,8,9,10], and the upstream signaling pathways leading to assembly of the protein death complexes activated by caspases, may or may not be dependent on mitochondria. Therefore, the upstream signaling pathways that disrupt mitochondrial membrane potential and caspase activation are a matter of great interest. The involvement of glutamate receptors in promoting apoptotic cell death has been widely reported in neural cells in culture[11], which is a useful tool to evaluate neurotoxicity in isolated cells.
Calcium/calmodulin-dependent protein kinase II (CaMKII) is one of the main members in the Ca2+/CaM-regulated protein family, which includes two types, phospho-CaMKII (P-CaMKII) and non-P-CaMKII. CaMKII plays important biological roles in a number of pathophysiological processes[12,13]. Increasing evidence indicates that CaMKII inhibition reduces the injury- induced activation of caspase-3 and the traumatic brain injury-induced cell injury, as assessed by lesion volume, and attenuates behavioral outcomes evaluated by the motor test[14]. Therefore, studies investigating calcium overload and the relationship between P-CaMKII, CaMKII and caspase-3 may help prevent and treat central nervous disorders[15,16,17]. The present study aimed to investigate the possible mechanism resulting in changes to Ca2+, caspase-3, P-CaMKII, and CaMKII and to monitor the effect of the CaMKII inhibitor KN-93 at different concentrations on N-methyl-D-aspartic acid (NMDA)-treated neurons.
RESULTS
Morphology of primary cultured cortical neurons
Most cells adhered to the wall of the culture dish at 4 hours after plating. Cells appeared round with high refraction and no nuclei were observed following phase contrast microscopy. Cells exhibited one or two processes 24 hours after plating. Apophysis became more obvious and formed a net 72 hours later. After the addition of cytarabine, the growth of gliocytes was inhibited and neurons grew well. At 7 days, cells grew larger, were more convex, and had a high refraction. Cell bodies had clearly visible nuclei and nucleoli. Neuronal apophyses became thicker and longer with branches and formed an extensive network (Figure 1).
Figure 1.
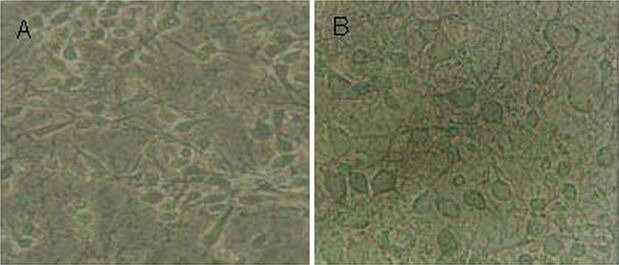
Morphology of primary cerebral cortical neurons (phase contrast microscope, × 200) cultured for 5 (A) and 7 days (B).
Cell bodies of primary cerebral cortical neurons were plump, processes were long and thick, and cells formed complete neural networks.
Identification of cultured cortical neurons by microtubule-associated protein 2 (MAP-2) and neuron-specific enolase (NSE) staining
For identification of cultured cortical neurons, cells were grown on glass coverslips pre-coated with poly-L-lysine and maintained for 7 days in proliferation growth medium. MAP-2 and NSE staining were performed. Over 93% of cells were MAP-2- and NSE-positive (Figure 2).
Figure 2.
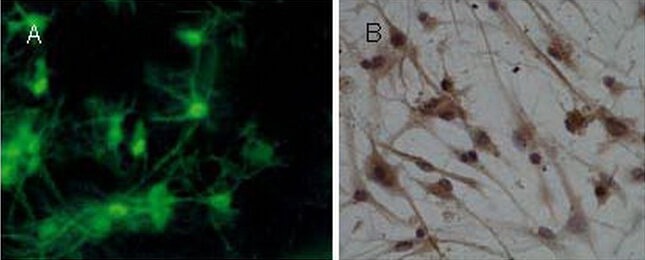
Identification of primary cortical neurons by microtubule-associated protein 2 (immunofluorescence staining, × 400) and neuron-specific enolase staining (immunocytochemical staining, × 400).
(A) Neurons exhibited abundant processes with multiple branches and several shorter, tapering dendrites. Nuclei stained green (microtubule-associated protein 2 expression).
(B) The cytoplasm and processes stained brown-yellow (neuron-specific enolase expression).
KN-93 improved the viability of cultured cortical neurons treated with NMDA (Figure 3)
Figure 3.
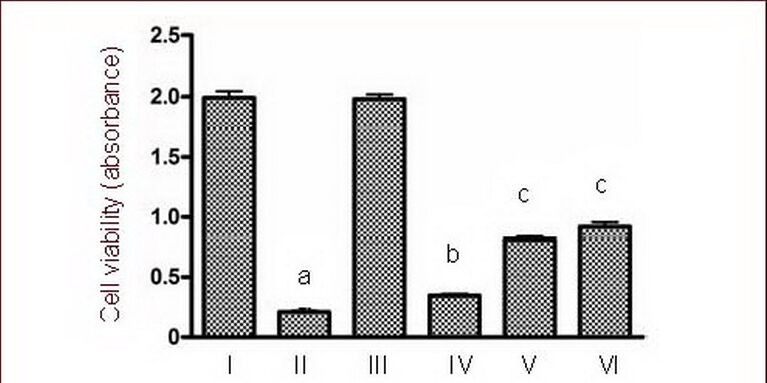
Effects of calmodulin-dependent protein kinase II inhibitor KN-93 on cultured cortical neuron viability following treatment with 50 μM NMDA using the MTT assay.
I–VI: Sham, NMDA, 0.5 μM KN-93, NMDA + 0.25 μM KN-93, NMDA + 0.5 μM KN-93, NMDA + 1.0 μM KN-93 groups.
Data are expressed as mean ± SD, n = 6 for each group. aP < 0.01, vs. sham group; bP < 0.05, cP < 0.01, vs. NMDA group using one-way analysis of variance.
NMDA: N-methyl-D-aspartic acid.
Evaluation of the effect of KN-93 on cortical neuron viability was carried out using the MTT colorimetric assay. Figure 3 shows the effect of 24 hours treatment with different concentrations of KN-93 following NMDA injury. In cultured cortical neurons, analysis indicated significant differences among groups. Cell viability in the NMDA group was significantly reduced compared with the sham group (P < 0.01). However, KN-93 (0.25, 0.5, and 1.0 μM) reversed NMDA-induced cell damage in cortical neurons and revealed a dose-dependent protective effect (P < 0.05, P < 0.01; Figure 3), especially in the high dose (1.0 μM KN-93) group.
KN-93 reduced lactate dehydrogenase (LDH) leakage following NMDA injury
Compared with the sham group, LDH leakage in the NMDA group was significantly increased (P < 0.01). LDH leakage in the KN-93 groups decreased significantly after NMDA injury (P < 0.05, P < 0.01; Figure 4), particularly in the high dose group.
Figure 4.
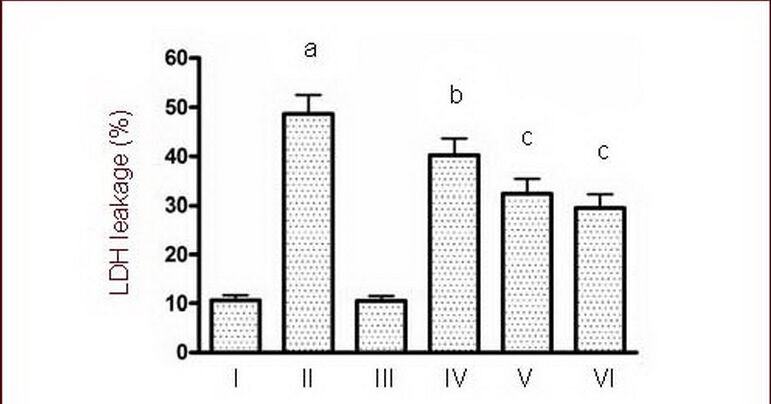
Effects of calmodulin-dependent protein kinase II inhibitor KN-93 on LDH leakage induced by 50 μM NMDA.
I–VI: Sham, NMDA, 0.5 μM KN-93, NMDA + 0.25 μM KN-93, NMDA + 0.5 μM KN-93, NMDA + 1.0 μM KN-93 groups.
Data are expressed as mean ± SD, n = 6 for each group. aP < 0.01, vs. sham group; bP < 0.05, cP < 0.01, vs. NMDA group using one-way analysis of variance.
NMDA: N-methyl-D-aspartic acid; LDH: lactate dehydrogenase.
KN-93 inhibited neuronal apoptosis induced by NMDA
TUNEL and propidium iodide (PI) double fluorescence staining revealed the presence of apoptotic cells following NMDA treatment, with apoptotic cells being TUNEL-positive only (green). Quantitative results showed a significant increase in neuronal apoptosis following exposure to NMDA (P < 0.01). However, KN-93 (0.25, 0.5, and 1.0 μM) significantly reduced NMDA-induced neuronal apoptosis in a dose-dependent manner (P < 0.05, P < 0.01; Figure 5), especially in the high dose group.
Figure 5.
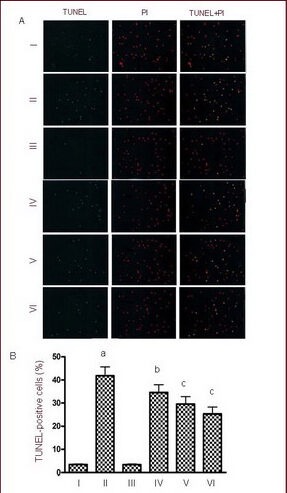
Effects of calmodulin-dependent protein kinase II inhibitor KN-93 on neuronal apoptosis induced by 50 μM NMDA as determined by TUNEL and propidium iodide (PI) double staining.
I–VI: Sham, NMDA, 0.5 μM KN-93, NMDA + 0.25 μM KN-93, NMDA + 0.5 μM KN-93, NMDA + 1.0 μM KN-93 groups.
(A) A small quantity of apoptotic neurons was observed in the sham group, and a large number of apoptotic neurons were present in the NMDA group. The number of apoptotic cells decreased significantly after 0.25, 0.5 and 1.0 μM KN-93 treatment. Green fluorescence indicates TUNEL-positive cells (apoptotic cells); red indicates PI-positive cells (necrosis cells); yellow is the overlap of the two staining images (× 400).
(B) Quantification of apoptotic cells. Data are expressed as mean ± SD, n = 6 for each group. aP < 0.01, vs. sham group; bP < 0.05, cP < 0.01, vs. NMDA group using one-way analysis of variance.
NMDA: N-methyl-D-aspartic acid.
Necrosis was further confirmed using PI staining, which specifically labeled condensed nuclei and acted as a marker for plasma membrane integrity. As shown in Figure 5, the number of necrotic cells exhibiting positive PI staining of the nuclei with intensive red fluorescence did not differ among groups (Figure 5).
KN-93 relieved [Ca2+]i overload in cultured cortical neurons treated with NMDA
Calcium influx is a critical molecular step in NMDA-induced apoptosis of cultured cortical neurons[18]. As shown in Figure 6, treatment with 50 μM NMDA caused a significant increase in [Ca2+]i (P < 0.01). This increase was blocked by the addition of 0.25, 0.5, 1.0 μM KN-93 (P < 0.05, P < 0.01; Figure 6). Furthermore, the concentration of [Ca2+]i decreased most significantly in the high dose group (1.0 μM).
Figure 6.
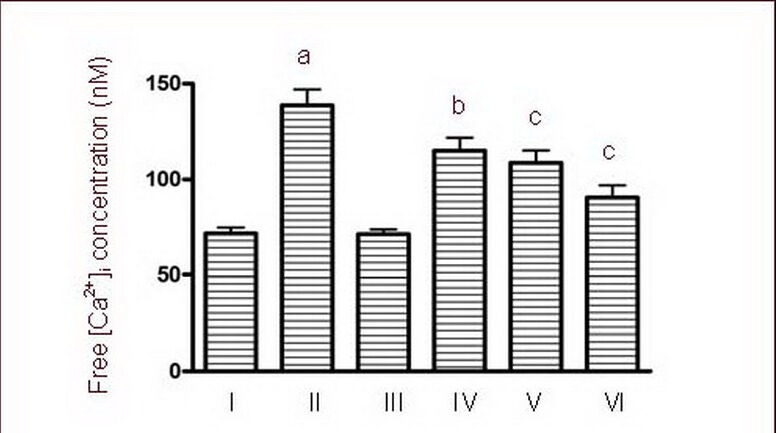
Effects of calmodulin-dependent protein kinase II inhibitor KN-93 on free [Ca2+]i concentrations of cultured cortical neurons induced by 50 μM NMDA.
I–VI: Sham, NMDA, 0.5 μM KN-93, NMDA + 0.25 μM KN-93, NMDA + 0.5 μM KN-93, NMDA + 1.0 μM KN-93 groups.
Data are expressed as mean ± SD, n = 6 for each group. aP < 0.01, vs. sham group; bP < 0.05, cP < 0.01, vs. NMDA group using one-way analysis of variance.
NMDA: N-methyl-D-aspartic acid.
Effect of KN-93 on procaspase-3 and caspase-3 expression in cultured cortical neurons induced by NMDA
Because caspase activation can occur after cytochrome c release from the mitochondria[19], proteolytic cleavage of procaspase-3 (32 kDa) to activated caspase-3 (17 kDa) was evaluated in cultured cortical neurons after NMDA exposure. Cortical neurons treated with NMDA resulted in caspase-3 activation, as observed by labeling of the 17 kDa fragment, which is the product of procaspase-3 (32 kDa) cleavage. NMDA-induced activation of caspase-3 in the execution phase of apoptosis in cortical neurons is thought to be upstream of the formation of condensed nuclei[20]. Our results further indicate that exposure of cells to NMDA results in an increase in caspase-3 (P < 0.01). Different concentrations of KN-93 may inhibit changes in caspase-3 in a dose-dependent manner (P < 0.01). Analysis of procaspase-3 following 24-hour treatment of cells with NMDA did not show any modulation of this enzyme (Figure 7).
Figure 7.
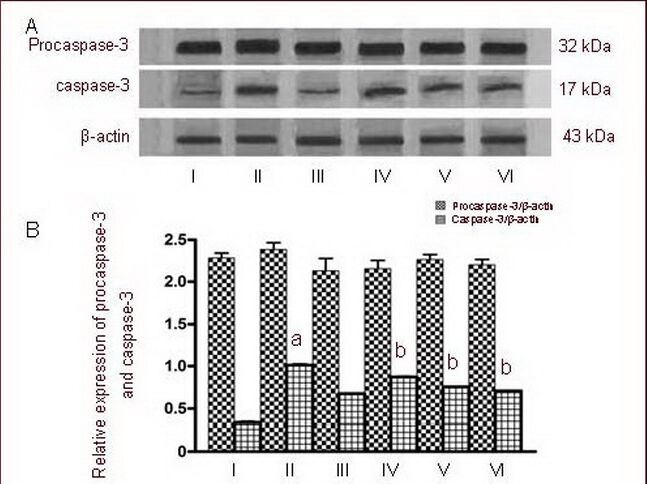
Effects of calmodulin-dependent protein kinase II inhibitor KN-93 on procaspase-3 and caspase-3 expression in cultured cortical neurons induced by 50 μM NMDA as determined by western blot.
I–VI: Sham, NMDA, 0.5 μM KN-93, NMDA + 0.25 μM KN-93, NMDA + 0.5 μM KN-93, NMDA + 1.0 μM KN-93 groups.
(A) Representative western blot of procaspase-3 (32 kDa) and activated caspase-3 (17 kDa) in cultured cortical neurons exposed to NMDA.
(B) Quantification of procaspase-3 and caspase-3 expression. Procaspase-3 and caspase-3 were determined by calculating the ratio of the absorbance value relative to β-actin.
Data are expressed as mean ± SD, n = 6 for each group. aP < 0.01, vs. sham group; bP < 0.01, vs. NMDA group using one-way analysis of variance.
NMDA: N-methyl-D-aspartic acid.
Effects of KN-93 on P-CaMKII and total-CaMKII expression levels in cultured cortical neurons treated with NMDA
The ability of NMDA to modulate the P-CaMKII and total-CaMKII was investigated by exposing cultured cortical neurons to NMDA and pretreating them with three different concentrations of KN-93 (0.25, 0.5 and 1.0 μM). The activation of P-CaMKII and total-CaMKII was determined by western blot using specific antibodies that recognize the phosphorylated form and the total form of these enzymes. Phosphorylated and total CaMKII levels were significantly greater after 24 hours of 50 μM NMDA treatment when compared to the control (P < 0.01). Following pretreatment with different concentrations of KN-93 (0.25, 0.5 and 1.0 μM), the two forms of CaMKII were significantly reduced (P < 0.01; Figure 8).
Figure 8.
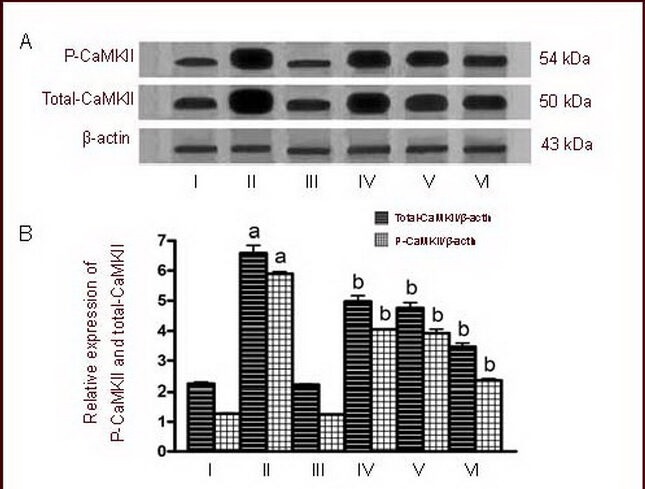
Effects of calmodulin-dependent protein kinase II inhibitor KN-93 on phospho-CaMKII (P-CaMKII) and total-CaMKII levels in cultured cortical neurons induced by 50 μM NMDA.
I–VI: Sham, NMDA, 0.5 μM KN-93, NMDA + 0.25 μM KN-93, NMDA + 0.5 μM KN-93, NMDA + 1.0 μM KN-93 groups.
(A) Representative western blot of P-CaMKII (54 kDa) and total-CaMKII (50 kDa) in cultured cortical neurons exposed to NMDA.
(B) Quantification of P-CaMKII and total-CaMKII expression. P-CaMKII and total-CaMKII were determined by calculating the ratio of absorbance value relative to β-actin.
Data are expressed as mean ± SD, n = 6 for each group. aP < 0.01, vs. sham group; bP < 0.01, vs. NMDA group using one-way analysis of variance.
NMDA: N-methyl-D-aspartic acid; CaMKII: calmodulin-dependent protein kinase II.
DISCUSSION
NMDA, the main excitatory neurotransmitter for neuronal and glial cells[21], is involved in fast excitatory transmission and plays important roles in neuronal functions such as plasticity and cognitive processes. The NMDA injury model replicates human epilepsy[22], ischemic stroke and other central nervous system disorders[23], all of which injure either neuronal and/or glial cells[24] through overstimulation of glutamate receptors. However, neuronal death after NMDA stimulation may involve both apoptosis and necrosis both in vitro and in vivo, which occurs across an insult-dependent continuum. In the present study, we prepared cortical neuronal cultures and measured the reduction of MTT and LDH release.
LDH is an important enzyme for energy metabolism, and is widely present in various tissues and organs. In recent years, LDH has been used more and more to assess the survival ratio of neurons after injury[25]. In this study, LDH activity in culture medium after NMDA-induced injury increased significantly when compared to the sham group. In addition, LDH release in the presence of different concentrations of KN-93 was significantly altered when compared to the NMDA group, which verified the validity of this model.
In our study, intracellular Ca2+ overload was one mechanism of neuronal damage. Intracellular free calcium concentrations in neurons and the change in free calcium concentration before and after NMDA injury were detected. The results showed that intracellular Ca2+ concentrations after neuronal injury were significantly higher than before treatment.
Caspases are aspartate-specific cysteine proteases, which play a pivotal role in apoptosis[26]. The caspase family consists of many homologues, such as caspase-1, caspase-2, and caspase-3. Among the members of caspases, caspase-3 has been suggested to play an important role in several models of apoptosis. In particular, analysis of caspase-3-deficient mice revealed a decrease in apoptosis in the developing brain, indicating that caspase-3 is necessary for tissue development and regulation of cell number[27]. Studies have shown that cysteine proteases (caspases) play an important role in apoptotic cell death in several neurodegenerative diseases[28,29]. Caspase-3 is considered to be the central and final apoptotic effector enzyme responsible for many of the biological and morphological features of apoptosis[30]. Caspase-3 usually exists in the cytosolic fraction of cells as an inactive precursor that is activated proteolytically by cleavage at a specific amino acid sequence to form the active enzyme, which is capable of cleaving several proteins that culminate in apoptotic cell death. Although these observations strongly indicate that caspase-3 is essential for apoptosis in mammalian cells, the mechanisms involved in caspase-3 regulation of the neuronal system remain to be elucidated. In the present model, cortical neurons were exposed to NMDA. As a result, NMDA induced neurotoxicity via cytochrome c release and caspase-3 activation. These apoptotic features were accompanied by the maintenance of plasma membrane integrity. Consistently, we have demonstrated that procaspase release and caspase-3 activation are induced by NMDA. NMDA-induced neurotoxicity has mainly been studied in vitro, in which NMDA evokes apoptosis depending on the experimental conditions. However, whether KN-93 can fully protect cortical cells against NMDA neurotoxicity, and whether injury is due to cell death resulting from apoptosis or necrosis or a mixture of the two processes remains to be investigated.
When intracellular Ca2+ levels overload, CaMKII is activated and autophosphorylation leads to an increase is P-CaMKII, rather than a decrease in non-P-CaMKII activity[31]. In the present study, we could not demonstrate a relationship between the NMDA-induced decrease in cellular viability, the activation of caspase-3, and CaMKII. However, the temporal correlation between these phenomena is strikingly evident. We only observed apoptosis following 24-hour NMDA-treatment, when caspase-3 and P-CaMKII levels increased. Therefore, it is possible that P-CaMKII and caspase-3 play a role in NMDA-induced toxicity.
In our study, to exclude the effect of KN-93 on normal neurons, we employed a KN-93 0.5 μM group. Results showed that under these conditions, cell viability and expression of caspase-3 and P-CaMKII were not significantly different compared with the sham group. In agreement with another study, we confirmed that KN-93, a specific inhibitor of CaMKII, is capable of suppressing CaMKII activity[32]. To investigate the role of KN-93, we used KN-93 to treat neurons. Our results showed that LDH activity in the KN-93-treated groups decreased significantly when compared with the NMDA-group. Intracellular Ca2+ concentrations in the KN-93 treatment groups decreased significantly, suggesting that KN-93 could inhibit the increase of intracellular Ca2+ concentration during secondary injury. However, the signal transduction mechanisms for this increase in intracellular Ca2+ concentration after injury remain unclear. As the expression of caspase-3 and CaMKII gradually decreases after injury, KN-93 plays a role as a neuroprotectant through reducing the calcium load of cortical neurons and decreasing the expression of caspase-3, P-CaMKII and total-CaMKII in a dose-dependent manner. Therefore, KN-93 has neuroprotective effects, which provides a theoretical basis for using neuroprotective agents for patients with central nervous system damage.
MATERIALS AND METHODS
Design
A comparative in vitro cell culture experiment.
Time and setting
The experiment was performed at the Laboratory of Liaoning Medical College, China, from December 2009 to July 2011.
Materials
Thirty-five, neonatal (≤ 24 hours) Sprague-Dawley rats of specific pathogen free grade, weighing 15 ± 5 g, were purchased from the Medical Laboratory Animal Center of Liaoning Medical College, China, with permission No. SCXK (Liao) 2003-0007. All experimental protocols were performed in accordance with the Guidance Suggestions for the Care and Use of Laboratory Animals, formulated by the Ministry of Science and Technology of China[33].
Methods
Isolation and primary culture of rat cortical neurons
Neonatal rats were soaked in 75% (v/v) ethanol for 1 minute and subsequently decapitated. The heads were pre-cooled in D-Hank's buffer, and the skull and meninges were removed under a microscope (Olympus, Tokyo, Japan), followed by separation of the cortex. Cortical tissue was washed three times in ice-cold D-Hank's buffer, and micro-scissors were used to carefully remove the tissue, which was placed in 2.5 g/L trypsin (Sigma, St. Louis, MO, USA) to digest for 10 minutes at 37°C. Digestion was terminated with fetal calf serum, followed by three washes in ice-cold D-Hank's buffer. Culture plate processing: Glass coverslips were placed into 6-well culture plates 1 day prior to cell culture. A total of 1 mL polylysine (0.01% (w/v)) was added to each well and allowed to incubate overnight, followed by draining and drying[34]. The wells were rinsed twice with D-Hank's buffer, followed by an appropriate amount of culture medium, and were allowed to reach the proper temperature (37°C) inside the incubator[35]. Serum-free medium, Neurobasal-A (Gibco; consisting of 2% (v/v) B27, 10 mM hydroxyethyl piperazine ethanesulfonic acid, 2 mM L-glutamine, 25 μM glutamate, and 1% (v/v) penicillin-streptomycin), was added and the cell suspension was gently triturated and then pushed through a mesh filter. A sample of the cell suspension (50 μL) was combined with 150 μL 2% (v/v) trypan blue (Wuhan Boster, Wuhan, China) and 200 μL PBS, mixed, and counted using a cell counter (Beijing Biosynthesis Biotechnology, Beijing, China). The number of living and dead cells was quantified under the microscope, revealing that > 70% were living cells[36]. Cells (1 × 10⁶/mL) were incubated in 2-mL culture medium at 37°C and maintained in 5% CO2 for 24 hours, after which the medium was replaced and non-adherent cells were discarded. The medium was replaced every 3 days. Cells were continuously cultured for 7 days and used for further experiments.
Identification of cortical neurons by MAP-2 and NSE
MAP-2 and NSE primary and secondary antibodies, purchased from Sigma, were utilized for immunocytochemistry staining. Positive cells exhibited green and brown staining under the light microscope[37]. Primary cultured cortical neurons, which were in an active growth phase, were digested and seeded onto cover slips in 6-well culture plates. The medium was removed when the cells reached 70–80% confluency. The cells were then placed in induction medium containing β-mercaptoethanol (Sigma) (induction for 1, 3, 5, and 8 hours). The coverslips were then removed from the culture plates and washed three times with PBS. The cells were fixed with 4% (w/v) paraformaldehyde for 30 minutes and washed three times with PBS (5 minutes each). After discarding the fixative solution, cells were incubated in 0.1% (v/v) Triton-X 100 for 8 minutes, washed three times with PBS for 3 minutes each, incubated in 3% (v/v) H2O2 for 10 minutes to eliminate endogenous peroxidase, and washed three times with PBS for 3 minutes each. The cells were then incubated in working solutions of primary monoclonal antibodies: rabbit anti-MAP-2 (1:100) and rabbit anti-NSE (1:100) at 4°C overnight. The cells were washed three times with PBS for 3 minutes each, followed by incubation in secondary antibodies: goat anti-mouse IgG-fluorescein isothiocyanate (1:100; MAP-2 staining) and mouse anti-rabbit IgG (1:100; NSE) at room temperature for 15 minutes, and washed three times with PBS for 3 minutes each. Images were observed and collected under a fluorescence microscope (MAP-2, × 400; Leica, Solms, Germany) using an excitation wavelength of 495 nm and an absorption wavelength of 520 nm, and under a microscope (NSE, × 400; Nikon, Tokyo, Japan).
Experimental grouping and treatments
Cells were randomly divided into six groups: sham group, NMDA group, 0.5 μM KN-93 group, and an NMDA in combination with three different concentrations of KN-93 (0.25, 0.5, 1.0 μM; Sigma) groups. Cells (1 × 10⁶/mL) were seeded and cultured for 7 days and then were treated with NMDA (50 μM) alone and in combination with KN-93 (0.25, 0.5, 1.0 μM) after NMDA treatment for 30 minutes, excepting the sham group, which was treated with an equal volume of PBS, and the 0.5 μM KN-93 group, which was treated with 0.5 μM KN-93 only. Twenty-four hours later, identification of cortical neurons, detection of neuronal viability by MTT, TUNEL and PI double staining, and western blot analysis were carried out.
Neuron viability by MTT assay
Cell viability of cortical neurons was assessed by the MTT assay[38,39]. After exposure to NMDA or NMDA combined with KN-93 for 24 hours, DMEM and freshly dissolved MTT (aseptic, 5 mg/mL; Beijing Biosynthesis Biotechnology) was added to culture plates at a final concentration of 10% (w/v). Cells were then returned to the incubator for 4 hours. Dimethyl sulfoxide (200 μL) was added to the plates and agitated for 10 minutes at 37°C to solubilize the MTT formazan crystals. The absorbance value at 570 nm was read spectrophotometrically (Bio-TEK Instruments, Inc., Winooski, VT, USA).
Evaluation of LDH leakage
Cell membrane permeability was determined by measuring LDH release from neurons into the incubation medium using a colorimetric assay kit (Wuhan Boster, Wuhan, China) where the absorbance of the produced formazan (measured at 500 nm) product is proportional to LDH activity. Total LDH was determined after adding a final concentration of 10% (v/v) Triton X-100 and disrupting the slices by homogenization with a Tissue Tearor. Differences related to neuron size were minimal; therefore, data from different experiments were pooled by normalizing the amount of LDH activity released from disrupted neurons.
Apoptosis measured by TUNEL and PI double staining
Neuronal apoptosis in cultured cortical neurons was examined by TUNEL using a commercially available kit (Beijing Biosynthesis Biotechnology), which relies on enzymatic labeling of DNA strand breaks. Cortical neurons were plated onto 15-mm diameter, 1-mm thick glass cover slips precoated with poly-L-lysine. The cells were fixed with 4% (w/v) paraformaldehyde in PBS at 20°C for 1 hour on a slide. The slide was incubated with blocking solution for 10 minutes at 20°C to eliminate endogenous peroxidase, followed by incubation in 0.1% (v/v) Triton X-100 in PBS for 2 minutes on ice. The sample was added to the TUNEL reaction mixture, which was incubated in a humidified atmosphere in the dark for 1 hour at 37°C. Converter-peroxidase (50 μL; Roche Applied Science Company, Basel, Switzerland) was added to the sample, and after incubating the reaction at 37°C for 30 minutes, the sample was treated with 1 mL substrate solution for 15 minutes. TUNEL-positive cells were counted using a cell counter (Shanghai Aibo Medical Device Company, Shanghai, China). For PI staining, cells were cultured in plates for 24 hours, and then treated with PI (Sigma; 50 g/mL) dissolved in PBS (pH 7.4) containing 0.1%Triton X-100 (v/v) and 100 g/mL RNase. Apoptotic cell suspensions were prepared at a concentration of 106/mL. The cell suspension (1 mL) was mixed with 10 μL PI for 10 minutes and 5 mL PBS was added. The suspension was centrifuged at 340 × g for 5 minutes, the supernatant was discarded, and cells were washed twice. Viable neurons were quantified by counting the number of PI-positive cells under a fluorescence microscope (Leica, Solms, Germany) at 536 nm. The results were expressed as a ratio of positive cells of TUNEL to PI[40,41].
Detection of intracellular calcium concentration in cultured cortical neurons
Cell suspensions of cortical neurons were pre-warmed at 37°C for 5 minutes. Fura-2/AM (Beijing Biosynthesis Biotechnology) was added into the suspension and the mixture was left at 37°C for 30 minutes. Cells were then centrifuged at 150 × g for 5 minutes. After the supernatant was discarded, the suspension was washed twice in D-Hanks solution and the cell concentration was adjusted to 1 × 10⁶/mL. 1 μL of cell suspension was put into the colorimetric plate (Yixing Ye Hui Glass Instrument Factory, Yixing, Jiangsu Province, China) cuvette and the concentration of intracellular calcium was detected with a fluorescence spectrophotometer (Tianjin Port East Science Technology Development Company Ltd., Tianjin, China). Upon binding Ca2+, the excitation spectrum of Fura-2 shifted to shorter wavelengths between 300 nm and 400 nm, while the peak emission remained steady at around 510 nm. Peak fluorescence intensity occurred at 345 nm, which meant that Fura-2/AM had entered cortical neurons. The concentration of cytoplasmic calcium was continuously monitored at 345 nm. The concentration of intracellular calcium was calculated by measuring the fluorescence (F) of solutions with different Ca2+ concentrations using the equation: [Ca2+] = Kd(F0–Fmin)/(Fmax–F0), where Kd was the dissociation constant of the chemical reaction for Ca2+ buffering by the fluorescent dye and F0, Fmax and Fmin represented the instantaneous, maximal and minimal dye fluorescence emissions, respectively[42]. The value of Kd was 224 nm. These values were determined with internal solutions containing 10 mM ethylene glycol tetraacetic acid (0 Ca2+), and 10 mM CaCl2 (max Ca2+).
Expression of procaspase-3, caspase-3, P-CaMKII and total-CaMKII levels
Procaspase-3 and caspase-3 detection: Cells were homogenized in lysis buffer containing 250 mM sucrose and 15 nM digitonin, and centrifuged at 150 × g for 1 minute. The pellet obtained was solubilized with sodium dodecyl sulfate-stopping solution (4% (w/v) sodium dodecyl sulfate, 2 mM ethylenediaminetetraacetic acid, 8% (v/v) β-mercaptoethanol, and 50 mM Tris, pH 6.8). The supernatant achieved from the digitonin lysis buffer, which was considered the cytosolic fraction, was lyophilized and then resolubilized in sodium dodecyl sulfate-stopping solution. Samples (50 μg of total protein/track) were separated by SDS-PAGE using a 14% (w/v) gel. For procaspase-3 and caspase-3 analysis, cells were solubilized with sodium dodecyl sulfatestopping solution and samples (30 μg of total protein/track) were separated by SDS-PAGE using a 12% (w/v) gel. The amount of protein loading was controlled by Coomassie staining of gels or Ponceau staining of the nitrocellulose membranes[43]. Protein was transferred to nitrocellulose membranes using a 400 mA current (3 hours, 4°C). The membranes were blocked with 5% (w/v) non-fat dry milk, followed by a second block of 2.5% (w/v) gelatine both in Trisbuffered saline (10 mM Tris, 150 mM NaCl, pH 7.5). All steps were followed by three washes with Tris-buffered saline-Tween 20 (0.05% (v/v) Tween-20, 10 mM Tris, 150 mM NaCl, pH 7.5). Anti-procaspase-3 and caspase-3 antibodies (1:500; oncogene, Cambridge, MA, USA) were used to detect specific proteins.
P-CaMKII and total-CaMKII detection: Samples containing membrane protein were denatured for 10 minutes at 95–98°C and electro-transferred to nitrocellulose membrane with 10% (w/v) Tris solution. The membranes were blocked in the buffer (5% (w/v) non-fat dry milk in PBS) at room temperature for 2 hours, and then incubated with the monoclonal antibody anti-rat P-CaMKII (1:500; Santa Cruz Biotechnology, Santa Cruz, CA, USA) and anti-total-CaMKII (1:500, Santa Cruz Biotechnology) at 4°C overnight. The membrane was then washed for 10 minutes each, three times using blocking buffer and incubated with 1:500 diluted anti-mouse IgG labeled with the horseradish peroxidase conjugate (Beijing Zhongshan Biotechnology Co., Ltd, China) for 1 hour at room temperature. Washing was repeated and protein signals were visualized using an enhanced chemiluminescence system (Amersham, Cambridge, UK) on an X-ray film and analyzed on the Gel Image Analysis System (Bio-Rad, Hercules, CA, USA). The levels of procaspase-3, caspase-3, P-CaMKII and total-CaMKII expression were determined by calculating the ratio of their absorbance values relative to β-actin.
Statistical analysis
Data were expressed as mean ± SD and analyzed using SPSS software (Windows version 15.0; SPSS, Chicago, IL, USA). Statistical analysis for comparisons among six groups was performed using one-way analysis of variance. A P value less than 0.05 was considered statistically significant.
Acknowledgments:
We thank the staff of the Experimental Teaching Center of Pharmacology and Physiology, Liaoning Medical College, for technical guidance, as well as teachers and students from the Center Hospital of Jinzhou, and the Analytical and Testing Center of Liaoning Medical College, for their help and support during experimentation.
Footnotes
Xuewen Liu, M.D., Chief physician.
Funding: This study was supported by Liaoning Social Development Key Projects of Scientific and Technological Department of Liaoning Province, No. 2012225019.
Conflicts of interest: None declared.
Ethical approval: Experiments were performed with the approval of the Animal Ethics Committee of Liaoning Medical College in China.
(Edited by Zhan SQ, Zhu FQ/Yang Y/Song LP)
REFERENCES
- [1].Xu J, Liu ZA, Pei DS, et al. Calcium/calmodulin-dependent kinase II facilitated GluR6 subunit serine phosphorylation through GluR6-PSD95-CaMKII signaling module assembly in cerebral ischemia injury. Brain Res. 2010;1366:197–203. doi: 10.1016/j.brainres.2010.09.087. [DOI] [PubMed] [Google Scholar]
- [2].Nakamura K, Hatakeyama T, Furuta S, et al. The role of early Ca2+ influx in the pathogenesis of delayed neuronal death after brief forebrain ischemia in gerbils. Brain Res. 1993;613(2):181–192. doi: 10.1016/0006-8993(93)90898-w. [DOI] [PubMed] [Google Scholar]
- [3].Orrenius S, Nicotera P. The calcium ion and cell death. J Neural Transm Suppl. 1994;43:1–11. [PubMed] [Google Scholar]
- [4].Pisani A, Bonsi P, Martella G, et al. Intracellular calcium increase in epileptiform activity: modulation by levetiracetam and lamotrigine. Epilepsia. 2004;45(7):719–728. doi: 10.1111/j.0013-9580.2004.02204.x. [DOI] [PubMed] [Google Scholar]
- [5].Supnet C, Bezprozvanny I. Presenilins as endoplasmic reticulum calcium leak channels and Alzheimer's disease pathogenesis. Sci China Life Sci. 2011;54(8):744–751. doi: 10.1007/s11427-011-4201-y. [DOI] [PubMed] [Google Scholar]
- [6].Jahnke S, Bedi KS. Undernutrition during early life increases the level of apoptosis in the dentate gyrus but not in the CA2+CA3 region of the hippocampal formation. Brain Res. 2007;1143:60–69. doi: 10.1016/j.brainres.2007.01.109. [DOI] [PubMed] [Google Scholar]
- [7].Cotman CW, Poon WW, Rissman RA, et al. The role of caspase cleavage of tau in Alzheimer disease neuropathology. J Neuropathol Exp Neurol. 2005;64(2):104–112. doi: 10.1093/jnen/64.2.104. [DOI] [PubMed] [Google Scholar]
- [8].Fujita E, Soyama A, Kawabata M, et al. BMP-4 and retinoic acid synergistically induce activation of caspase-9 and cause apoptosis of P19 embryonal carcinoma cells cultured as a monolayer. Cell Death Differ. 1999;6(11):1109–1116. doi: 10.1038/sj.cdd.4400585. [DOI] [PubMed] [Google Scholar]
- [9].Kim YM, Kim TH, Seol DW, et al. Nitric oxide suppression of apoptosis occurs in association with an inhibition of Bcl-2 cleavage and cytochrome c release. J Biol Chem. 1998;273(47):31437–31441. doi: 10.1074/jbc.273.47.31437. [DOI] [PubMed] [Google Scholar]
- [10].Walter BN, Huang Z, Jakobi R, et al. Cleavage and activation of p21-activated protein kinase gamma-PAK by CPP32 (caspase 3). Effects of autophosphorylation on activity. J Biol Chem. 1998;273(44):28733–28739. doi: 10.1074/jbc.273.44.28733. [DOI] [PubMed] [Google Scholar]
- [11].Yu X, Sun L, Luo X, et al. Investigation of the neuronal death mode induced by glutamate treatment in serum antioxidant-free primary cultures cortical neurons. Brain Res. 2003;145:263–268. doi: 10.1016/j.devbrainres.2003.08.008. [DOI] [PubMed] [Google Scholar]
- [12].Macpherson P, Kostrominova T, Tang H, et al. Protein kinase C and calcium/calmodulin-activated protein kinase II (CaMK II) suppress nicotinic acetylcholine receptor gene expression in mammalian muscle. A specific role for CaMK II in activity-dependent gene expression. J Biol Chem. 2002;277(18):15638–15646. doi: 10.1074/jbc.M109864200. [DOI] [PubMed] [Google Scholar]
- [13].Yang J, Sun LG, Zhong ZH, et al. The inhibitory effect of chronic lead exposure on CA1 LTP and ERK2 activity in rat hippocampal area. Zhongguo Ying Yong Sheng Li Xue Za Zhi. 2006;22(3):326–328. [PubMed] [Google Scholar]
- [14].Soletti RC, Alves T, Vernal J, et al. Inhibition of MAPK/ ERK, PKC and CaMKII signaling blocks cytolysin- induced human glioma cell death. Anticancer Res. 2010;30(4):1209–1215. [PubMed] [Google Scholar]
- [15].Colbran RJ. Regulation and role of brain calcium/calmodulin-dependent protein kinase II. Neurochem Int. 1992;21(4):469–477. doi: 10.1016/0197-0186(92)90080-b. [DOI] [PubMed] [Google Scholar]
- [16].Yamamoto Y, Shioda N, Han F, et al. Nobiletin improves brain ischemia-induced learning and memory deficits through stimulation of CaMKII and CREB phosphorylation. Brain Res. 2009;1295:218–229. doi: 10.1016/j.brainres.2009.07.081. [DOI] [PubMed] [Google Scholar]
- [17].Lin CH, Chen PS, Gean PW. Glutamate preconditioning prevents neuronal death induced by combined oxygen-glucose deprivation in cultured cortical neurons. Eur J Pharmacol. 2008;589(1-3):85–93. doi: 10.1016/j.ejphar.2008.05.047. [DOI] [PubMed] [Google Scholar]
- [18].Lebeurrier N, Liot G, Lopez-Atalaya JP, et al. The brainspecific tissue-type plasminogen activator inhibitor, neuroserpin, protects neurons against excitotoxicity both in vitro and in vivo. Mol Cell Neurosci. 2005;30(4):552–558. doi: 10.1016/j.mcn.2005.09.005. [DOI] [PubMed] [Google Scholar]
- [19].Zhang Y, Bhavnani BR. Glutamate-induced apoptosis in primary cortical neurons is inhibited by equine estrogen via down-regulation of caspase-3 and prevention of mitochondrial cytochrome c release. BMC Neurosci. 2005;6:23. doi: 10.1186/1471-2202-6-13. [DOI] [PMC free article] [PubMed] [Google Scholar]
- [20].Brewer GJ, Lim A, Capps NG, et al. Age-related calcium changes, oxyradical damage, caspase activation and nuclear condensation in hippocampal neurons in response to glutamate and beta-amyloid. Exp Gerontol. 2005;40(5):426–437. doi: 10.1016/j.exger.2005.03.007. [DOI] [PubMed] [Google Scholar]
- [21].Maragakis NJ, Rothstein JD. Glutamate transporters: animal models to neurologic disease. Neurobiol Dis. 2004;15(3):461–473. doi: 10.1016/j.nbd.2003.12.007. [DOI] [PubMed] [Google Scholar]
- [22].Alfaro JM, Ripoll-Gómez J, Burgos JS. Kainate administered to adult zebrafish causes seizures similar to those in rodent models. Eur J Neurosci. 2011;33(7):1252–1255. doi: 10.1111/j.1460-9568.2011.07622.x. [DOI] [PubMed] [Google Scholar]
- [23].Lipski J, Wan CK, Bai JZ, et al. Neuroprotective potential of ceftriaxone in in vitro models of stroke. Neuroscience. 2007;146(2):617–629. doi: 10.1016/j.neuroscience.2007.02.003. [DOI] [PubMed] [Google Scholar]
- [24].Chen TA, Yang F, Cole GM, et al. Inhibition of caspase-3-like activity reduces glutamate induced cell death in adult rat retina. Brain Res. 2001;904(1):177–188. doi: 10.1016/s0006-8993(01)02485-4. [DOI] [PubMed] [Google Scholar]
- [25].Gong L, Li SL, Li H, et al. Ginsenoside Rg1 protects primary cultured rat hippocampal neurons from cell apoptosis induced by β-amyloid protein. Pharm Biol. 2011;49(5):501–507. doi: 10.3109/13880209.2010.521514. [DOI] [PubMed] [Google Scholar]
- [26].Nicholson DW, Thornberry NA. Caspases: killer proteases. Trends Biochem Sci. 1997;22(8):299–306. doi: 10.1016/s0968-0004(97)01085-2. [DOI] [PubMed] [Google Scholar]
- [27].Kuida K, Zheng TS, Na S, et al. Decreased apoptosis in the brain and premature lethality in CPP32-deficient mice. Nature. 1996;384(6607):368–372. doi: 10.1038/384368a0. [DOI] [PubMed] [Google Scholar]
- [28].Wang X, Zelenski NG, Yang J, et al. Cleavage of sterol regulatory element binding proteins (SREBPs) by CPP32 during apoptosis. EMBO J. 1996;15(5):1012–1020. [PMC free article] [PubMed] [Google Scholar]
- [29].Nicholson DW, Ali A, Thornberry NA, et al. Identification and inhibition of the ICE/CED-3 protease necessary for mammalian apoptosis. Nature. 1995;376(6535):37–43. doi: 10.1038/376037a0. [DOI] [PubMed] [Google Scholar]
- [30].Gervais FG, Xu D, Robertson GS, et al. Involvement of caspases in proteolytic cleavage of Alzheimer's amyloid-beta precursor protein and amyloidogenic A beta peptide formation. Cell. 1999;97(3):395–406. doi: 10.1016/s0092-8674(00)80748-5. [DOI] [PubMed] [Google Scholar]
- [31].Jayanthi LD, Wilson JJ, Montalvo J, et al. Differential regulation of mammalian brain-specific proline transporter by calcium and calcium-dependent protein kinases. Br J Pharmacol. 2000;129(3):465–470. doi: 10.1038/sj.bjp.0703071. [DOI] [PMC free article] [PubMed] [Google Scholar]
- [32].Muthalif MM, Karzoun NA, Benter IF, et al. Functional significance of activation of calcium/calmodulindependent protein kinase II in angiotensin II--induced vascular hyperplasia and hypertension. Hypertension. 2002;39(2 Pt 2):704–709. doi: 10.1161/hy0202.103823. [DOI] [PubMed] [Google Scholar]
- [33].The Ministry of Science and Technology of the People s Republic of China. Guidance Suggestions for the Care and Use of Laboratory Animals 2006-09-30 [Google Scholar]
- [34].Shimizu S, Abt A, Meucci O. Bilaminar co-culture of primary rat cortical neurons and glia. J Vis Exp. 2011;57:pii: 3257. doi: 10.3791/3257. [DOI] [PMC free article] [PubMed] [Google Scholar]
- [35].Gao Y, Ji BS, Ba YF, et al. Propylene glycol alginate sodium on cultured rat nerve cells of oxygen-glucose deprivation injury in rats. Zhongguo Linchuang Kangfu. 2006;10(12):53–55. [Google Scholar]
- [36].Geloso MC, Corvino V, Cavallo V, et al. Expression of astrocytic nestin in the rat hippocampus during trimethyltin-induced neurodegeneration. Neurosci Lett. 2004;357(1):103–106. doi: 10.1016/j.neulet.2003.11.076. [DOI] [PubMed] [Google Scholar]
- [37].Fei W, Shiting L, Qinggang P, et al. Expression of EphrinB2 gene in the differentiation of neural stem cells by ATRA. Tongji Daxue Xuebao: Yixue Ban. 2005;26(1):15–18. [Google Scholar]
- [38].Lowry OH, Rosembrough NJ, Farr AL, et al. Protein measurement with the Folin phenol reagent. J Biol Chem. 1951;193(1):265–275. [PubMed] [Google Scholar]
- [39].Röhl C, Gülden M, Seibert H. Toxicity of organotin compounds in primary cultures of rat cortical astrocytes. Cell Biol Toxicol. 2001;17(1):23–32. doi: 10.1023/a:1010951013855. [DOI] [PubMed] [Google Scholar]
- [40].Fujita R, Yoshida A, Mizuno K, et al. Cell density-dependent death mode switch of cultured cortical neurons under serum-free starvation stress. Cell Mol Neurobiol. 2001;21(4):317–324. doi: 10.1023/a:1012645920229. [DOI] [PubMed] [Google Scholar]
- [41].Bendel O, Langmoen IA, von Euler G. Crush injury induces NMDA-receptor-dependent delayed nerve cell death in rat entorhinal-hippocampal slice cultures. Brain Res. 2004;1025(1-2):35–42. doi: 10.1016/j.brainres.2004.07.089. [DOI] [PubMed] [Google Scholar]
- [42].Bortolozzi M, Lelli A, Mammano F. Calcium microdomains at presynaptic active zones of vertebrate hair cells unmasked by stochastic deconvolution. Cell Calcium. 2008;44(2):158–168. doi: 10.1016/j.ceca.2007.11.007. [DOI] [PubMed] [Google Scholar]
- [43].Pal JK, Godbole D, Sharma K. Staining of proteins on SDS polyacrylamide gels and on nitrocellulose membranes by Alta, a colour used as a cosmetic. J Biochem Biophys Methods. 2004;61(3):339–347. doi: 10.1016/j.jbbm.2004.06.008. [DOI] [PubMed] [Google Scholar]


