Abstract
Alzheimer's disease patients diagnosed with the Chinese Classification of Mental Disorders diagnostic criteria were selected from the community through on-site sampling. Levels of macro and trace elements were measured in blood samples using an atomic absorption method, and neurotransmitters were measured using a radioimmunoassay method. SPSS 13.0 was used to establish a database, and a back propagation artificial neural network for Alzheimer's disease prediction was simulated using Clementine 12.0 software. With scores of activities of daily living, creatinine, 5-hydroxytryptamine, age, dopamine and aluminum as input variables, the results revealed that the area under the curve in our back propagation artificial neural network was 0.929 (95% confidence interval: 0.868–0.968), sensitivity was 90.00%, specificity was 95.00%, and accuracy was 92.50%. The findings indicated that the results of back propagation artificial neural network established based on the above six variables were satisfactory for screening and diagnosis of Alzheimer's disease in patients selected from the community.
Keywords: neural regeneration, clinical practice, artificial neural network, Alzheimer's disease, mathematical model, community, trace elements, neurotransmitters, grant-supported paper, neuroregeneration
Research Highlights
(1) Based on the principles and methods of epidemiology and misty mathematics, the present study used scores of activities of daily living, creatinine, 5-hydroxytryptamine, age, dopamine and aluminum as input variables to establish a back propagation artificial neural network, for screening Alzheimer's disease in the community.
(2) A stable and practical diagnostic method for Alzheimer's disease was obtained through model fitting and repetitive training.
Abbreviations
AD, Alzheimer's disease; BP-ANN, back propagation artificial neural network; ADL, activities of daily living; ROC, receiver operating characteristics; AUC, area under the curve
INTRODUCTION
Currently, there are no special clinical treatments for Alzheimer's disease (AD); therefore, early detection and diagnosis of AD is particularly important. Traditional diagnostic methods rely mainly on some scales, clinical presentation or CT, MRI, etc[1,2,3,4,5]. These diagnostic methods have some limitations. For example, many factors can interfere with the Mini-mental State Examination, such as poor compliance. In addition, the measure is time-consuming and difficult to apply in patients in an advanced disease state. In addition, CT and MRI are expensive and not applicable to screening diseases in a large population[6,7]. Artificial neural networks (ANNs) use mathematical modeling to apply a biologically realistic synaptic connection structure to information processing. These networks possess the characteristics of parallel information processing, distributed information storage, high non-linearity, good fault-tolerance and strong self-learning, self-organizing, adaptive ability[8]. The model has been widely applied in the fields of disease diagnosis and prediction[9]. For this reason, based on the principles and methods of epidemiology and misty mathematics, the present study selected some characteristic variables like macro and trace elements in the blood and neurotransmitters as the input layer variables to establish a back propagation artificial neural network (BP-ANN) to screen AD in the community and complement traditional methods.
RESULTS
Quantitative analysis of participants
Using a random cluster sampling method, we identified 4 350 people from six communities in Jiangxi Province, China. According to AD diagnostic criteria, 60 AD patients and 60 healthy controls were selected for study, matched for gender, age, and place of residence.
General conditions
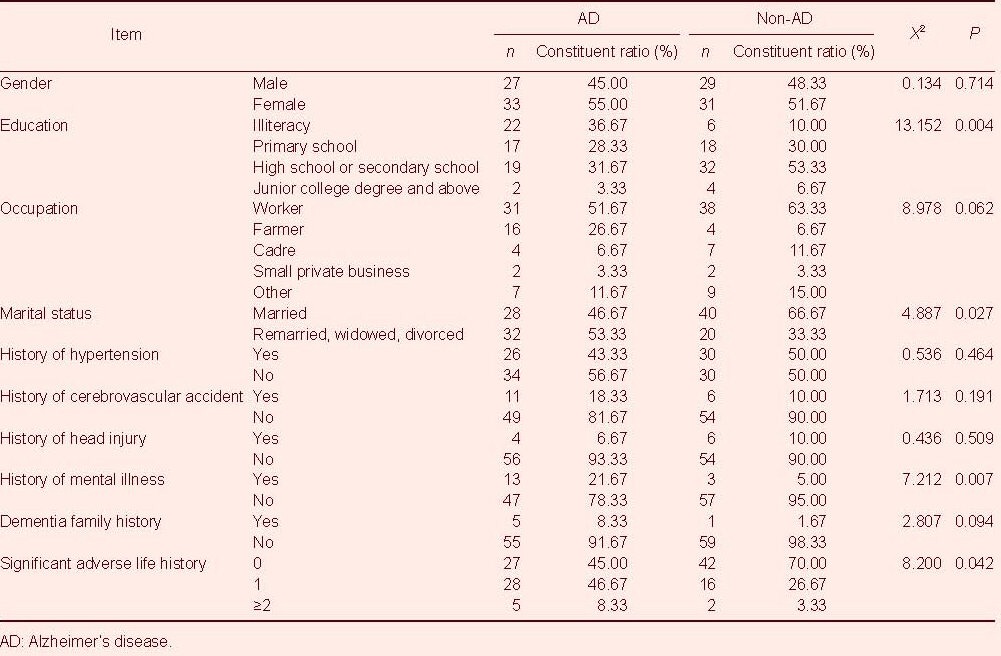
The average age of the 120 subjects was 74.6 ± 8.3 years. There were no significant differences in gender, occupation, history of hypertension, history of cerebrovascular accident, history of head injury or dementia family history between the two groups (P > 0.05). However, the two groups significantly differed in terms of education, marital status, history of mental illness and significant adverse life history (P < 0.05; Table 1).
Table 1.
General characteristics of the subjects
Evaluation results of BP-ANN input variables
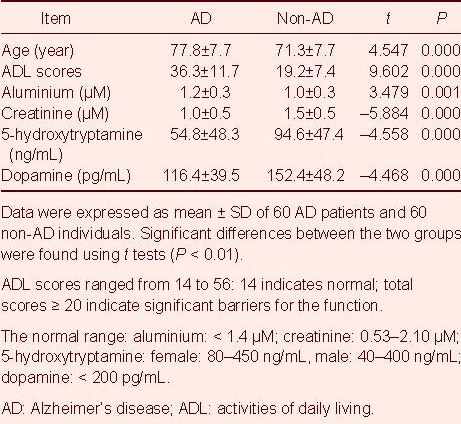
Statistical analysis revealed that the results of all six variables were significantly different between AD patients and controls (P < 0.01). Compared with controls, the AD patients were older on average (by approximately 6 years), and their activities of daily living (ADL) scores (17.13 points higher) and the levels of aluminium (0.18 μM higher) were higher, but the levels of creatinine, 5-hydroxytryptamine, and dopamine were lower (Table 2).
Table 2.
Evaluation results of the back propagation artificial neural network input layer variables
Results of BP-ANN output
The BP-ANN output results were used to construct a receiver operating characteristic (ROC) curve (Figure 1), and the area under the curve (AUC) was 0.929 (95% confidence interval (CI): 0.868–0.968, P < 0.01), indicating that the established BP-ANN performed well in distinguishing AD patients from healthy controls over 60 years of age.
Figure 1.
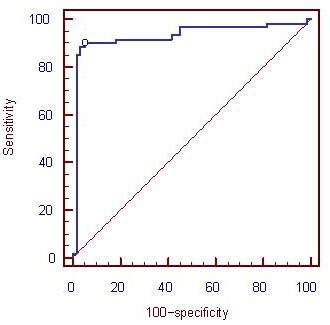
Receiver operating characteristic curve of the back propagation artificial neural network output (abscissa and ordinate units are %).
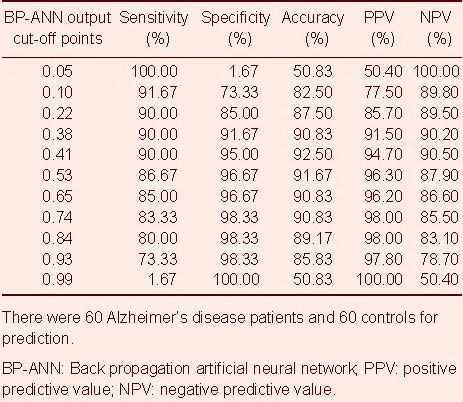
Table 3 shows the sensitivity, specificity, accuracy, positive predictive value and negative predictive value of different cut-off points; the best cut-off point was 0.41, where the BP-ANN's diagnostic value was highest, and the sensitivity, specificity and accuracy were 90.00%, 95.00%, 92.50%, respectively. In the general population of the community, the positive predictive value and negative predictive value were 94.70% and 90.50%, respectively.
Table 3.
BP-ANN output predictions of different cut-off points
DISCUSSION
BP-ANN prediction has previously been shown to perform better than traditional methods[10], and the diagnostic value of ANN (AUC0.82) was reported to be higher than a conventional statistical approach (AUC0.63) in AD prediction[11]. These studies used the number of neurofibrillary tangles and neuropathy plaques in the cerebral cortex and hippocampal gyrus as the input layer to build a BP-ANN model, reporting levels of accuracy up to 100%, higher than the linear discriminant analysis of AD prediction, which exhibited accuracy of 92.30%. Possible risk factors of AD can be used as input variables to fit BP-ANN predicting the incidence and morbidity of AD, although the causes of the AD remain unclear. The six input variables screened in the present study have all been related to AD by previous reports[12,13,14,15,16,17]. Furthermore, these variables are all objective measures that can be collected and measured easily. BP-ANN can overcome some of the shortcomings of the large number of subjective factors involved in traditional time-consuming diagnostic scales for AD.
In the present study, in terms of the model outputs, the constructed BP-ANN model achieved good predictive effects. The AUC was 0.929, the sensitivity was 90.00%, the specificity was 95.00%, the accuracy was 92.50%, and the reliability of the screening diagnosis of AD was better than that of the Mini-mental State Examination scale (sensitivity 92.5%, specificity 72.1%). Its predictive results were also better than previous reports of Martin Griebe et al[18], who established the ANN model using an infrared spectrum of cerebrospinal fluid for AD screening (sensitivity 88.5% and specificity 80.0%). Da Silva Lopes et al[19] used the ANN model to identify and assess patients’ electroencephalography results to help the diagnosis of AD (sensitivity 82% and specificity 61%). However, the outcomes of some studies using the ANN method to predict the incidence and morbidity of AD reported better prognosis than the present study. For example, Rossini and Buscema et al[20,21,22,23] used the implicit function as squashing time (IFAST) program based on ANN, which can accurately identify mild cognitive impairment patients and AD patients by analyzing electroencephalography data (sensitivity 95.87%, specificity 91.06% and accuracy 93.46%). Grossi et al[11] used the number of neurofibrillary tangles and neuropathy plaques in the cerebral cortex and hippocampal gyrus as the input layer to build an ANN model, which was able to distinguish AD patients from controls with an accuracy of up to 100%. The predictive effect of the BP-ANN model is related to the network structure, i.e. the input and hidden layers. The predictive accuracy of the model can be improved if there are close links between input variables and output variables. The implicit layer and hidden nodes play an important role in the network structure, because an overly simple network structure cannot obtain ideal predictive accuracy, and an overly complicated structure may result in overfitting.
In the field of AD prediction, there are other models of applications in addition to BP-ANN, including MRI-based models[24,25] and the risk score model[26]. The results of MRI-based model prediction are better than the BP-ANN results in the present study, while the risk score model is a little worse. For example, Gerardin et al[24] created a spherical harmonics model based on multi-dimensional classification of MRI of hippocampal shape characteristics, and the prediction accuracy was 94% in AD classification, sensitivity 96%, and specificity 92%. Davatzikos et al[25] utilized a high-dimensional MRI map of pattern classification, and the prediction accuracy for AD was up to 100%. Another study used a risk score model to predict the sensitivity for AD, and revealed a sensitivity rate of 80.8%, specificity of 75.7%, and accuracy of 75.9%[26].
In summary, the scores of ADL, creatinine, 5-hydroxytryptamine, age, dopamine and aluminum as input variables of BP-ANN have a good effect in AD prediction. The model was simple, objective, and suitable for large-scale population screening. This method can play an important role in AD prevention and control, community aged care etc. Moreover, it also provides a reference for other chronic disease screening methods and research in community populations. This study should be considered as a preliminary investigation, and future studies should be conducted with larger sample sizes. In addition, it is still necessary to select input variables and combine them with clinical information for further exploration.
SUBJECTS AND METHODS
Design
A clustered random sampling, neural network modeling study.
Time and setting
The investigation was conducted in several communities in Nanchang, Ji’an and Yichun, Jiangxi province, China from May 2008 to September 2010. The blood sample testing and model establishment were performed at Nanchang University, Nanchang, Jiangxi province, China from October 2010 to December 2010.
Subjects
Using a cluster sampling method, 4 350 people older than 60 years from six communities were investigated. Subjects who were suspected to have AD were initially screened using routine methods. Among the subjects, 2 073 were males, accounting for 47.66% of the sample, and 2 277 were female, accounting for 52.34% of the sample.
A self-designed questionnaire was used to collect epidemiological information for all checked objects, and the ADL scale[27] was used to evaluate activities of daily living. For AD (cases): (1) screening by Mini-Mental State Examination[28]; Mini-Mental State Examination scores ≤17 points were considered to indicate illiteracy, ≤20 points as primary level, ≤22 points as secondary level, ≤23 points as university; (2) on this basis, the clinical history and signs and other related information, with reference to the International Classification of Diseases, 10th edition (ICD-10)[29], the Chinese Classification of Mental Disorders diagnostic criteria for suspected case confirmation[30], and the Clinical Dementia Rating were used to evaluate the severity of AD[31]; (3) using the Hamminsk's ischemia rating scale to exclude vascular dementia and mixed dementia[32]; (4) reliable informants provided health-related background information for each subject. For non-AD (controls): all participants were free of cardiovascular disease, neurological disease, and congenital dementia; living in the same urban community; they and their families were willing to cooperate. Of 214 persons diagnosed with AD, 60 AD patients were finally included for BP-ANN modeling along with 60 non-AD (control) individuals.
Methods
Sample collection and laboratory testing
In addition to measuring demographic characteristics and the personal medical history questionnaire, 10 mL of ulnar venous blood was collected from each of the 120 participants. The blood samples were impregnated with anticoagulant and refrigerated. Of the 10 mL blood sample, 2 mL was used for the detection of nine elements: aluminium, copper, zincum, ferrum, calcium, manganese, cadmium, creatinine, selenium; and 8 mL was used for the detection of 5-hydroxytryptamine, dopamine, and acetylcholine receptor antibody. The reference substances for element detection were supplied by the National Center, including HNO3 (chemically pure), Mg(NO3)2, Ni(NO3)2 (chemically pure) and deionized water. The macro and trace elements were analyzed using a TAS-990 atomic absorption spectrophotometer (Shimadzu, Kyoto, Japan), a Shimadzu AA-680 atomic absorption spectrophotometer (Shimadzu) and a GFA-4B graphite atomic device (Shimadzu). Related neurotransmitters were detected by radioimmunoassay. The assay kit of acetylcholine receptor antibody was obtained from RSR Ltd., Cardiff, UK, while the assay kit of 5-hydroxytryptamine and dopamine were from Biosource Europe SA, Nivelles, Belgium.
BP-ANN establishment
SPSS 13.0 software (SPSS, Chicago, IL, USA) was used to establish the database, and the BP-ANN was built with Clementine 12.0 software (SPSS). The data flow is shown in Figure 2. Before modeling, the input variables were concentrated and screened. The variables included gender, age, educational level, occupation, marital status, history of hypertension, history of cerebral vascular accident, history of head injury, history of mental illness, family history of dementia, history of major adverse life, character, scores of ADL, aluminium, copper, zincum, ferrum, calcium, manganese, cadmium, creatinine, selenium, 5-hydroxytryptamine, dopamine, acetylcholine receptor antibody, six variables were selected, including scores of ADL, creatinine, 5-hydroxytryptamine, dopamine, age, and aluminium, which had a strong correlation with the output variable (y = AD illness), P < 0.001.
Figure 2.
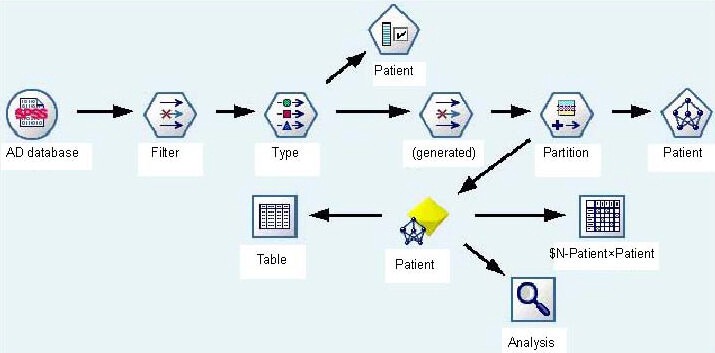
Data flow of BP-ANN modeling.
AD: Alzheimer's disease; BP-ANN: back propagation artificial neural network.
The 120 modeling subjects were assigned to two groups, the training set (n = 85, 71%), used to train the network; and the test set (n = 35, 29%), for the detection of network convergence. Thus, the BP-ANN model was built with the above six selected variables as the input layer, and AD illness as the output layer. Training parameters: impulse items = 0.9, the initial learning rate = 0.02, the maximum weight to adjust the rate of change was not greater than 0.005; activation function was a Sigmoid function, and expression was  . The architecture of the BP-ANN we constructed was a three-tier network with one input layer, six nodes; one hidden layer, three nodes; and one output layer, one node. The network is shown in Figure 3.
Figure 3.
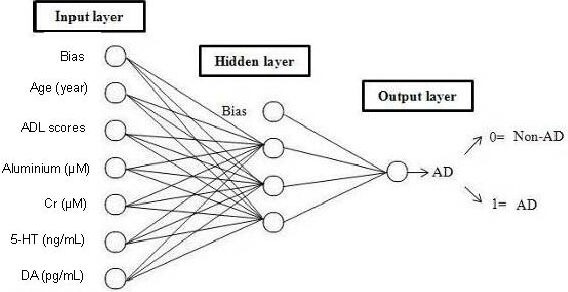
BP-ANN structure of AD.
AD: Alzheimer's disease; BP-ANN: back propagation artificial neural network; ADL: activities of daily living; 5-HT: 5-hydroxytryptamine; Cr: creatinine; DA: dopamine.
Statistical analysis
Continuous variables were expressed as mean ± SD and compared using a two-tailed unpaired student's t-test; categorical variables were compared using chi-square analysis. MedCalc V.11.5.0.0 Software (MedCalc Software, Mariakerke, Belgium) was used to analyze the results of the BP-ANN output (propensity scores) as a receiver- operating characteristic curve.
Footnotes
Jun Tang, Master.
Funding: The study was supported by the National Natural Science Foundation of China, No. 30760214.
Conflicts of interest: None declared.
Ethical approval: The project received full ethical approval from the Medical Research Ethics Committee of First Affiliated Hospital of Nanchang University in China.
(Edited by Liu DW, Wan AL/Su LL/Wang L)
REFERENCES
- [1].Folstein MF, Folstein SE, McHugh PR. “Mini-mental state”. A practical method for grading the cognitive state of patients for the clinician. J Psychiatr Res. 1975;12(3):189–198. doi: 10.1016/0022-3956(75)90026-6. [DOI] [PubMed] [Google Scholar]
- [2].Lehéricy S, Delmaire C, Galanaud D, et al. Neuroimaging in dementia. Presse Med. 2007;36(10 Pt 2):1453–1463. doi: 10.1016/j.lpm.2007.04.029. [DOI] [PubMed] [Google Scholar]
- [3].O’Brien JT. Role of imaging techniques in the diagnosis of dementia. Br J Radiol. 2007;80(Spec No 2):S71–77. doi: 10.1259/bjr/33117326. [DOI] [PubMed] [Google Scholar]
- [4].Pimlott SL, Ebmeier KP. SPECT imaging in dementia. Br J Radiol. 2007;80(Spec No 2):S153–159. doi: 10.1259/bjr/89285735. [DOI] [PubMed] [Google Scholar]
- [5].Frisoni GB, Fox NC, Jack CR, Jr, et al. The clinical use of structural MRI in Alzheimer disease. Nat Rev Neurol. 2010;6(2):67–77. doi: 10.1038/nrneurol.2009.215. [DOI] [PMC free article] [PubMed] [Google Scholar]
- [6].Lancu I, Olmer A. The minimental state examination--an up-to-date review. Harefuah. 2006;145(9):687–690. 701. [PubMed] [Google Scholar]
- [7].Eschweiler GW, Leyhe T, Klöppel S, et al. New developments in the diagnosisof dementia. Dtsch Arztebl Int. 2010;107(39):677–683. doi: 10.3238/arztebl.2010.0677. [DOI] [PMC free article] [PubMed] [Google Scholar]
- [8].Grossi E, Buscema M. Introduction to artificial neural networks. Eur J Gastroenterol Hepatol. 2007;19(12):1046–1054. doi: 10.1097/MEG.0b013e3282f198a0. [DOI] [PubMed] [Google Scholar]
- [9].Ramesh AN, Kambhampati C, Monson JR, et al. Artificial intelligence in medicine. Ann R Coll Surg Engl. 2004;86(5):334–338. doi: 10.1308/147870804290. [DOI] [PMC free article] [PubMed] [Google Scholar]
- [10].Franceschi M, Caffarra P, Savarè R, et al. Tower of London test: a comparison between conventional statistic approach and modelling based on artificial neural network in differentiating fronto-temporal dementia from Alzheimer's disease. Behav Neurol. 2011;24(2):149–158. doi: 10.3233/BEN-2011-0327. [DOI] [PMC free article] [PubMed] [Google Scholar]
- [11].Grossi E, Buscema MP, Snowdon D, et al. Neuropathological findings processed by artificial neural networks (ANNs) can perfectly distinguish Alzheimer's patients from controls in the Nun Study. BMC Neurol. 2007;7:15. doi: 10.1186/1471-2377-7-15. [DOI] [PMC free article] [PubMed] [Google Scholar]
- [12].Castellani RJ, Rolston RK, Smith MA. Alzheimer disease. Dis Mon. 2010;56(9):484–546. doi: 10.1016/j.disamonth.2010.06.001. [DOI] [PMC free article] [PubMed] [Google Scholar]
- [13].Perl DP, Moalem S. Aluminum and Alzheimer's disease, a personal perspective after 25 years. J Alzheimers Dis. 2006;9(3 Suppl):291–300. doi: 10.3233/jad-2006-9s332. [DOI] [PubMed] [Google Scholar]
- [14].Jiang LF, Yao TM, Zhu ZL, et al. Impacts of Cd(II) on the conformation and self-aggregation of Alzheimer's tau fragment corresponding to the third repeat of microtubule-binding domain. Biochim Biophys Acta. 2007;1774(11):1414–1421. doi: 10.1016/j.bbapap.2007.08.014. [DOI] [PubMed] [Google Scholar]
- [15].Marshall GA, Olson LE, Frey MT, et al. Instrumental activities of daily living impairment is associated with increased amyloid burden. Dement Geriatr Cogn Disord. 2011;31(6):443–450. doi: 10.1159/000329543. [DOI] [PMC free article] [PubMed] [Google Scholar]
- [16].Li J, Zhu M, Manning-Bog AB, et al. Dopamine and L-dopa disaggregate amyloid fibrils: implications for Parkinson's and Alzheimer's disease. FASEB J. 2004;18(9):962–964. doi: 10.1096/fj.03-0770fje. [DOI] [PubMed] [Google Scholar]
- [17].Meltzer CC, Smith G, DeKosky ST, et al. Serotonin in aging, late-life depression, and Alzheimer's disease: the emerging role of functional imaging. Neuropsychopharmacology. 1998;18(6):407–430. doi: 10.1016/S0893-133X(97)00194-2. [DOI] [PubMed] [Google Scholar]
- [18].Griebe M, Daffertshofer M, Stroick M, et al. Infrared spectroscopy: a new diagnostic tool in Alzheimer disease. Neurosci Lett. 2007;420(1):29–33. doi: 10.1016/j.neulet.2007.03.075. [DOI] [PubMed] [Google Scholar]
- [19].da Silva Lopes HF, Abe JM, Anghinah R. Application of paraconsistent artificial neural networks as a method of aid in the diagnosis of Alzheimer disease. J Med Syst. 2010;34(6):1073–1081. doi: 10.1007/s10916-009-9325-2. [DOI] [PubMed] [Google Scholar]
- [20].Rossini PM, Buscema M, Capriotti M, et al. Is it possible to automatically distinguish resting EEG data of normal elderly vs. mild cognitive impairment subjects with high degree of accuracy? Clin Neurophysiol. 2008;119(7):1534–1545. doi: 10.1016/j.clinph.2008.03.026. [DOI] [PubMed] [Google Scholar]
- [21].Buscema M, Rossini P, Babiloni C, et al. The IFAST model, a novel parallel nonlinear EEG analysis technique, distinguishes mild cognitive impairment and Alzheimer's disease patients with high degree of accuracy. Artif Intell Med. 2007;40(2):127–141. doi: 10.1016/j.artmed.2007.02.006. [DOI] [PubMed] [Google Scholar]
- [22].Babiloni C, Frisoni GB, Vecchio F, et al. Global functional coupling of resting EEG rhythms is related to white-matter lesions along the cholinergic tracts in subjects with amnesic mild cognitive impairment. J Alzheimers Dis. 2010;19(3):859–871. doi: 10.3233/JAD-2010-1290. [DOI] [PubMed] [Google Scholar]
- [23].Buscema M, Grossi E, Capriotti M, et al. The I.F.A.S.T. model allows the prediction of conversion to Alzheimer disease in patients with mild cognitive impairment with high degree of accuracy. Curr Alzheimer Res. 2010;7(2):173–187. doi: 10.2174/156720510790691137. [DOI] [PubMed] [Google Scholar]
- [24].Gerardin E, Chételat G, Chupin M, et al. Multidimensional classification of hippocampal shape features discriminates Alzheimer's disease and mild cognitive impairment from normal aging. Neuroimage. 2009;47(4):1476–1486. doi: 10.1016/j.neuroimage.2009.05.036. [DOI] [PMC free article] [PubMed] [Google Scholar]
- [25].Davatzikos C, Resnick SM, Wu X, et al. Individual patient diagnosis of AD and FTD via high-dimensional pattern classification of MRI. Neuroimage. 2008;41(4):1220–1227. doi: 10.1016/j.neuroimage.2008.03.050. [DOI] [PMC free article] [PubMed] [Google Scholar]
- [26].Huang P, Tan HZ, Huang HL, et al. The research of a simple prediction model for Alzheimer’disease. Zhongguo Laonianxue Zazhi. 2010;21(30):3041–3044. [Google Scholar]
- [27].Desai AK, Grossberg GT, Sheth DN. Activities of daily living in patients with dementia: clinical relevance, methods of assessment and effects of treatment. CNS Drugs. 2004;18(13):853–875. doi: 10.2165/00023210-200418130-00003. [DOI] [PubMed] [Google Scholar]
- [28].Rodríguez-Andreu J, Ibáñez-Bosch R, Portero-Vázquez A, et al. Cognitive impairment in patients with fibromyalgia syndrome as assessed by the mini-mental state examination. BMC Musculoskelet Disord. 2009;10:162. doi: 10.1186/1471-2474-10-162. [DOI] [PMC free article] [PubMed] [Google Scholar]
- [29].Geneva, Switzerland: World Health Organization; 1992. World Health Organization. The ICD-10 Classification of Mental and Behavioural Disorders: Clinical Descriptions and Diagnostic Guidelines. [Google Scholar]
- [30].3rd ed. Jinan: Shandong Science Press; 2000. Chinese Psychiatry Association. Chinese Classification of Mental Disorders. [Google Scholar]
- [31].Morris JC. The Clinical Dementia Rating (CDR): current version and scoring rules. Neurology. 1993;43(11):2412–2414. doi: 10.1212/wnl.43.11.2412-a. [DOI] [PubMed] [Google Scholar]
- [32].Pantoni L, Inzitari D. Hachinski's ischemic score and the diagnosis of vascular dementia: a review. Ital J Neurol Sci. 1993;14(7):539–546. doi: 10.1007/BF02339212. [DOI] [PubMed] [Google Scholar]


