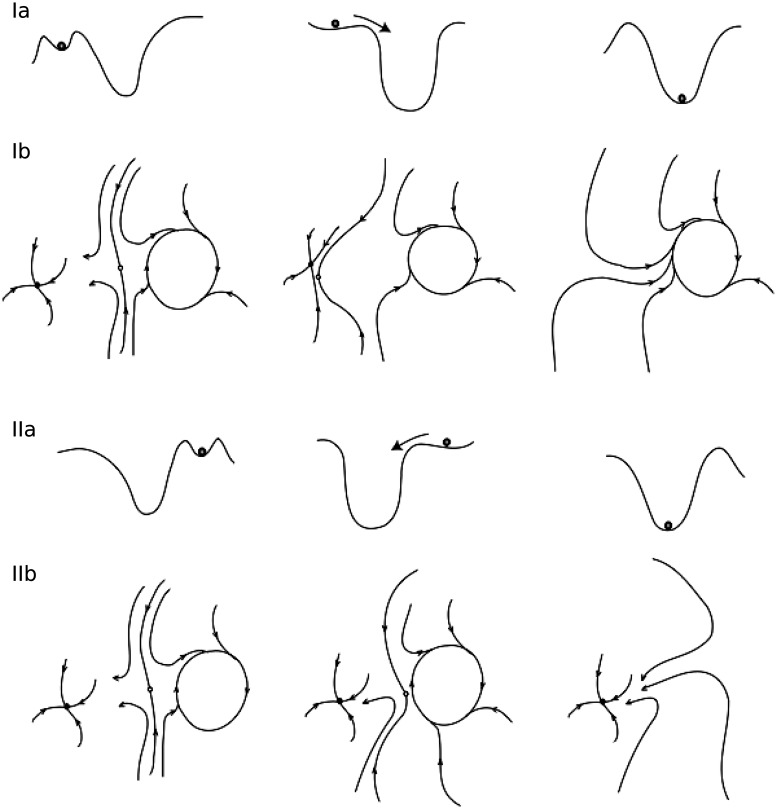
Figure 3.
Caricatures of the flows in state space of ensemble 1 as the slow permittivity variable z changes. Rows Ia and IIa indicate metaphorically the bistability of the ‘normal’ (left minimum, Ia) and seizure (right minimum, IIa) state, as well as its loss. Note that ‘normal’ brain trajectories are displayed as a fixed point for the sake of illustration (it does not reflect the diversity of possible trajectories). Rows Ib and IIb show the corresponding flows in state space. As the permittivity z decreases (from left to right), rows Ia and Ib show how the interictal state loses its stability and the transition occurs towards the ictal state (seizure onset) via a saddle-node bifurcation. Rows IIa and IIb show the equivalent situation for increasing values of z and the homoclinic bifurcation leading to seizure offset.

