Abstract
The revision rate of large head metal-on-metal and resurfacing hips are significantly higher than conventional total hip replacements. The revision of these components has been linked to high wear caused by edge loading; which occurs when the head–cup contact patch extends over the cup rim. There are two current explanations for this; first, there is loss of entrainment of synovial fluid resulting in breakdown of the lubricating film and second, edge loading results in a large local increase in contact pressure and consequent film thickness reduction at the cup rim, which causes an increase in wear.
This paper develops a method to calculate the distance between the joint reaction force vector and the cup rim – the contact patch centre to rim (CPCR) distance. However, the critical distance for the risk of edge loading is the distance from the contact patch edge to rim (CPER) distance. An analysis of explanted hip components, divided into edge worn and non-edge-worn components showed that there was no statistical difference in CPCR values, but the CPER value was significantly lower for edge worn hips.
Low clearance hips, which have a more conformal contact, have a larger diameter contact patch and thus are more at risk of edge loading for similarly positioned hips.
Keywords: Edge loading, hip prosthesis, clearance, contact patch edge to rim distance
Introduction
The revision rate of hip resurfacings and large head metal-on-metal (LHMoM) hip joints is higher than other hip replacements; the 2010 England and Wales National Joint Registry reports a 5 year revision rate of 7.8% for LHMoM and 6.3% for resurfacings compared with 2.0% for cemented hip replacements.1 A number of factors are thought to contribute to this relatively high revision rate including implant (design and manufacture), surgeon (implant position) and patient (metal sensitivity) considerations. Analysis of revised metal-on-metal (MoM) hips has shown that revision is often linked to high wear rates in the metal bearing surfaces,2–5 suggesting poor tribological performance. This may result in concentrations of metal particles in tissue surrounding the implant6 and increased metal ion levels in the bloodstream.4,6–8 These effects can lead to further adverse tissue reactions.3,9,10
Several studies have identified one of the key factors to be a steep acetabular cup inclination leading to ‘edge loading’ and consequently high local wear.2–5,7–10 Previous studies based their identification of ‘edge loading’ on the geometry of the measured wear scar in the explanted acetabular cup. The cups are classified as edge loaded if the maximum depth of the wear scar occurs at the cup rim3,8 or if the edge of the wear scar has a distinct boundary.5 However, the described wear patterns can be caused by other mechanisms such as impingement2,11 or micro-separation.12
True edge loading occurs when the contact patch between the acetabular and femoral component extends over the rim of the cup.5,13 The discontinuity at the edge of the contact patch can lead to huge increases in local contact pressures at the cup rim, resulting in an increase in the wear at the rim.13,14 The increase in local contact pressures can be more than an order of magnitude and are far higher than would be expected from the simple reduction in contact area.14 A second explanation for the local increase in wear is the loss of lubrication due to the failure of the fluid entrainment mechanism.13,15
A number of recent papers have studied the mechanical and geometric origins of edge loading. The use of the cup coverage2,16 (centre edge angle) and contact patch centre to rim7,17 (CPCR) (Figure 1(a)) distance was an important advance and helped to explain some of the variability in wear rates and the occurrence of edge loading observed in explanted hips. The currently accepted risk factors for edge loading are small head size, low cup articular arc angle (CAAA) (the angle subtended by the bearing surface of the cup, as shown in Fig. 2), insufficient or excessive cup inclination and version angles.2–5,7–10,13,16
Figure 1.

Schematic diagram defining (a) CPCR distance and (b) CPER distance.
Figure 2.
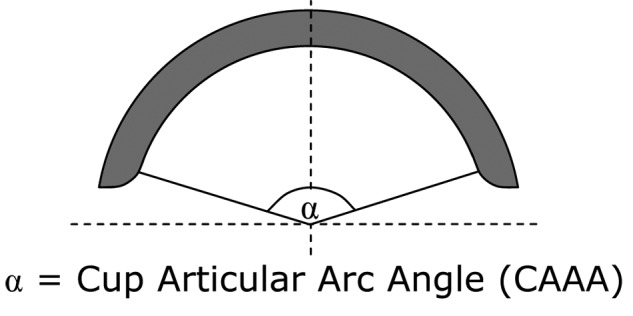
Diagram illustrating the CAAA of an acetabular cup.
However, in analysing explanted MoM hips it became clear to the current authors that there are instances of edge loading that are not predicted by current theories.8 There is a large variation in the inclination angles that cause edge loading that cannot be explained by the differences in CAAA; in particular it was observed that low clearance hips seemed to be more at risk from edge loading. This paper proposes that low clearance is a risk factor for edge loading in hips; low clearance hips have a more conformal contact between the head and cup, resulting in a larger contact area, increasing the risk of the contact patch extending over the cup rim. It is proposed that the critical distance for assessing the risk of edge loading is the distance from the contact patch edge to cup rim (CPER) (Figure 1(b)) rather than the CPCR (Figure 1(a)) as suggested by previous authors.2,7,16
This paper aims to develop a more accurate quantitative measure of the distance between the CPCR, taking into account the cup geometry (CAAA) and position (version and inclination). The method used to calculate the CPCR is based on the vector dot product. The contact patch diameter was calculated using Hertz theory, taking into account the hip clearance. The validity of the CPER distance as a risk factor for edge loading, and thus the risk factor of low clearance was demonstrated using explanted hips.
This paper has the following objectives.
Measurement of cup geometry (CAAA and clearance) of unworn explanted hips.
Development of a mathematical model to calculate the distance from the centre of the contact patch to the cup rim.
Calculation of CPER for explanted hips with known position to validate the model.
Materials and methods
Cohort of retrieved implants
The explanted hips used in this study were consecutive hips collected by a retrieval centre. Ethical approval was obtained for this study. The implants had all ‘failed’ and been revised with new implants, with the explanted components sent to the retrieval centre for further study. An additional inclusion criterion was either an AP (antero-posterior) and lateral radiograph or a three-dimensional (3D) computerized tomography (CT) scan. The radiographs were taken with the patient in a supine position. The implants consisted of both resurfacings and LHMoM modular total hip replacements from the manufacturers DePuy (ASR), Smith and Nephew (BHR), Zimmer (Durom), Finsbury (Adept) and Corin (Cormet).
Measurement of explanted hips
CAAA
The CAAA (as shown in Figure 2) was measured using a Talyrond 365 Roundness Machine (Taylor Hobson, Leicester, UK). The cup was mounted with the rim in the vertical plane and the centre of rotation aligned with the Talyrond spindle axis. A ‘recess stylus’ (the tip is mounted on a 30 mm long horizontal shank to allow the tip to contact the cup bearing surface without the vertical arm impinging on the cup rim) with a 2 mm diameter spherical sapphire tip traced along the equator of the vertical cup from rim to rim through an unworn segment of the cup. The measurements extend over the cup rim at the start and end of the profile, allowing the position of the end of the bearing surface to be accurately located using the Taylor Hobson analysis program Ultra. The CAAA was then calculated from the angular position of the edges of the cup bearing surface.
Radial clearance
The radial clearance of the hip is the difference in radius between the head and cup, as shown in Figure 3. This was measured using a LK G90C Coordinate Measuring Machine (Nikon Metrology, Derby, UK), according to the British Standard BS 7251-4.18 The clearance was only measured for explanted components with no measurable wear scar and new components. An average clearance was calculated for each hip manufacturer.
Figure 3.
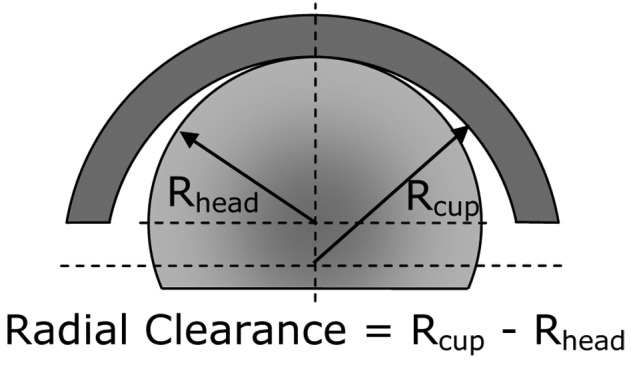
Diagram illustrating the clearance of a MoM hip.
Measurement of cup wear scar
The position and maximum depth of the wear scar on the cups were measured to classify the hip as edge worn or non-edge-worn using a Talyrond 365 Roundness Machine according to protocol described by Hart et al.19 The Talyrond was used to measure 12 circumferential profiles along lines of latitude on the bearing surface, parallel to the rim of the cup, at a distance of between 1 and 12 mm below the cup rim. For each profile a maximum inscribed (MI) circle was fitted to each profile to represent the unworn shape of the cup. The MI circle is the largest circle that can be inscribed within the profile. The linear wear depth was calculated for each profile as the maximum deviation from the measured profile from the MI circle. The cups were classified as edge worn if the maximum depth of the wear scar occurred at the cup rim, based on the definition of Kwon et al.3
Measurement of cup position
All inclination and version cup angles in this paper are in the radiographic definition20 and all measurements were carried out by a consultant orthopaedic surgeon. If a CT scan was available, the cup position was measured using a 3D CT reconstruction software package Robin 3D19 (UCL Medical Imaging Group, London, UK). For hips without an available CT scan, the inclination was measured from the AP radiograph and the version from the lateral radiograph.
Calculation of head/cup contact patch size
The Hertz Theory of Elastic Contact was used to calculate the contact width between the head and cup based on the applied load, the material properties (Young’s modulus and Poisson’s ratio) and relative curvatures of the contacting bodies.14 There was no data available for patient weight, so a load of 3 kN was applied; this is the peak load in the gait cycle described in the British Standard 14242-1for hip simulators.21
The derivation of the Hertz equations assumes that the initial curvature of one of the bodies can be neglected, which may be invalid for MoM hips which have a large and conformal contact between two curved surfaces. However, for the loads and contact geometry of large diameter MoM hips, the maximum error in contact pressure and width is approximately 2%.14
Calculation of CPCR distance
The minimum distance between the centre of the contact patch and the cup rim was calculated by a program written in Matlab (Mathworks, Natick, Massachusetts). Figure 4 shows a schematic diagram of a hip with the location and direction of the vectors and key angles identified. It was assumed that the centre of the contact patch coincides with the joint reaction force vector. There are two directional vectors: one for the anatomical cup orientation through the pole and a second one for the joint reaction force (red arrow). The direction of the cup orientation vector was based on rotations defined by the radiographic orientation of the cup (version and inclination). The orientation of the joint reaction force vector was based on an average of the data of Bergmann et al.22 for the case of a stationary patient standing on one leg. The vector dot product was calculated between the two vectors, which gave the angle between them in a plane that passes through the centre of the cup. From Greater Circle theory, the shortest distance between two points on a sphere is in the plane that passes through the centre of the sphere.23 From the angle between the two force vectors, the CAAA and head diameter, the distance between the centre of the contact patch and the rim of the cup was calculated. Appendix 1 provides more details of the calculation.
Figure 4.
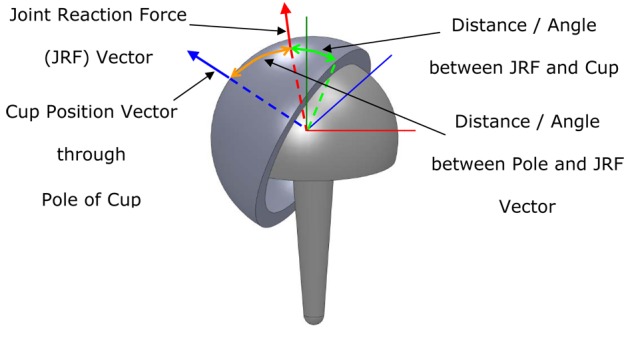
Diagram showing the joint reaction force vector and cup position vector used to calculate the CPCR distance.
Calculation of CPER distance
The CPER distance was calculated by subtracting the radius of the contact patch (calculated from the Hertz Theory) from the CPCR distance. The CPCR and CPER distances are shown schematically in Figures 1(a) and (b), respectively.
Statistical validation of CPCR and CPER distances
The CPCR and CPER distances were calculated for all the edge worn and non-edge-worn hips with version in the ‘safe range’ of 15–25° proposed by Lewinnek et al.24 Most orthopaedic surgeons aim to implant the acetabular cup into that zone in order to reduce the risk of dislocation. Edge wear may be due to several mechanisms; one of these is impingement which is associated with adverse versions. To try and eliminate edge worn hips caused by impingement from the analysis, which is trying to consider edge-loaded edge worn hips, only hips with version values in the safe range were analysed.
The Mann–Whitney U test is a non-parametric statistical significance test. The test was used as an indication of the statistical difference in values of CPCR and CPER for the edge worn and non-edge-worn groups.
Results
CAAA and radial clearance
Table 1 shows the CAAA measured from the available explanted cups. The ASR is available in nominal odd head diameters, but they are rounded up to the nearest even size to allow easy comparison. The Adept and Durom have a constant CAAA for all head sizes, whereas the CAAA for the ASR, BHR and Cormet components decreases as the head reduces. The CAAA for the ASR is significantly less than for the other brands.
Table 1.
CAAA of measured acetabular cups. An ‘X’ indicates no cup of that size was available for measurement. A space indicates no cup of that size is produced by that manufacturer.
| Head size (mm) | ||||||||||||
|---|---|---|---|---|---|---|---|---|---|---|---|---|
| 38 | 40 | 42 | 44 | 46 | 48 | 50 | 52 | 54 | 56 | 58 | 60 | |
| Adept | X | 160 | X | 160 | 160 | 160 | 160 | X | 160 | X | 160 | |
| BHR | X | X | 159 | 160 | 161 | 161 | 162 | X | 163 | X | X | |
| Cormet | 159 | 160 | 161 | 162 | 163 | 164 | 165 | X | X | |||
| Durom | X | X | 165 | 165 | 165 | 165 | 165 | 165 | 165 | 165 | X | X |
| ASR | 146 | 148 | 149 | 151 | 151 | 151 | 151 | 152 | X | |||
Based on the criteria of Heisel et al.25 the ASR and Durom are low clearance hips (radial clearance < 75 µm), the Adept is medium clearance (75–100 µm) and the BHR and Cormet high clearance hips ( > 100 µm).
Wear measurements
Wear measurements were made on 122 cups. Of these 64% were edge worn. The mean wear rate of edge worn cups was 31.90 (range 0.77–245.55) µm/year. The mean wear rate of the non-edge-worn cups was 0.85 (range 0–6.18) µm/year (see Figure 5).
Figure 5.
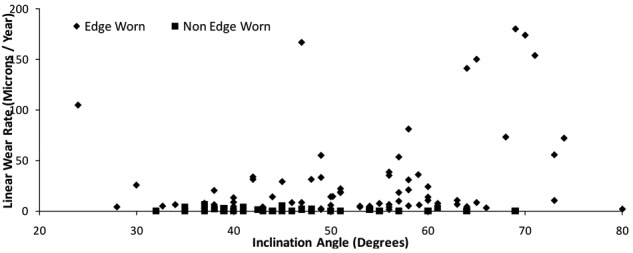
Plot showing inclination and wear rates for edge worn and non-edge-worn hips.
Effect of cup inclination and clearance on CPCR and CPER distance
Figures 6(a) and (b) show the variation of CPCR and CPER distances over a range of inclination and version angles. The CPCR and CPER and thus cup coverage decrease as the inclination angle increases. The plots show that the effect of version becomes less important as the inclination angles increases. The CPER plot is similar to the CPCR plot, but the set of curves are offset by the contact semi-width.
Figure 6.

The effect of cup inclination and version on (a) CPCR distance for a hip with a CAAA of 160° and 50 mm head diameter and (b) CPER distance for a hip with a CAAA of 160°, 50 mm head diameter, 100 µm radial clearance and 3000 N load.
Figures 7(a) and (b) show the variation of CPCR and CPER with inclination and clearance. Changes in clearance have no effect on the CPCR; however, the changes in clearance have a significant effect on the CPER distance.
Figure 7.
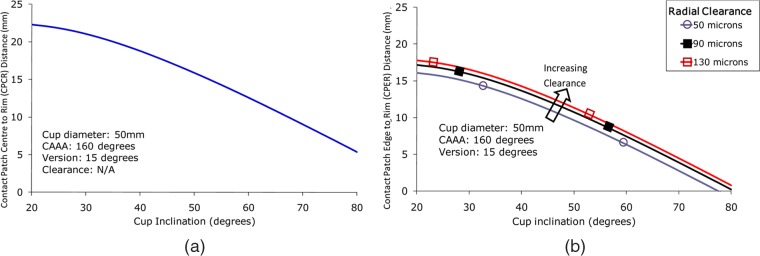
Plot showing the effect of cup inclination and clearance on (a) the CPCR distance for a hip with version of 15°, CAAA of 160° and 50 mm head diameter and (b) CPER distance for a hip with version of 15°, CAAA of 160°, 50 mm head diameter and 3000 N load.
CPCR and CPER distances for explanted hips
Figure 8 is a plot of CPCR values for the edge worn and non-edge-worn hip groups. The mean CPCR for non-edge-worn hips is 15.7 mm whereas it is 13.6 mm for edge worn hips. The p-value is 0.068.
Figure 8.
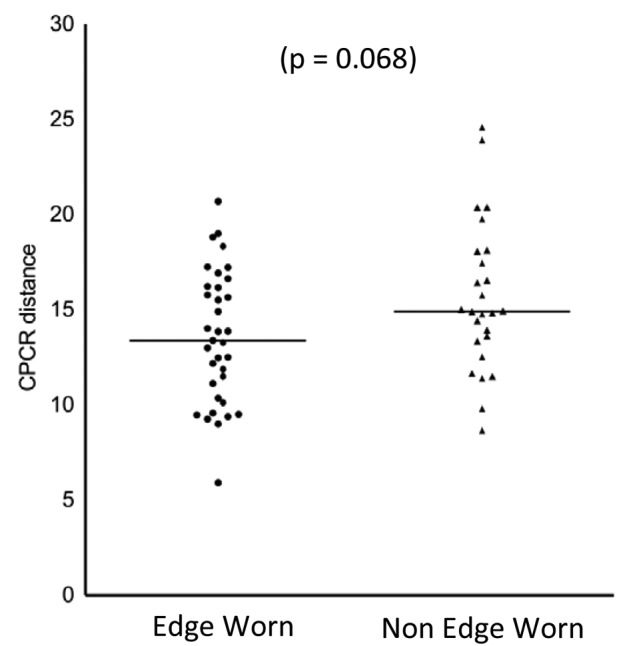
The CPCR calculated for edge worn and non-edge-worn explanted MoM hips with versions in the safe range between 5° and 25° suggested by Lewinnek et al.24 There is no statistically significant difference for the CPCR for edge worn and non-edge-worn hips.
The corresponding CPER distances for the edge worn and non-edge-worn hips are shown in Figure 9. The mean CPER is 9.7 mm for non-edge-worn hips and 6.9 mm for edge worn hips. The p-value is less than 0.001.
Figure 9.
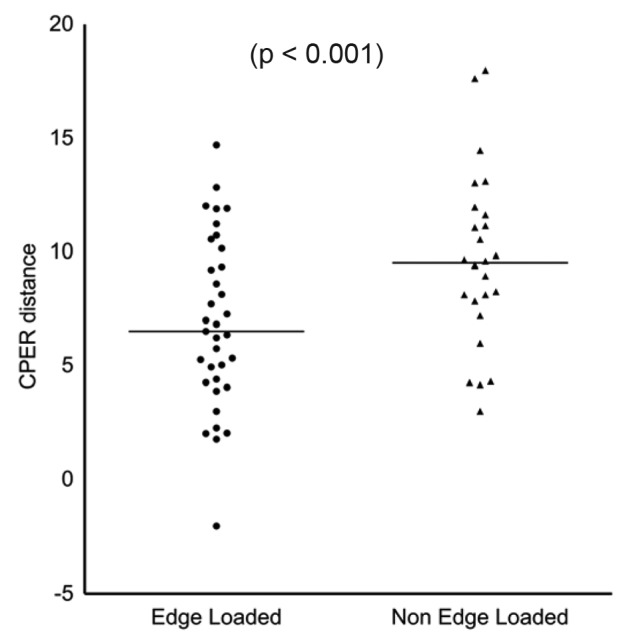
The CPER distance calculated for edge worn and non-edge-worn explanted MoM hips with versions in the safe range between 5° and 25° suggested by Lewinnek et al.24There is a statistically significant difference for the CPER for edge worn and non-edge-worn hips.
Discussion
This paper considers the mechanism of edge loading in MoM hips. It introduces a method to calculate the distance between the centre of contact patch and cup rim. Low clearance is introduced as a new risk factor for edge loading on MoM hips.
The effect of edge loading on wear rate
The significantly higher linear wear rate measured for edge worn hips reinforces the message from previous studies that edge wear and edge loading are associated with elevated wear rates.2–5,7–10,16,19 However, edge wear can be caused by various implant factors and at present there is no reliable technique to determine the edge wear mechanism by examining the wear scar position and geometry. Thus, those hips whose wear patterns were identified in this and previous studies as being edge worn (or edge loaded) may have different underlying causes such as impingement, micro-separation or edge loading.
This paper considers edge wear caused by the edge loading mechanism where the head– cup contact patch extends over the cup rim. The discontinuity in the contact patch results in a large increase in the local pressure at the cup rim.14 The Archard Wear Equation26 predicts that the volume of material worn per unit sliding distance is directly proportional to the applied load, so near the cup rim, the local increase in contact pressure will cause a corresponding increase in the wear rate. However, this simple analysis assumes a constant wear coefficient and ignores the effect of the edge loading on the lubrication regime and the behaviour of the synovial fluid lubricant. The Archard equation is based on an asperity contact model for dry contacts; although a lubricant film is present in MoM hips, they operate in the mixed to boundary regime27 so there is significant asperity–asperity contact. For Newtonian fluids, an increase in the contact pressure results in a reduced film thickness28 which will lead to more asperity–asperity contact, giving an increased wear coefficient and an increased wear rate. When the contact patch extends over the cup rim, depending on the sliding direction of the head relative to the rim, there will be a change in the inlet geometry. During normal motion, there is a convergent inlet zone caused by the difference in diameters between the head and cup which entrains synovial fluid into the contact. The loss of the convergence in the contact inlet could lead to insufficient fluid being entrained into the contact, leading to starvation and an increase in the wear rate.
The effects of edge loading on the lubrication regime of MoM hips is a important factor in understanding the wear mechanism and further work is required to model this effect. Studies have shown that synovial fluid is a non-Newtonian fluid.29 The proteins present in synovial fluid are known to play a significant role in the lubrication of artificial hips. Layers of proteins have been observed to adhere to the surface of the cobalt chrome components;30 the effect of these proteins is to act as a boundary lubricant – locally reducing the wear when asperities come into contact. However, such films are sensitive to the contact pressure28 and the increased contact pressure at the cup rim may result in the destruction of the protective boundary film and an increased wear rate.
Effect of cup design parameters on wear rate
CAAA
Table 1 shows the differences in values of CAAA between different manufacturers and between different head sizes for the same brand. The CAAA is a compromise between a high CAAA giving maximum cup coverage, and thus reducing the risk of edge loading, against the risk of impingement and a reduced range of motion. The risk of impingement is higher and the range of motion lower for resurfacings than for LHMoM hips, due to their smaller head-to-neck ratio. Consistent with this, a study of explanted components reported a lower incidence of edge wear for LHMoM hips.8 The sub-hemispherical CAAA of these cups is optimized for resurfacings and perhaps hemispherical cups should be used for LHMoM to reduce the risk of edge loading.
The reduction in the CAAA with head size for some brands such as the BHR, Cormet and ASR is has potential clinical significance. For example, several studies have reported increased revision rates for small heads (< 50 mm) and increased metal ion concentrations in the bloodstream.4,7,9,10 This situation is complicated as the revision rate for females (who have smaller hips than males) is higher than for males, so it is currently unclear if it is patient gender or hip size that is the risk factor for the increased revision rate. However, reducing the CAAA increases the risk of edge loading due to reduced cup coverage. The smaller the head size, the lower the CPCR distance for the same angle between force vector and cup rim.
Clearance
It can be assumed from the range of clearances used in MoM hips, as shown in Table 2, that there is no consensus regarding the optimum clearance for MoM hips. The choice of clearance is a compromise between being large enough to avoid negative clearance (interference when the cup is deflected in vivo or with an adverse combination of tolerances on the head and cup diameter) and low clearance for reduced wear. Yew et al.31 showed that the deflection may be up to 100 µm depending on the cup size, wall thickness and the interference between cup and pelvis.
Table 2.
Average value of the radial clearance measured for unworn implants.
| Model | Radial Clearance (µm) |
|---|---|
| Adept | 80 |
| BHR | 100 |
| Cormet | 100 |
| Durom | 70 |
| ASR | 50 |
Negative clearance (interference) between the head and cup rim results in equatorial contact and will lead to increased frictional torque, which could lead to acetabular loosening.32 Issac33 discussed the effect of diametric clearance on the wear rate of MoM components in a hip simulator. It was shown that especially during the running in phase the volumetric wear rate was reduced with a lower clearance. The difference in wear rates was considerably reduced during the steady state phase, as during running in the clearance within the wear patch is reduced as the surfaces become more conformal. However, it must be remembered that these tests were run under optimum implant conditions (minimal cup deflection, correct alignment).
CPCR calculations
The proposed idea to calculate CPCR based on the vector dot product between the vector at the pole of the cup and the force direction vector is superior to existing methods. The methods of Jeffers et al.16 and De Haan et al.2 do not take into account the version of the cup, which at low inclination angles has a significant effect on the CPCR as demonstrated in Figure 6. The calculation of the contact patch centre (CPR) performed by Langton et al.17 uses a different technique to the vector method used in this study and can introduce large errors in calculated CPCR distance at higher version angles. They calculated the distance from the centre of the acetabular component to the force vector in the AP and sagittal planes using two-dimensional (2D) Cartesian geometry. Their method then projects these distances onto a transverse plane and uses 2D trigonometry to calculate the CPCR distance, however, the two points are not in the same transverse plane (and this discrepancy increases with increased version angle) and leads to errors in the calculated CPCR distance.
CPER calculations
The CPER, which includes the effects of clearance and joint load, developed from the CPCR and cup coverage by considering the location of the edge of the contract patch, not the centre of the contact patch. Edge loading is caused by the edge of the contact patch extending over the cup rim, and so the CPER is a better measure of the risk of edge loading than the CPCR distance.
The CPER is reduced as the size of the contact patch increases, and thus low clearance (which results in a more conformal contact) and increased load (which results in a large contact patch) both decrease CPER and thus increase the risk of edge loading. It should be noted that in Figures 6 and 7 CPER takes negative values (which represent the head–cup contact patch extending over the cup rim, and thus the hip edge loading) at inclinations over 75°. There is considerable evidence of explanted components that shows that edge loading occurs at considerable lower angles, and the reasons for this are considered in the section ‘Calculation of CPER for explanted hips’.
CPCR calculation for explanted hips
The CPCR was calculated for the explanted hips for cups with versions in the range of 5–25° and the results plotted in Figure 8. This study specifically considers the edge wear mechanism that occurs when the head cup contact patch extends over the cup rim; however, impingement and micro-separation can give a very similar wear pattern. In this study, only hips with version in the range 5 –25° are included in the CPCR and CPER calculations, to try and eliminate edge wear caused by impingement. Impingement has been shown to occur at excessive or insufficient version,2,11 and so only the cups within the safe range for the version proposed by Lewinnick et al.24 were included in the analysis. There is no definitive safe range of version that removes the risk of impingement and the effects of femoral version were not considered. The current authors are aware of the shortcomings of these criteria to identify edge worn hips caused by an impingement mechanism. Edge wear caused by a micro-separation mechanism is independent of cup position and is related to other biomechanical parameters;27 it was not possible to identify hips that had suffered micro-separation from the study.
The difference in mean CPCR values for the edge worn and non-edge-worn hips was 2.1 mm. The hips in this study have a mean head size of 47 mm, so the difference in mean CPCR values is equivalent to a difference in acetabular inclination angle of 5°. Langton et al.4 and Langton et al.17 have previously shown a significant dependence of metal ion concentrations in the bloodstream with CPR distance, which is equivalent to the CPCR, however, their studies considered only ASR and BHR components, so the effects of clearance and other design differences between multiple manufacturers is limited. Their studies also included all hips with a range of versions, so does not take into account the different mechanisms that can lead to excessive edge wear.
The presence of edge worn hips with high CPCR distance as outliers on the graph (Figure 8), are resurfacing hips with low inclination angles, in which the femoral neck was impinging on the cup rim.8
The calculation of CPCR assumes that the centre of the contact patch is coincident with the force vector. This assumption is valid for non-edge-loaded hips, where the contact patch is fully constrained within the bearing surface of the cup. In contrast, for edge-loaded hips, when the contact patch extends over the rim, this assumption is no longer valid. However, the assumption of Hertzian contact mechanics also breaks down for edge-loaded hips. To predict the contact patch size and pressure distribution it is necessary to use Finite Element Modelling.
Calculation of CPER for explanted hips
The difference in CPER values for the edge worn and non-edge-worn hips are plotted in Figure 9. The difference in mean CPER values between the edge worn and non-edge-worn hips was 2.8 mm, which is equivalent to a difference in acetabular inclination angle of 7° for a 47 mm head. The difference in mean values of CPER between edge worn and non-edge-worn hips is larger than the difference in CPCR for the same cohorts of hips, and the p-value is lower indicating the difference is more statistically significant. The difference in mean values of nearly 3 mm is clinically significant, as it is equivalent to a difference in inclination angle of 7°.
The calculated CPER values for the explanted hips in this study were always greater than zero; however, in order for the contact patch to extend over the cup rim the CPER value should be less than zero. The direction of the force vector, loading and position of the pelvis used in this analysis is representative of the static case and will become more adverse during daily activities.
The position of the cups was measured from radiographs with the patient in a supine position and when the patient is standing, the pelvic tilt may change significantly, which changes the version of the cup and thus the CPER.
The analysis assumes that the patients are stood stationary on one leg, with the average position of the joint reaction force (JRF) vector taken from the Bergmann et al.22 During daily activities, and in particular common ones such as walking or running, the loads may be considerably higher, resulting in a larger contact patch and thus reduced CPER distance. The effects of gait and pelvic tilt that change the location of the JRF vector relative to the cup rim will decrease the CPER distance. In this analysis, the patient weight was unknown, so a maximum hip load of 3 kN was assumed. Obviously, heavier patients and higher loads, the contact patch will be larger, decreasing the CPER, while for lighter patients and lower loads, the contact patch will be smaller, thus increasing the CPER. The clearances used for the Hertzian calculations were an average for each manufacturer; there will inevitably be variations in clearance as a result of manufacturing tolerances, but these variations were judged to be less than the potential errors in calculating the diameters of worn components due to the difficulties of fitting a sphere to the data to assume the unworn shape. With better clinical data, such as patient weight and access to radiographs to allow the direction of JRF to be judged from patient geometry, and more information on loads and position of JRF during daily activities, it may be possible to improve further the CPER calculation.
Low clearance increases the risk of edge loading
The message of this paper is that low clearance is a risk factor for edge loading. Edge loading occurs when the contact patch between the head and cup extends over the cup rim, and therefore the CPER distance is a better measure of the risk of edge loading than the CPCR, as it is clearly the proximity of the contact patch edge not centre that is the risk factor.
Figure 10 shows schematically the effect of clearance on the CPER and CPCR distance. For high and low clearance cups with the same CAAA and position, the edge of the contact patch is closer to the cup rim for the low clearance cup with an increased contact patch width. The distance from the centre of the contact patch to the cup rim, the CPCR, is the same for both of these cups despite the increased risk of edge loading for the low clearance cup. Figure 7 shows that the effect of clearance on the CPER; the differences in CPER resulting from different clearances can be as significant as the differences in CAAA between different designs. The CPER distance, which takes into account the size of the contact patch (which is dependent on the clearance) is reduced for the low clearance hip, and therefore is a better measure of the risk of edge loading.
Figure 10.
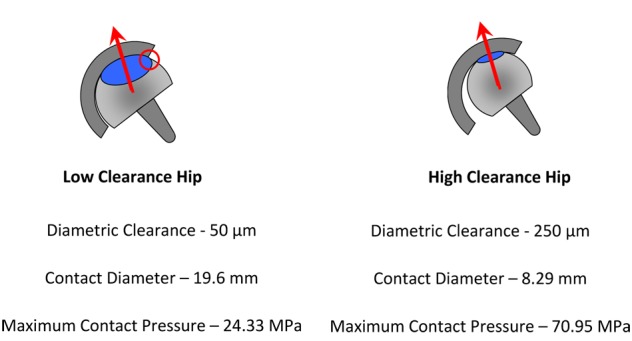
Schematic diagram showing the effect of clearance on CPER and CPCR distances demonstrating that low clearance can increase the risk of edge loading.
Conclusions
Edge wear was found to occur in 65% of explanted hips, and the mean wear rate is 37 times higher than non-edge-loaded hips.
A mechanism that leads to edge wear is edge loading. This occurs when the contact patch between head and cup extends over the cup rim, which results in a large increase in local contact pressure, disruption to the lubrication mechanism and increases wear rate at the cup rim.
The risk of edge loading is better assessed by the CPER rather than the CPCR as used by previous studies.
Low clearance hips have a more conformal contact and therefore a larger contact patch, which decreases the distance between the edge of the contact patch and the rim of the cup, thereby increasing the risk of edge loading and higher wear.
Acknowledgments
The authors would like to thank K Ilo, A Matthies, M Fowell, J Skinner and M Boroff for their assistance and support.
Appendix 1
The global coordinate system is defined in the following way (XZ is the main (coronal) plane of the body):
the Z-axis is directed to the top of the body;
the X-axis is directed to the side (left) of the body;
the Y-axis is directed to the front of the body.
Two direction vectors are considered; one for the reaction force, a, and one for the cap orientation, b, aligned along the symmetry axis of the cap. Both are unit vectors initially aligned along the Z-axis of the global coordinate system
Let the angle between a and b be θ then
a•b = | a | • | b | cos(θ) →θ = arccos(a•b) 0 < θ < π
The actual orientation vectors and the respective angle, , between them are found after appropriate rotations of the initial vectors
R xb and R yb are the rotation matrices for the version and inclination of the cap respectively. R xa and R ya are the matrices that correspond to the necessary rotations of the reaction force orientation vector. The way the rotations are carried out here corresponds to the radiographic reference system.
Footnotes
This work was funded by the British Orthopaedic Association through an industry consortium of nine manufacturers: DePuy, Zimmer, Smith & Nephew, Biomet, JRI, Finsbury, Corin, Mathys, and Stryker. The contract allows for freedom to publish all results.
No benefits in any form have been received or will be received from a commercial party related directly or indirectly to the subject of this paper.
References
- 1. England and Wales National Joint Registry. The seventh annual report, http://www.njrcentre.org.uk (2010, accessed 20 June 2011).
- 2. De Haan R, Campbell P, Su E, De Smet K. Revision of metal-on-metal resurfacing arthroplasty of the hip: the influence of malpositioning of the components. J Bone Joint Surg Br 2008; 90(9): 1158–1163 [DOI] [PubMed] [Google Scholar]
- 3. Kwon YM, Glyn-Jones S, Simpson D, et al. Analysis of wear of retrieved metal-on-metal hip resurfacing implants revised due to pseudotumours. J Bone Joint Surg Br 2010; 92(3): 356–361 [DOI] [PubMed] [Google Scholar]
- 4. Langton D, Jameson S, Joyce T, et al. Early failure of metal-on-metal bearings in hip resurfacing and large-diameter total hip replacement: a consequence of excess wear. J Bone Joint Surg Br 2010; 92(1): 38–46 [DOI] [PubMed] [Google Scholar]
- 5. Morlock MM, Bishop N, Zustin J, et al. Modes of implant failure after hip resurfacing: morphological and wear analysis of 267 retrieval specimens. J Bone Joint Surg (Am) 2008; 90(3): 89–95 [DOI] [PubMed] [Google Scholar]
- 6. Catelas I, Wimmer MA. New insights into wear and biological effects of metal-on-metal bearings. J Bone Joint Surg (Am) 2011; 93(2): 76–83 [DOI] [PMC free article] [PubMed] [Google Scholar]
- 7. Langton D, Jameson S, Joyce T, et al. The effect of component size and orientation on the concentrations of metal ions after resurfacing arthroplasty of the hip. J Bone Joint Surg Br 2008; 90(9): 1143–1151 [DOI] [PubMed] [Google Scholar]
- 8. Matthies A, Underwood R, Cann P, et al. Retrieval analysis of 240 metal-on-metal hip components, comparing modular total hip replacement with hip resurfacing. J Bone Joint Surg Br 2011; 93(3): 307–314 [DOI] [PubMed] [Google Scholar]
- 9. Campbell P, Beaul PE, Ebramzadeh E, et al. A study of implant failure in metal-on-metal surface arthroplasties. Clin Orthopaed Relat Res 2006; 453: 35–46 [DOI] [PubMed] [Google Scholar]
- 10. Langton D, Joyce T, Jameson S, et al. Adverse reaction to metal debris following hip resurfacing: the influence of component type, orientation and volumetric wear. J Bone Joint Surg Br 2011; 93(2): 164–171 [DOI] [PubMed] [Google Scholar]
- 11. Elkins JM, O’Brien MK, Stroud NJ, et al. Hard-on-hard total hip impingement causes extreme contact stress concentrations. Clin Orthopaed Relat Res 2010; 469(2): 454–463 [DOI] [PMC free article] [PubMed] [Google Scholar]
- 12. Nevelos J, Ingham E, Doyle C, et al. Microseparation of the centers of alumina-alumina artificial hip joints during simulator testing produces clinically relevant wear rates and patterns. J Arthroplasty 2000; 15(6): 793–795 [DOI] [PubMed] [Google Scholar]
- 13. Angadji A, Royle M, Collins S, Shelton J. Influence of cup orientation on the wear performance of metal-on-metal hip replacements. Proc IMechE, Part H: J Engng Med 2009; 223(4): 449–457 [DOI] [PubMed] [Google Scholar]
- 14. Johnson KL. Contact mechanics. Cambridge University Press, Cambridge, UK: 1987 [Google Scholar]
- 15. Leslie IJ, Williams S, Isaac G, et al. High cup angle and microseparation increase the wear of hip surface replacements. Clin Orthopaed Relat Res 2009; 467(9): 2259–2265 [DOI] [PMC free article] [PubMed] [Google Scholar]
- 16. Jeffers J, Roques A, Taylor A, et al. The problem with large diameter metal-on-metal acetabular cup inclination. Bull NYU Hospital Joint Diseases 2009; 67(2): 189–192 [PubMed] [Google Scholar]
- 17. Langton D, Sprowson A, Joyce T, et al. Blood metal ion concentrations after hip resurfacing arthroplasty: a comparative study of articular surface replacement and Birmingham Hip Resurfacing arthroplasties. J Bone Joint Surg Br 2009; 91(10): 1287–1295 [DOI] [PubMed] [Google Scholar]
- 18. BS 7251-4: 1997. Orthopaedic joint prostheses — part 4: specification for articulating surfaces made of metallic, ceramic and plastics materials of hip joint prostheses.
- 19. Hart A, Ilo K, Underwood R, et al. The relationship between the angle of version and rate of wear of retrieved metal-on-metal resurfacings: a prospective, CT-based study. J Bone Joint Surg Br 2011; 93(3): 315–320 [DOI] [PubMed] [Google Scholar]
- 20. Murray D. The definition and measurement of acetabular orientation. J Bone Joint Surg Br 1993; 75(2): 228–232 [DOI] [PubMed] [Google Scholar]
- 21. BS 14242-1: 2002. Implants for surgery — wear of total hip-joint prostheses — part 1: loading and displacement parameters for wear-testing machines and corresponding environmental conditions for test.
- 22. Bergmann G, Deuretzbacher G, Heller M, et al. Hip contact forces and gait patterns from routine activities. J Biomech 2001; 34(7): 859–871 [DOI] [PubMed] [Google Scholar]
- 23. Weisstein E. Great circle. MathWorld–a Wolfram web resource, http://mathworld.wolfram.com/GreatCircle.html (2011, accessed 12 March 2011).
- 24. Lewinnek GE, Lewis J, Tarr R, et al. Dislocations after total hip-replacement arthroplasties. J Bone Joint Surg Am 1978; 60(2): 217–220 [PubMed] [Google Scholar]
- 25. Heisel C, Kleinhans JA, Menge M, Kretzer JP. Ten different hip resurfacing systems: biomechanical analysis of design and material properties. International Orthopaedics 2008; 33(4): 939–943 [DOI] [PMC free article] [PubMed] [Google Scholar]
- 26. Hutchings IM. Tribology: friction and wear of engineering materials. Butterworth-Heinemann Oxford, UK, 1992 [Google Scholar]
- 27. Fisher J. Bioengineering reasons for the failure of metal-on-metal hip prostheses: an engineer’s perspective. J Bone Joint Surg Br 2011, 93(8): 1001–1004 [DOI] [PubMed] [Google Scholar]
- 28. Mavraki A, Cann PM. Lubricating film thickness measurements with bovine serum. Tribol Int 2011; 44(5): 550–556 [Google Scholar]
- 29. Fan J, Myant CW, Underwood R, et al. Inlet protein aggregation: a new mechanism for lubricating film formation with model synovial fluids. Proc IMechE, Part H: J Engng Med 2011; 225: 696–709 [DOI] [PMC free article] [PubMed] [Google Scholar]
- 30. Wimmer MA, Fischer A, Büscher R, et al. Wear mechanisms in metal-on-metal bearings: the importance of tribochemical reaction layers. J Orthopaed Res 2010; 28: 436–443 [DOI] [PubMed] [Google Scholar]
- 31. Yew A, Jin Z, Donn A, et al. Deformation of press-fitted metallic resurfacing cups. Part 2: finite element simulation. Proc IMechE, Part H: J Engng Med 2006; 220(2): 311–319 [DOI] [PubMed] [Google Scholar]
- 32. Walker P, Gold B. The tribology (friction, lubrication and wear) of all-metal artificial hip joints. Wear 1971; 17(4): 285–299 [DOI] [PubMed] [Google Scholar]
- 33. Isaac G.H, Thompson J, Williams S, et al. Metal-on-metal bearings surfaces: materials, manufacture, design, optimization, and alternatives. Proc IMechE, Part H: J Engng Med 2006; 220(2): 119–133 [DOI] [PubMed] [Google Scholar]


