

Abstract
Patients with Down syndrome (DS) and acute lymphoblastic leukemia (ALL) have distinct clinical and biological features. Whereas most DS-ALL cases lack the sentinel cytogenetic lesions that guide risk assignment in childhood ALL, JAK2 mutations and CRLF2 overexpression are highly enriched. To further characterize the unique biology of DS-ALL, we performed genome-wide profiling of 58 DS-ALL and 68 non-Down syndrome (NDS) ALL cases by DNA copy number, loss of heterozygosity, gene expression, and methylation analyses. We report a novel deletion within the 6p22 histone gene cluster as significantly more frequent in DS-ALL, occurring in 11 DS (22%) and only two NDS cases (3.1%) (Fisher’s exact p = 0.002). Homozygous deletions yielded significantly lower histone expression levels, and were associated with higher methylation levels, distinct spatial localization of methylated promoters, and enrichment of highly methylated genes for specific pathways and transcription factor binding motifs. Gene expression profiling demonstrated heterogeneity of DS-ALL cases overall, with supervised analysis defining a 45-transcript signature associated with CRLF2 overexpression. Further characterization of pathways associated with histone deletions may identify opportunities for novel targeted interventions.
Keywords: Down syndrome, acute lymphoblastic leukemia (ALL), histone, JAK2, CRLF2
Introduction
Cure rates for childhood acute lymphoblastic leukemia (ALL) have improved dramatically in recent decades, in part due to recognition of molecular genetic lesions that define subgroups for which therapy can be specifically tailored. However, outcomes in some subgroups lag behind, including children with Down syndrome (DS) and ALL (DS-ALL). Children with DS have a 10 to 20-fold increased risk of developing ALL, and they have experienced poorer outcomes with more frequent treatment-related toxicities.(1) The cytogenetic abnormalities which are generally common in childhood ALL and contribute to risk-based treatment assignment, such as t(12;21) and hyperdiploidy, are markedly less frequent in DS-ALL.(1–3) Recently, two genetic lesions have been identified that are enriched in DS-ALL compared to NDS-ALL: activating mutations of Janus kinase 2 (JAK2), and alterations leading to high expression of cytokine receptor-like factor 2 (CRLF2). Activating JAK2 mutations have been identified in approximately 20% of DS-ALL,(4–6) as well as approximately 10% of a high-risk NDS-ALL cohort.(7) High expression of CRLF2 has been identified in approximately half of DS-ALL cases, compared to 5% of unselected childhood ALL and 14% of high-risk ALL.(8–14)
We sought to identify additional recurrent molecular abnormalities in DS-ALL. Such findings could provide prognostic information and guide the development of targeted therapies lacking the toxicities that conventional chemotherapeutic agents impose in this particularly vulnerable subset of patients. Here, we report on unique deletions of histone genes and altered methylation patterns in DS-ALL, identified in a cohort of 58 DS and 68 NDS cases of newly diagnosed B-precursor ALL (Table 1) by genome-wide profiling of DNA copy number and loss of heterozygosity (LOH), methylation, and gene expression.
Table 1.
Patient and sample characteristics.
| Type of case | Mean age in years (range) | Gender, number (%) | NCI risk group, number (%) | Mean initial WBC, 103/μl (range) | Mean % blasts in sample (range) | Total cases | SNP array cases | Methylation array cases | Expression array cases |
|---|---|---|---|---|---|---|---|---|---|
| DS-ALL | 6.5 (2.0–17.0) | 31 female (53.4) 27 male (46.6) | 22 HR (42.3) 30 SR (57.7) | 57.5 (80.3) | 86.1 (9.9) | 58 | 50 | 11 | 23 |
| DS paired germline | - | - | - | - | - | 23 | 23 | 0 | 0 |
| NDS ALL | 6.5 (1.0–16.0) | 31 female (45.6) 37 male (54.4) | 31 HR (47.7) 34 SR (52.3) | 51.9 (3.0, 765) | 81.4 (46, 100) | 68 | 65 | 7 | 26 |
| NDS paired germline | - | - | - | - | - | 12 | 12 | 0 | 0 |
DS indicates Down syndrome; ALL, acute lymphoblastic leukemia; NDS, non-Down syndrome; NCI, National Cancer Institute; WBC, white blood count; SNP, single nucleotide polymorphism; HR, high risk; and SR, standard risk.
Materials and Methods
Patient samples
All samples were obtained with informed consent under protocols approved by institutional review board (IRB) (U.S.) or ethics committee (Italy), and the study was approved by the Baylor College of Medicine and New York University IRBs. Ficoll-enriched, cryopreserved bone marrow samples were obtained from 58 DS and 68 NDS patients with B-precursor ALL diagnosed between 1989–2007 and treated on or according to protocols of the Pediatric Oncology Group, Children’s Oncology Group (COG), and the Associazione Italiana Ematologia ed Oncologia Pediatrica (AIEOP). Paired germline samples were obtained from subsequent bone marrows performed in complete remission.
DNA extraction and SNP arrays
DNA copy number and loss of heterozygosity (LOH) were assessed using the Illumina Human CNV370-Duo BeadChip single nucleotide polymorphism (SNP) array, containing over 370,000 probes with 5.0-kb median interprobe spacing (Illumina, San Diego, CA). DNA was extracted using standard methods (Qiagen Allprep DNA/RNA Mini Kit and QIAamp DNA Blood Mini Kit, Valencia, CA). Genotyping was performed using the Infinium II assay according to the manufacturer’s instructions.(15;16) Chips were scanned using the BeadChip scanner 500GX and image data imported to BeadStudio Genotyping Module version 3.1.3.0 (Illumina, San Diego, CA) for LOH analysis and GenomeStudio Genotyping Module 1.7.4 for CNV analysis and normalized using default settings.(16) Normalized values were used to analyze standard genotyping calls, copy number (CN), and loss of heterozygosity (LOH). The genotyping call of each SNP was aligned with the default reference set of 120 HapMap samples, to finalize the call as homozygous or heterozygous. The same alignment approach was used for assigning LOH and CN calls.
SNP data analysis
LogR ratio and allele status, determined as described above, were used by the Illumina CNV Partition 2.4.4 algorithm plug-in within GenomeStudio to identify copy number alterations (CNAs), and by the Illumina Homozygosity Detector 1.0.3 algorithm within BeadStudio to determine LOH. For CNV Partition, we used the default confidence threshold of 35 and minimum probe count of 3. The smooth log R ratio was selected to increase contrast and reduce noise. For Homozygosity Detector, we used the default minimum chi squared value of 23.5. For minimum SNPs per region, 75 was substituted for the default parameter of 50 because this reduced false-positive calls by 30% (the false-positive call rate was estimated in ALL samples with a germline pair by calculating the proportion of LOH calls in an ALL sample which were homozygous in both sample and germline pair). CNAs reported in the Database of Genomic Variants (http://projects.tcag.ca/variation/) were excluded as probable benign copy number variations, as were areas occurring in both a sample and its germline pair.
Mutation analysis
Whole genome amplification was performed for limited samples (illustra GenomiPhi V2 DNA amplification kit; GE Life Sciences, Piscataway, NJ). All coding exons of genes of interest were amplified by PCR (Table S1) using primers designed using Primer3 (17) or published.(18) Thermal cycling parameters were 94°C for 2 minutes followed by 30 cycles of 94°C for 45 seconds, the annealing temperature noted in Table S1 for 30 seconds, and 72°C for 45 seconds. JAK2 exon 16 PCR amplification was performed as previously described.(6) Sanger sequencing was performed by Agencourt Bioscience Corporation, and mutation analysis utilized Sequencher 4.8 software (Gene Codes Corporation, Ann Arbor, MI).
Copy number validation
Validation was performed by real-time quantitative PCR using a LightCycler 1.2 instrument and LightCycler FastStart DNA Master SYBR Green 1 (Roche Molecular Diagnostics, Indianapolis, IN), using the 3′ portion of the TCOF1 gene as control locus.(19) Other primers were designed using Primer3(17) (Table S1). Thermal cycling parameters were 95°C for 10 minutes followed by 45 cycles of 95°C for 10 seconds, 60°C for 7 seconds, and 72°C for 20 seconds. All values were determined in triplicate, by standard curve. Normalized ratios 0.7–1.2 were considered normal, 0.3–0.7 indicative of heterozygous deletion, and <0.3 indicative of homozygous deletion, based on previous genomic PCR cutoffs.(20)
Methylation arrays
Genomic DNA was bisulfite converted according to manufacturer’s instructions (EZ-methylation Kit,™ Zymo Research, Orange, CA) and analyzed by Human Methylation27 BeadChip, an array containing 27,578 CpG sites representing more than 14,000 genes (Illumina, San Diego, CA), according to manufacturer’s instructions. Chips were scanned by BeadChip scanner 500GX and image data imported to GenomeStudio v2009.1 (Illumina, San Diego, CA) and average normalized. Methylation at each interrogated CpG site is measured as the ratio of signal from a methylated probe relative to the sum of methylated and unmethylated probes. Methylation values (β, ranging from 0 to 1) were determined by GenomeStudio v2009.1 using default parameters. Pathway analysis was performed on exported report files, using two curated gene sets obtained from the Broad Institute’s Molecular Signatures Database (www.broad.mit.edu/gsea/msigdb/)(21): the Canonical Pathways collection of 639 gene sets(22); and the Transcription Factor Targets collection of 500 sets of genes sharing a transcription factor binding site.(23) Gene sets with <5 members were excluded to avoid inflated scorings for small gene sets. Overlap was calculated using the hypergeometric distribution.
RNA extraction and arrays
Total RNA was extracted by Allprep DNA/RNA Mini kit (Qiagen, Valencia, CA) and quality verified by Agilent 2100 Bioanalyzer (Agilent, Palo Alto, CA). Total RNA was used as template in a single amplification (RiboAmp OA, Arcturus, Mountain View, CA) according to manufacturer’s recommendation. Biotinylated cRNA was fragmented, hybridized to Affymetrix U133 Plus2.0 microarrays (Affymetrix, Santa Clara, CA), stained with strepatividin-phycoerythrin, and scanned by GeneArray scanner (Agilent, Santa Clara, CA) according to manufacturer’s instructions. These arrays contain 54,675 probe sets representing approximately 38,500 genes.
Gene expression data analysis
Expression values were generated by AffymetrixMAS 5.0, scaled to an average of 1,000 per gene chip, and log transformed. Probe sets without Entrez gene identifiers were removed, as were probe sets with minimal sample variation (interquartile range < 0.5). Unsupervised hierarchical clustering was performed using “hclust” in R (www.r-project.org). Supervised analysis was performed using dChip (www.dchip.org), using a t-test to compare samples with filtering to select probe sets with fold change >2 (using the lower 90% confidence bound of fold change(24)), p value <0.01, and false discovery rate <10%. Gene set enrichment analysis was performed (GSEA 2.0.4, http://www.broad.mit.edu/gsea/) on genes ranked by fold change (21;25), using 1000 permutations to examine the Canonical Pathways gene sets.(22) Gene sets containing <10 or >200 genes were excluded to avoid inflated scorings for small gene sets and inaccurate normalization for large ones.
Gene expression validation
Quantitative real-time PCR was performed (iScript™ cDNA Synthesis Kit, Bio-Rad, Hercules, CA) with amplification (PerfeCTa SYBR Green FastMix, VWR, West Chester, PA). QuantiTect Gene specific primers were used (Qiagen, Valencia, CA) for CRLF2 (Qiagen QT01156183), YES1 (Qiagen QT00037940), IRX2 (Qiagen QT00042280), and DUSP6 (Qiagen HI QT00209986). Primers for β2 microglobulin were 5′-ATGTGTCTGGGTTTCATCCATCC-3′ and 5′-AGTCACATGGTTCACACGGCA-3′. Amplification was monitored by DNA Engine Opticon System (MJ Research, Waltham, MA). Data was normalized to β2 microglobulin, and relative expression determined using the ΔΔCt method.
Survival analysis
Event-free survival estimates were obtained using the Kaplan-Meier method, and standard errors of estimates were calculated by the method of Peto and Peto.(26) Time to event was calculated as the time from study entry to first event (relapse, secondary malignancy, or death) or date of last contact. The log-rank test was used for comparison of survival curves.
Data access
All genomic data have been deposited in the National Center for Biotechnology Information Gene Expression Omnibus (http://www.ncbi.nlm.nih.gov/geo), accession number GSE21094.
Results
A summary of patient and sample characteristics is provided in Table 1, and further details including cytogenetic features in Tables S2 and S3. In brief, we performed SNP, methylation, and gene expression profiling on all diagnostic B-precursor ALL and paired remission specimens with adequate DNA and/or RNA, from an overall cohort of 58 DS-ALL and 68 NDS-ALL samples. JAK2 mutation status at exon 16 has been previously reported(6) and is also included in Table S2. The NDS-ALL control group was selected to represent a variety of known cytogenetic subgroups: t(12;21); t(1;19); t(9;22); t(4;11); high hyperdiploidy (<50 chromosomes); trisomy 21 (not constitutional) without high hyperdiploidy; hypodiploidy; as well as cases with normal or complex cytogenetics (defined as three or more unrelated abnormalities, excepting high and low hyperdiploidy). NDS-ALL cases with acquired trisomy 21 were included because we sought to discriminate between findings unique to DS-ALL and those also shared in NDS-ALL with trisomy 21, since this is the most common trisomy arising in childhood ALL blasts.
SNP array profiling
SNP array profiling was performed using the Illumina Human CNV370-Duo BeadChip array (Illumina, San Diego, CA) for all samples with sufficient DNA for SNP array analysis, which comprised 50 DS-ALL, 65 NDS-ALL, 23 paired DS germline, and 12 paired NDS germline bone marrow samples. Since the goal of this project was to identify somatic alterations associated with leukemic transformation rather than germline events, we filtered out of the analysis any findings occurring in both an ALL sample and its paired germline sample,(27) and findings that matched common inherited copy number variants (CNVs) previously reported in the Database of Genomic Variants (http://projects.tcag.ca/variation/).
Overall number of copy number gains and losses did not differ significantly between DS-ALL and NDS-ALL cases. The mean number of gains per case was 2 for both groups, and mean number of losses per case was 15 versus 12 (Table S4), confirming the relative genomic stability that has been reported previously in ALL compared to some other malignancies.(20) Interestingly, although the sentinel cytogenetic events used in risk stratification differ in frequency between the DS-ALL and NDS-ALL cases, deletions of genes involved in B-cell development including EBF1, IKZF1, and PAX5, recently identified in childhood ALL,(20) were also observed with similar frequencies in DS-ALL and NDS-ALL (Table S5), consistent with two smaller analyses of copy number variation in DS-ALL.(5;10) Thus, our data suggest that DS-ALL does not differ significantly from NDS-ALL in the number and size of copy alterations, nor in the frequency of alterations in B-cell development genes and CDKN2A.
Novel copy number abnormalities in DS-ALL cases were also identified (Table S6). Most occurred in fewer than 10% of cases, but one abnormality was significantly more frequent in DS-ALL: a deletion within the histone gene cluster at 6p22 occurred in 11 DS-ALL cases (22%) and only two NDS-ALL cases (3.1%), Fisher’s exact test p = 0.002. The 33.8-kb critical region was deleted in 11 DS-ALL samples, 6 homozygous and 5 heterozygous. A nearby 88.6-kb region contained deletions in 7 DS-ALL samples (four of which also contained the first deletion) and 9 NDS-ALL samples (Figure 1A). Both deleted regions contain only histone genes. Paired germline samples confirmed that the deletions were somatic in all 10 DS-ALL cases for which germline material was available. Interestingly, four of the affected samples exhibited a larger region of copy-neutral LOH for the terminal portion of chromosome 6p, within which occurred the focal, homozygous histone locus deletion (Figure 1B), a pattern which could arise due to a mechanism such as gene conversion or microhomology-mediated break-induced replication.(28) Copy number determinations by SNP array were validated using genomic quantitative PCR (qPCR) for the first deleted histone region in two representative cases with heterozygous deletions and two with homozygous deletions (Figure 1C). Gene expression data confirmed that homozygous but not heterozygous loss resulted in lower expression levels (Figure 1D) for those histone genes which were evaluable (some lacked unique probe-sets due to homology, according to Affymetrix probe-set annotation, www.affymetrix.com/index.affx).
Figure 1. Histone locus gene deletions, LOH, and gene expression.

A. Deletions in 6p22 region. Vertical lines indicate the histone genes falling within the deletion critical regions. Black solid rectangles indicate DS-ALL homozygous deletions, black hatched rectangles DS-ALL heterozygous, gray solid rectangles indicate NDS-ALL homozygous deletions, gray hatched rectangles NDS-ALL heterozygous deletions. Rectangles connected by a horizontal line indicate that the two deletions occur jointly within the same sample. B. Representative case with region of LOH containing a focal homozygous deletion. The upper plot shows allele frequency, with gray bar indicating region of LOH; the lower plot shows copy number, with red arrow indicating focal homozygous deletion. C. Real-time quantitative PCR (qPCR) validation of SNP array copy number abnormalities. White bar indicates a normal bone marrow control; black bars indicate two DS-ALL cases with homozygous deletions by SNP array; hatched bars indicate two DS-ALL cases with heterozygous deletions by SNP array. Histogram heights indicate copy number for the HIST1H4D gene as determined by qPCR. In tumor samples, ratio values less than 0.3 are considered consistent with homozygous deletion and ratio values 0.3–0.7 consistent with heterozygous deletion.(20) D. Log2 normalized expression levels for representative histone genes in DS-ALL cases containing 0, 1, or 2 histone gene copies. Each box indicates interquartile range and central line indicates median.
DS indicates Down syndrome; ALL, acute lymphoblastic leukemia; NDS, non-Down syndrome; LOH, loss of heterozygosity.
Histone gene mutation analysis
Due to the frequency of the first histone locus deletion in DS-ALL, we also sequenced the 6 deleted genes in this critical region to determine whether they might harbor mutations in those cases with heterozygous deletions and/or in additional cases without copy number change. We sequenced the coding exons as well as a highly conserved 26-nucleotide stem-loop sequence in the 3′-untranslated region (3′-UTR) which plays a key functional role in histone transcriptional regulation(29) in all DS-ALL cases. If mutations were detected, the paired germline DNA was sequenced as well when available. A nonsynonymous HIST1H2BE point mutation was identified in a single DS-ALL case with a heterozygous deletion, and a two-base insertion in the conserved 3′-UTR stem-loop sequence of HIST1H4D was identified in four DS-ALL cases (Table 2). The two-base insertion occurred one base distal to the 26-nucleotide sequence crucial for histone mRNA regulation which is most highly conserved across all human histone genes (Figure S1). Interestingly, quantitative PCR indicated that three cases with this two-base insertion and with mRNA available had lower HIST1H4D levels compared with wild-type cases (Figure S2). The other variant detected was a HIST1H2BE missense mutation occurring in a single DS-ALL case. This mutation is reported in dbSNP (http://www.ncbi.nlm.nih.gov/projects/SNP/), with unknown clinical association, and is predicted to be benign by PolyPhen(30) and Align GVGD(31;32), online tools to predict the functional significance of nonsynonymous changes.
Table 2.
Histone gene mutations in DS-ALL.
| Gene | Sequence | Putative change | dbSNP identifier | # cases | Copy number status at histone locus | # confirmed somatic |
|---|---|---|---|---|---|---|
| HIST1H2BE | c.59C>G | T20R | rs61978632 | 1 | Heterozygous | 1 |
| HIST1H4D | insertion of “TC” | conserved 3′UTR stem-loop sequence | none | 4 | 1 heterozygous, 1 homozygous, 2 wild-type | 1 somatic, 1 germline, 2 unavailable |
DS indicates Down syndrome; ALL, acute lymphoblastic leukemia; NDS, non-Down syndrome.
We also assessed the prognostic significance of the histone locus deletion associated with DS-ALL. Kaplan-Meier survival curve analysis did not demonstrate a significant difference in event-free survival (EFS) in comparing DS-ALL patients with homozygous histone locus deletions to DS-ALL patients with heterozygous or wild-type status (the latter two groups were combined since heterozygous deletions did not result in significant differences in gene expression levels). The 5-year EFS was 58.3 + 25.8% versus 84.3 + 6.5% respectively, p = 0.375 (Figure S3).
Methylation array profiling
Since epigenetic changes including hypermethylation of CpG sites within gene promoters can play a key role in malignant transformation, we performed genome-wide methylation profiling of a subset of 18 samples, 11 DS-ALL and 7 NDS-ALL, from the overall cohort using the Illumina HumanMethylation27 DNA Analysis BeadChip (Illumina, San Diego, CA). Among the 11 DS-ALL cases analyzed, 3 were homozygous and 2 heterozygous for the first histone deletion region, and one of the NDS-ALL cases was heterozygous for the second histone deletion region. The HumanMethylation27 array provides quantitative measurements of DNA methylation for 27,578 CpG sites spanning more than 14,000 genes. The methylation level of each site is represented as a β value which ranges continuously from 0 (0% methylated) to 1 (100% methylated).
We first examined the level of methylation of all probe-sets genome-wide, comparing the number of high and low methylated probe-sets in each sample group, defined as average β scores >0.9 and <0.1, respectively (Figure 2A and Table S7). The number of low methylated probe-sets did not differ significantly across groups (one-way analysis of variance, p = 0.149). DS-ALL and NDS-ALL cases did not differ significantly, but the DS-ALL subgroup bearing homozygous histone deletions exhibited significantly more highly methylated probe-sets than other DS-ALL cases (mean 1877 versus 958, Student’s two-sample t-test, p = 0.018) and NDS-ALL cases (mean 1877 versus 1009, Student’s two-sample t-test, p= 0.0042). When highly methylated probe-sets were evaluated for genome-wide localization, the highly methylated sites in the histone homozygous deletion cases were significantly associated with several cytobands, several of which were distinct from those of other ALL cases (Figure 2B).
Figure 2. Methylation profiling in DS-ALL and comparison cases.

A. Number of high and low methylated probe-sets in selected subgroups of cases. Methylation is measured by β, which ranges from 0 to 1. High methylation is defined as β > 0.9 and depicted by black histogram bars; low methylation defined as β < 0.1 and depicted by gray histogram bars. Asterisk indicates that histone homozygous deletion subgroup demonstrated significantly more highly methylated probe-sets than other DS-ALL and NDS-ALL cases. B. Highly methylated sites that were significantly associated with a chromosomal cytoband (Molecular Signatures Database overlap calculation with p-value < 0.01) exhibit a distinct spatial distribution in the DS-ALL histone homozygous deletion cases (red) compared to other DS-ALL (gray) and NDS-ALL (black) cases.
To assess potential functional effects of highly methylated genes in the histone homozygous deletion cases, we integrated methylation and expression data. We identified 109 genes which were highly methylated (average β scores >0.9) in histone homozygous deletion cases and not in other ALL cases, and which also exhibited low gene expression (expression values in the bottom quartile for these cases). We computed the overlap between this 109-gene set and two genes sets obtained from the Broad Institute’s Molecular Signatures Database (Table 3): the Canonical Pathways gene sets, a collection of 639 gene sets curated from pathway databases as canonical representations of biological processes(22); and the Transcription Factor Targets, a collection of 500 gene sets containing genes that share a transcription factor binding site defined in the TRANSFAC database (version 7.4, www.gene-regulation.com/).(23) Eleven genes from our 109-gene set significantly overlapped with two Canonical Pathway gene sets: genes involved in cytokine-cytokine receptor interactions; and genes involved in neuroactive ligand receptor interactions. In addition, 29 of the 109 genes significantly overlapped with 5 Transcription Factor Targets gene sets, defined by common transcription factor binding site motifs.
Table 3.
Canonical pathways and motifs significantly enriched in genes with high methylation and low expression in histone homozygous deletion cases.
| Gene set name | Transcription factor associated with binding site motif | k | K | p value | Genes in overlap |
|---|---|---|---|---|---|
| Canonical pathways(22) | |||||
| HSA04060_CYTOKINE_CYTOKINE_RECEPTOR_INTERACTION | 7 | 257 | 2.44x10⁻³ | LEP, IL22RA1, CNTF, XCR1, INHBE, CCL11, CLL19 | |
| HSA04080_NEUROACTIVE_LIGAND_RECEPTOR_INTERACTION | 5 | 254 | 2.96x10⁻² | LEP, GALR1, P2RY4, GRM6, GABRG3 | |
| Transcription factor targets(23) | |||||
| GGGCGGR_V$SP1_Q6 | Sp1 transcription factor (SP1) | 8 | 3053 | 6.92 x10⁻⁵ | NR2E1, LEP, IL22RA1, AKT1S1, BLZF1, SLC6A11, C9ORF84, BHMT2 |
| CTTTGT_V$LEF1_Q2 | Lymphoid enhancing binding factor 1 (LEF1) | 5 | 2036 | 9.96 x10⁻⁴ | NR2E1, AQP4, KCNE4, PTGFRN, CDH5 |
| V$HNF1_C | Hepatocyte nuclear factor 1 (HNF1A) | 5 | 253 | 2.93x10⁻² | AQP4, SOX3, MAB21L2, SLC5A4, SPINK1 |
| CAGGTG_V$E12_Q6 | Transcription factor 3 (TCF3) | 13 | 2571 | 3.07x10⁻² | NR2E1, SLC6A11, FLJ20184, ANXA9, SOX3, GAL41, CDH1, RASL12, CNNM1, RIT2, RAB25, OTOS, ZNF80 |
| CTTTGA_V$LEF1_Q2 | Lymphoid enhancing binding factor 1 (LEF1) | 5 | 1270 | 4.50x10⁻² | NR2E1, CNTF, XCR1, FLJ20184, BSND |
Pathway analysis was performed for the 109-gene set with high methylation (β>0.9) and low gene expression (bottom quartile of expression values) in histone homozygous deletion cases. Overlap was computed between this 109-gene set and the Canonical Pathways gene sets and the Transcription Factor Targets gene sets from the Broad Institute’s Molecular Signatures Database. Gene sets less than 5 were excluded to avoid inflated scorings for small gene sets. P values are associated with the hypergeometric distribution (k, K, n, N), where K indicates the number of genes in the gene set, k indicates the number of genes in the overlap, N indicates the number of genes in the collections, and n the number of genes in the comparison.
Thus, homozygous histone deletions were associated with altered methylation status as evidenced by both higher overall level of methylation and spatially distinct clustering of methylation. Moreover, those genes with unique high methylation and low expression in the homozygous histone deletion cases were significantly enriched for specific gene pathways and transcription factor binding motifs.
Gene expression profiling
In addition to performing genome-wide assessment of copy number and methylation changes, we assessed a subset of the sample cohort for gene expression. Gene expression profiling was performed for 23 DS-ALL and 26 NDS-ALL samples using the Affymetrix U133-Plus 2 array. As expected, unsupervised hierarchical clustering analysis demonstrated clustering of NDS-ALL cases belonging to some known cytogenetic subgroups such as E2A-PBX1 and MLL rearrangement (Figure 3A). In contrast, neither DS-ALL cases overall nor the JAK2-mutated, histone deletion, or high CRLF2 expressing DS-ALL cases formed a cohesive cluster. Supervised analysis comparing histone deletion cases (either homozygous alone, or homozygous and heterozygous) to wild-type cases did not reveal genes with significant differential expression.
Figure 3. Gene expression profiling in DS-ALL and comparison cases.
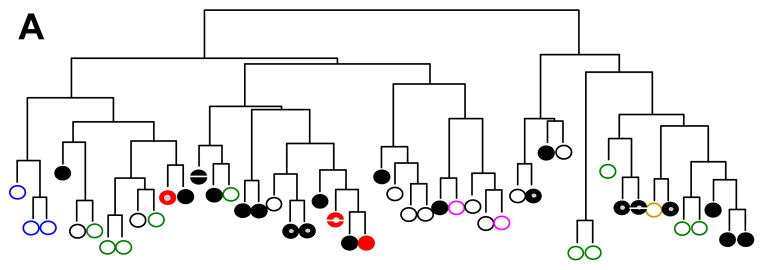

A. Unsupervised hierarchical clustering analysis of DS-ALL and NDS-ALL cases. DS indicates Down syndrome; ALL, acute lymphoblastic leukemia; NDS, non-Down syndrome. NDS-ALL cases without sentinel cytogenetic lesions depicted by black open circles; MLL-rearranged cases by blue open circles; hyperdiploid cases by green open circles; E2A-PBX1 fusion by pink open circles; BCR-ABL1 fusion by brown open circle; DS-ALL cases by black solid circles; DS-ALL cases with homozygous histone deletion by red solid circles; CRLF2 overexpression by gray center; JAK2 mutation by white central bar. B. Gene expression signature of top differentially expressed genes in DS-ALL cases with high versus low CRLF2 expression. Each column indicates a case, with top bar depicting CRLF2-low cases in green and CRLF2-high cases in red. Each row indicates one of the top 45 differentially expressed transcripts as determined by dChip supervised analysis.
Because novel aberrations resulting in high CRLF2 expression have been recently identified in approximately 50% of DS-ALL cases,(8–10) we also performed a supervised analysis among DS-ALL cases to identify a gene expression signature associated with high CRLF2 expression. The genetic changes underlying CRLF2 abnormalities in this cohort have been described in detail elsewhere.(9) High CRLF2 expression (defined as expression log2 ratio >6) was demonstrated by expression array in 10 of 23 DS-ALL cases, and in all cases was associated with the P2RY8-CRLF2 fusion (Table S2 and (9)). Supervised analysis demonstrated 39 genes (45 transcripts) that were significantly differentially expressed in high versus low CRLF2 cases with a false discovery rate <10% (Figure 3B). Expression levels were validated by RT-PCR for several of the most significantly differentially expressed genes (Figure S4). Functional analysis of this 45-transcript “DS-ALL CRLF2” signature using GSEA did not identify significant enrichment for any Canonical Pathways or Gene Ontology gene sets available in the Molecular Signatures Database.(21) We also compared our “DS-ALL CRLF2 signature” to a “DS-ALL profile”(10) derived from profiling of 97 pediatric DS-and NDS-ALL cases; and to a “CRLF2 adult signature”(12) derived from profiling of 22 adult B-lineage ALL cases with and without CRLF2 overexpression. Interestingly, our “DS-ALL CRLF2 signature” demonstrated enrichment for “DS-ALL profile” but not “CRLF2 adult signature” genes (false discovery rate <25%, nominal p value <5%), and only three of 351 genes in the “DS-ALL profile” were significantly enriched: CRLF2, IRX2, and IGJ.
Discussion
The dramatic improvements in survival in childhood ALL in the past several decades are attributable in part to the recognition that ALL is composed of heterogeneous subtypes with differences in pathogenesis and treatment response. These insights have led to stratification of patients to regimens of varying intensity, and more recently, to assignment of biologically defined subgroups to therapies targeting the underlying genetic lesion, e.g. inhibitors of BCR-ABL and FLT3. The recent identification of activating JAK2 mutations and CRLF2 overexpression provide possible explanations for disease pathogenesis and potential targets for novel therapies in approximately half of DS-ALL cases, but the rest remain molecularly uncharacterized.
In this study we performed comprehensive analysis of DNA copy number change, LOH, methylation and RNA expression in a set of DS-ALL compared with NDS-ALL cases. Overall, the DS-ALL cases demonstrated notable heterogeneity, and similarity in many respects to NDS-ALL. Although classic cytogenetic abnormalities occur much less frequently in DS-ALL, both the overall number and size of genomic alterations, and deletions of B-cell development genes, were similar in DS-ALL and NDS-ALL. These observations may explain in part why gene expression analysis did not demonstrate a distinct DS-ALL signature in this and a prior report.(10)
Our copy number analysis identified a novel abnormality that, like JAK2 and CRLF2 alterations, appears enriched in DS-ALL: a specific deletion of histone genes at the chromosome 6p22 histone locus in 22% of cases. This deletion did not occur in any NDS-ALL cases with trisomy 21, suggesting a specific association with DS-ALL rather than with ALL bearing trisomy 21. We also identified a second histone deletion occurring at similar frequencies in both DS-ALL (14%) and NDS-ALL (13.8%) cases. A third, distinct deletion at the 6p22 histone locus has been reported previously in NDS-ALL, involving different histone genes and affecting a smaller percentage of NDS-ALL cases (6.8%).(20) The previously reported region lies approximately 30 kb distal to the first deletion described here and 1.52 Mb proximal to the second deletion, and our probe coverage was adequate (six) to document normal copy number at the previously reported region. Our mutation analysis identified a single somatic missense mutation in HIST1H2BE; and interestingly, a two-base insertion in the conserved consensus region of HIST1H2B in four DS-ALL cases. Since the consensus region is critical to histone mRNA processing, translation and degradation,(29) this mutation could potentially impact HIST1H2B transcription and/or translation, and mRNA levels in the three cases with material available did indicate significantly lower levels compared to wild-type, similar to that of the cases with homozygous deletions. Thus, while copy number change was the predominant histone gene lesion observed, a small number of sequence alterations were also identified, with possible functional consequences which warrant further investigation. The survival analysis shows a trend toward adverse survival impact, but small patient numbers in the histone homozygous deletion group limit statistical power.
It is well-established that histone modifications can play a role in the onset and progression of leukemia and other cancers,(33;34) but the mechanism by which deletion of a subset of histone genes might promote leukemogenesis remains unclear. Each of the five core histone proteins that comprise the nucleosome is encoded by a redundant set of between 6–17 histone genes encoding similar or in some cases identical protein isoforms (Table S8).(35) Histone post-translational modifications play an important role in transcriptional regulation by altering chromatin accessibility to DNA transcription factors.(36) Different gene isoforms may have different tendencies to acquire such modifications, but the existing literature on chromatin modifications is essentially blind to possible differences between histone isoforms. Our methylation data suggest that the histone homozygous deletion is associated with alterations in methylation including higher overall levels of methylation; differential spatial localization of highly methylated sites; and enrichment of specific pathways and transcription-binding factor motifs among genes with high methylation and low expression, including genes involved in cytokine-receptor interactions which may play key roles in modulating lymphoid proliferation, trafficking, and differentiation. The enriched transcription factor binding motifs include LEF1 and TCF3, each of which is deleted in some cases of ALL.(20) Hypermethylation of these transcription factors’ promoters could constitute an alternative method of downregulating the same set of genes. Further investigation will be necessary to gain additional insights into the functional effects of histone deletions in ALL.
Gene expression profiling demonstrated that DS-ALL cases as a group do not display a dominant gene expression signature. DS-ALL cases with CRLF2 overexpression demonstrate a distinctive signature upon supervised analysis, with enrichment for a “DS-ALL profile”(10) but not a “CRLF2 adult signature.”(12) These findings suggest that the downstream effects of CRLF2 alterations may differ significantly in pediatric DS-ALL versus adult NDS-ALL. Further studies will be necessary to elucidate whether such differences correlate with distinct molecular aberrations (e.g. CRLF2-P2RY8 fusion; IGH@ rearrangement; F232C mutation) or other factors. One possible explanation for the lack of clustering of CRLF2 overexpressing cases on unsupervised analysis is that JAK2 and CRLF2 alterations may primarily effect changes in signaling pathways via post-transcriptional/translation modifications such as phosphorylation.
Taken together, the results of genomic profiling in DS-ALL suggest that leukemogenesis does not occur due to a single molecular mechanism. A distinction between initiating (driver) and cooperating (passenger) mutations in leukemogenesis is well-established.(37) As noted above, cooperating oncogenic events such as CDKN2A deletion and alterations of B-cell development genes did not differ between DS-ALL and NDS-ALL. In contrast, other lesions such as JAK2 and CRLF2 aberrations and the histone gene deletion we report here, occur at a markedly higher frequency in DS-ALL. Further investigations of the etiology of these genetic alterations, and characterization of their functional effects, may eventually enable prevention, early detection, and/or development of novel targeted therapies for DS-ALL.
Supplementary Material
Acknowledgments
We thank Susan Hilsenbeck, Jian Wang, Alexander Yu and Charlotte Ahern for biostatistical support; Daryl Scott for assistance with genomic quantitative PCR; Brandon Ballard for assistance with PCR and data analysis; Emanuela Giarin for assistance with AIEOP sample annotation; Richard Harvey for discussion and sharing preliminary bioinformatic analysis; and the patients and families whose participation made this work possible. This work was supported in part by a Bear Necessities Pediatric Research Foundation Grant; Children’s Cancer Research Foundation Grant; National Institutes of Health Pediatric Oncology Clinical Research Training Grant CA90433-06; Gillson Longenbaugh Foundation; Kurt Groten Family Research Scholars’ Program (K.R.R.); and the National Cancer Institute (NCI; SPEC U01 CA114762 and Genomics Core of the NYU Cancer Institute P30 CA016087, W.L.C.).
Footnotes
Supplementary information is available on the Leukemia website (http://www.nature.com/leu).
Conflict of Interest: No conflicts to disclose.
References
- 1.Whitlock JA. Down syndrome and acute lymphoblastic leukaemia. Br J Haematol. 2006 Dec;135(5):595–602. doi: 10.1111/j.1365-2141.2006.06337.x. [DOI] [PubMed] [Google Scholar]
- 2.Forestier E, Izraeli S, Beverloo B, Haas O, Pession A, Michalova K, et al. Cytogenetic features of acute lymphoblastic and myeloid leukemias in pediatric patients with Down syndrome: an iBFM-SG study. Blood. 2008 Feb 1;111(3):1575–83. doi: 10.1182/blood-2007-09-114231. [DOI] [PubMed] [Google Scholar]
- 3.Maloney KW, Carroll WL, Carroll AJ, Devidas M, Borowitz MJ, Martin PL, et al. Down syndrome childhood acute lymphoblastic leukemia has a unique spectrum of sentinel cytogenetic lesions that influences treatment outcome: a report from the Children’s Oncology Group. Blood. 2010 May 4; doi: 10.1182/blood-2009-07-235291. [DOI] [PMC free article] [PubMed] [Google Scholar]
- 4.Bercovich D, Ganmore I, Scott LM, wainreb G, Birger Y, Elimelech A, et al. Mutations of JAK2 in acute lymphoblastic leukaemias associated with Down’s syndrome. Lancet. 2008 Oct 25;372(9648):1484–92. doi: 10.1016/S0140-6736(08)61341-0. [DOI] [PubMed] [Google Scholar]
- 5.Kearney L, Gonzalez De CD, Yeung J, Procter J, Horsley SW, Eguchi-Ishimae M, et al. Specific JAK2 mutation (JAK2R683) and multiple gene deletions in Down syndrome acute lymphoblastic leukemia. Blood. 2009 Jan 15;113(3):646–8. doi: 10.1182/blood-2008-08-170928. [DOI] [PubMed] [Google Scholar]
- 6.Gaikwad A, Rye CL, Devidas M, Heerema NA, Carroll AJ, Izraeli S, et al. Prevalence and clinical correlates of JAK2 mutations in Down syndrome acute lymphoblastic leukaemia. Br J Haematol. 2009 Mar;144(6):930–2. doi: 10.1111/j.1365-2141.2008.07552.x. [DOI] [PMC free article] [PubMed] [Google Scholar]
- 7.Mullighan CG, Zhang J, Harvey RC, Collins-Underwood JR, Schulman BA, Phillips LA, et al. JAK mutations in high-risk childhood acute lymphoblastic leukemia. Proc Natl Acad Sci U S A. 2009 May 22;106(23):9414–8. doi: 10.1073/pnas.0811761106. [DOI] [PMC free article] [PubMed] [Google Scholar]
- 8.Russell LJ, Capasso M, Vater I, Akasaka T, Bernard OA, Calasanz MJ, et al. Deregulated expression of cytokine receptor gene, CRLF2, is involved in lymphoid transformation in B-cell precursor acute lymphoblastic leukemia. Blood. 2009 Sep 24;114(13):2688–98. doi: 10.1182/blood-2009-03-208397. [DOI] [PubMed] [Google Scholar]
- 9.Mullighan CG, Collins-Underwood JR, Phillips LA, Loudin MG, Liu W, Zhang J, et al. Rearrangement of CRLF2 in B-progenitor- and Down syndrome-associated acute lymphoblastic leukemia. Nat Genet. 2009 Nov;41(11):1243–6. doi: 10.1038/ng.469. [DOI] [PMC free article] [PubMed] [Google Scholar]
- 10.Hertzberg L, Vendramini E, Ganmore I, Cazzaniga G, Schmitz M, Chalker J, et al. Down syndrome acute lymphoblastic leukemia, a highly heterogeneous disease in which aberrant expression of CRLF2 is associated with mutated JAK2: a report from the International BFM Study Group. Blood. 2010 Feb 4;115(5):1006–17. doi: 10.1182/blood-2009-08-235408. [DOI] [PubMed] [Google Scholar]
- 11.Harvey RC, Mullighan CG, Chen IM, Wharton W, Mikhail FM, Carroll AJ, et al. Rearrangement of CRLF2 is associated with mutation of JAK kinases, alteration of IKZF1, Hispanic/Latino ethnicity, and a poor outcome in pediatric B-progenitor acute lymphoblastic leukemia. Blood. 2010 Jul 1;115(26):5312–21. doi: 10.1182/blood-2009-09-245944. [DOI] [PMC free article] [PubMed] [Google Scholar]
- 12.Yoda A, Yoda Y, Chiaretti S, Bar-Natan M, Mani K, Rodig SJ, et al. Functional screening identifies CRLF2 in precursor B-cell acute lymphoblastic leukemia. Proc Natl Acad Sci U S A. 2010 Jan 5;107(1):252–7. doi: 10.1073/pnas.0911726107. [DOI] [PMC free article] [PubMed] [Google Scholar]
- 13.Cario G, Zimmermann M, Romey R, Gesk S, Vater I, Harbott J, et al. Presence of the P2RY8-CRLF2 rearrangement is associated with a poor prognosis in non-high-risk precursor B-cell acute lymphoblastic leukemia in children treated according to the ALL-BFM 2000 protocol. Blood. 2010 Jul 1;115(26):5393–7. doi: 10.1182/blood-2009-11-256131. [DOI] [PubMed] [Google Scholar]
- 14.Ensor HM, Schwab C, Russell LJ, Richards SM, Morrison H, Masic D, et al. Demographic, clinical and outcome features of children with acute lymphoblastic leukemia and CRLF2 deregulation: results from the MRC ALL97 clinical trial. Blood. 2011 Feb 17;117(7):2129–36. doi: 10.1182/blood-2010-07-297135. [DOI] [PubMed] [Google Scholar]
- 15.Steemers FJ, Chang W, Lee G, Barker DL, Shen R, Gunderson KL. Whole-genome genotyping with the single-base extension assay. Nat Methods. 2006 Jan;3(1):31–3. doi: 10.1038/nmeth842. [DOI] [PubMed] [Google Scholar]
- 16.Peiffer DA, Le JM, Steemers FJ, Chang W, Jenniges T, Garcia F, et al. High-resolution genomic profiling of chromosomal aberrations using Infinium whole-genome genotyping. Genome Res. 2006 Sep;16(9):1136–48. doi: 10.1101/gr.5402306. [DOI] [PMC free article] [PubMed] [Google Scholar]
- 17.Rozen S, Skaletsky HJ. Primer3 on the WWW for general users and for biologist programmers. In: Krawetz S, Misener S, editors. Bioinformatics Methods and Protocols: Methods in Molecular Biology. Totowa, N.J: Humana Press; 2000. pp. 365–86. [DOI] [PubMed] [Google Scholar]
- 18.Parsons DW, Jones S, Zhang X, Lin JC, Leary RJ, Angenendt P, et al. An integrated genomic analysis of human glioblastoma multiforme. Science. 2008 Sep 26;321(5897):1807–12. doi: 10.1126/science.1164382. [DOI] [PMC free article] [PubMed] [Google Scholar]
- 19.Scott DA, Klaassens M, Holder AM, Lally KP, Fernandes CJ, Galjaard RJ, et al. Genome-wide oligonucleotide-based array comparative genome hybridization analysis of non-isolated congenital diaphragmatic hernia. Hum Mol Genet. 2007 Feb 15;16(4):424–30. doi: 10.1093/hmg/ddl475. [DOI] [PubMed] [Google Scholar]
- 20.Mullighan CG, Goorha S, Radtke I, Miller CB, Coustan-Smith E, Dalton JD, et al. Genome-wide analysis of genetic alterations in acute lymphoblastic leukaemia. Nature. 2007 Apr 12;446(7137):758–64. doi: 10.1038/nature05690. [DOI] [PubMed] [Google Scholar]
- 21.Subramanian A, Tamayo P, Mootha VK, Mukherjee S, Ebert BL, Gillette MA, et al. Gene set enrichment analysis: a knowledge-based approach for interpreting genome-wide expression profiles. Proc Natl Acad Sci U S A. 2005 Oct 25;102(43):15545–50. doi: 10.1073/pnas.0506580102. [DOI] [PMC free article] [PubMed] [Google Scholar]
- 22.Kanehisa M, Araki M, Goto S, Hattori M, Hirakawa M, Itoh M, et al. KEGG for linking genomes to life and the environment. Nucleic Acids Res. 2008 Jan;36(Database issue):D480–D484. doi: 10.1093/nar/gkm882. [DOI] [PMC free article] [PubMed] [Google Scholar]
- 23.Xie X, Lu J, Kulbokas EJ, Golub TR, Mootha V, Lindblad-Toh K, et al. Systematic discovery of regulatory motifs in human promoters and 3′ UTRs by comparison of several mammals. Nature. 2005 Mar 17;434(7031):338–45. doi: 10.1038/nature03441. [DOI] [PMC free article] [PubMed] [Google Scholar]
- 24.Li C, Wong W. Model-based analysis of oligonucleotide arrays: model validation, design issues and standard error application. Genome Biology. 2001;2(8):0032.1–0032.11. doi: 10.1186/gb-2001-2-8-research0032. [DOI] [PMC free article] [PubMed] [Google Scholar]
- 25.Mootha VK, Lindgren CM, Eriksson KF, Subramanian A, Sihag S, Lehar J, et al. PGC-1alpha-responsive genes involved in oxidative phosphorylation are coordinately downregulated in human diabetes. Nat Genet. 2003 Jul;34(3):267–73. doi: 10.1038/ng1180. [DOI] [PubMed] [Google Scholar]
- 26.Peto R, Pike MC, Armitage P, Breslow NE, Cox DR, Howard SV, et al. Design and analysis of randomized clinical trials requiring prolonged observation of each patient. II. analysis and examples. Br J Cancer. 1977 Jan;35(1):1–39. doi: 10.1038/bjc.1977.1. [DOI] [PMC free article] [PubMed] [Google Scholar]
- 27.Feuk L, Carson AR, Scherer SW. Structural variation in the human genome. Nat Rev Genet. 2006 Feb;7(2):85–97. doi: 10.1038/nrg1767. [DOI] [PubMed] [Google Scholar]
- 28.Zhang F, Carvalho CM, Lupski JR. Complex human chromosomal and genomic rearrangements. Trends Genet. 2009 Jul;25(7):298–307. doi: 10.1016/j.tig.2009.05.005. [DOI] [PMC free article] [PubMed] [Google Scholar]
- 29.Marzluff WF, Wagner EJ, Duronio RJ. Metabolism and regulation of canonical histone mRNAs: life without a poly(A) tail. Nat Rev Genet. 2008 Nov;9(11):843–54. doi: 10.1038/nrg2438. [DOI] [PMC free article] [PubMed] [Google Scholar]
- 30.Ramensky V, Bork P, Sunyaev S. Human non-synonymous SNPs: server and survey. Nucleic Acids Res. 2002 Sep 1;30(17):3894–900. doi: 10.1093/nar/gkf493. [DOI] [PMC free article] [PubMed] [Google Scholar]
- 31.Tavtigian SV, Deffenbaugh AM, Yin L, Judkins T, Scholl T, Samollow PB, et al. Comprehensive statistical study of 452 BRCA1 missense substitutions with classification of eight recurrent substitutions as neutral. J Med Genet. 2006 Apr;43(4):295–305. doi: 10.1136/jmg.2005.033878. [DOI] [PMC free article] [PubMed] [Google Scholar]
- 32.Mathe E, Olivier M, Kato S, Ishioka C, Hainaut P, Tavtigian SV. Computational approaches for predicting the biological effect of p53 missense mutations: a comparison of three sequence analysis based methods. Nucleic Acids Res. 2006;34(5):1317–25. doi: 10.1093/nar/gkj518. [DOI] [PMC free article] [PubMed] [Google Scholar]
- 33.Chen J, Odenike O, Rowley JD. Leukaemogenesis: more than mutant genes. Nat Rev Cancer. 2010 Jan;10(1):23–36. doi: 10.1038/nrc2765. [DOI] [PMC free article] [PubMed] [Google Scholar]
- 34.Ellis L, Atadja PW, Johnstone RW. Epigenetics in cancer: targeting chromatin modifications. Mol Cancer Ther. 2009 Jun;8(6):1409–20. doi: 10.1158/1535-7163.MCT-08-0860. [DOI] [PubMed] [Google Scholar]
- 35.Marzluff WF, Gongidi P, Woods KR, Jin J, Maltais LJ. The human and mouse replication-dependent histone genes. Genomics. 2002 Nov;80(5):487–98. [PubMed] [Google Scholar]
- 36.Berger SL. The complex language of chromatin regulation during transcription. Nature. 2007 May 24;447(7143):407–12. doi: 10.1038/nature05915. [DOI] [PubMed] [Google Scholar]
- 37.Greaves MF, Wiemels J. Origins of chromosome translocations in childhood leukaemia. Nat Rev Cancer. 2003 Sep;3(9):639–49. doi: 10.1038/nrc1164. [DOI] [PubMed] [Google Scholar]
Associated Data
This section collects any data citations, data availability statements, or supplementary materials included in this article.