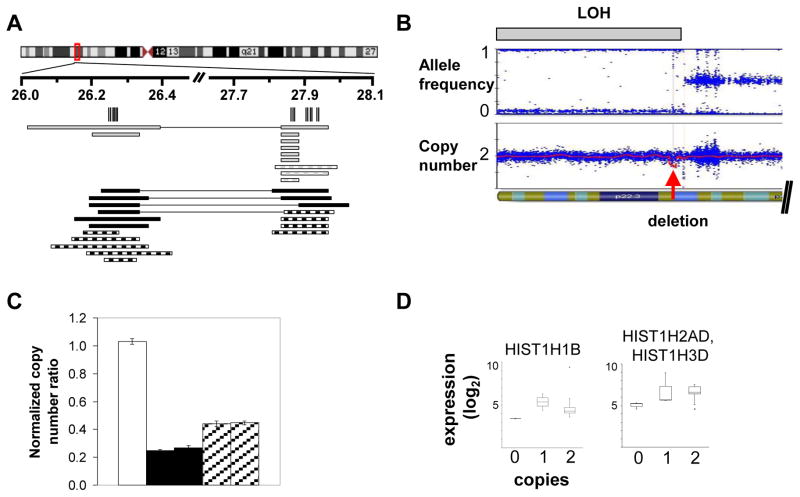
Figure 1. Histone locus gene deletions, LOH, and gene expression.
A. Deletions in 6p22 region. Vertical lines indicate the histone genes falling within the deletion critical regions. Black solid rectangles indicate DS-ALL homozygous deletions, black hatched rectangles DS-ALL heterozygous, gray solid rectangles indicate NDS-ALL homozygous deletions, gray hatched rectangles NDS-ALL heterozygous deletions. Rectangles connected by a horizontal line indicate that the two deletions occur jointly within the same sample. B. Representative case with region of LOH containing a focal homozygous deletion. The upper plot shows allele frequency, with gray bar indicating region of LOH; the lower plot shows copy number, with red arrow indicating focal homozygous deletion. C. Real-time quantitative PCR (qPCR) validation of SNP array copy number abnormalities. White bar indicates a normal bone marrow control; black bars indicate two DS-ALL cases with homozygous deletions by SNP array; hatched bars indicate two DS-ALL cases with heterozygous deletions by SNP array. Histogram heights indicate copy number for the HIST1H4D gene as determined by qPCR. In tumor samples, ratio values less than 0.3 are considered consistent with homozygous deletion and ratio values 0.3–0.7 consistent with heterozygous deletion.(20) D. Log2 normalized expression levels for representative histone genes in DS-ALL cases containing 0, 1, or 2 histone gene copies. Each box indicates interquartile range and central line indicates median.
DS indicates Down syndrome; ALL, acute lymphoblastic leukemia; NDS, non-Down syndrome; LOH, loss of heterozygosity.

