

Abstract
Mice deficient in monoamine oxidase A have previously been shown to demonstrate a chronic elevation of serotonin and norepinephrine in the brain. Using the autoradiographic [14C]iodo-antipyrine method, we examined cerebral cortical blood flow in conscious, restrained four- to five-month-old knock-out and wild-type animals following the intraperitoneal administration of either saline or D-fenfluramine. Knock-out animals administered saline, compared to their wild-type counterparts, demonstrated a significantly higher regional cortical blood flow in somatosensory and barrel field neocortex, an area which previous histological studies have shown to be characterized by abnormal serotonergic projection fibers and absent barrel formation. Regional cortical blood flow was significantly lower in knock-out than in wild-type mice in the entorhinal and midline motor cortex, with non-significant decreases noted in the olfactory, piriform and retrosplenial cortices and the amygdala. We compared the above findings to those obtained in response to D-fenfluramine which, in conjunction with its metabolite D-norfenfluramine, results in acute elevations of brain levels of serotonin and norepinephrine. Administration of D-fenfluramine (21.2 mg/kg) resulted in changes in regional cortical perfusion in most brain regions of both knock-out and wild-type mice that were opposite to the genotypic differences seen in perfusion in response to saline. Fenfluramine significantly increased regional cortical blood flow in the allocortex (olfactory, piriform, entorhinal) and the amygdala, and significantly decreased regional cortical blood flow in the somatosensory, barrel field, midline motor and retrosplenial cortices. Changes in regional perfusion in response to fenfluramine were topographically equivalent in knock-out and wild-type mice, although in knock-out mice such changes were of greater magnitude.
Our study suggests that the effects on regional cortical blood flow of a lifelong absence of monoamine oxidase A, and the consequent chronic increase in serotonin and norepinephrine, differ from those attributable to acute increases in these neurotransmitters following fenfluramine administration. Such a differential response may reflect neurodevelopmental abnormalities and/or effects of a chronic physiological adaptation on the regulation of cortical activation.
Keywords: cerebral blood flow, monoamine oxidase, serotonin, norepinephrine, fenfluramine, iodo-antipyrine
Serotonin (5-HT) and norepinephrine (NE) are key determinants of neural activity in the brain. Identification of the in vivo site of action of 5-HT and NE has been complicated by the existence of the blood–brain barrier, which excludes these neurotransmitters from the CNS following systemic administration.28 The basis of this exclusion is largely the result of enzymatic degradation by monoamine oxidase A (MAO-A), whose presence in the blood–brain barrier, as well as in the brain itself, plays a central role in regulating levels of these neurotransmitters. Pharmacological inhibition of enzymatic degradation by MAO inhibitors is of widespread clinical use, but possible non-specific effects3,20,29 complicate the interpretation of studies using these agents.
The availability of mice with a genetic deficit of MAO-A5 affords the opportunity to test the localization of action of an excess of 5-HT and NE within the CNS using functional imaging techniques. In these techniques, changes in regional cerebral blood flow or metabolism are used as surrogate measures of neuronal activity, to which they are tightly coupled. Cerebral blood flow has been used in the present experiments to image function because it has considerably better time resolution than 2-deoxyglucose uptake, and is the variable used in human cerebral functional imaging by H2 15O positron emission tomography and functional magnetic resonance imaging. We examined cortical blood flow (CBF) measured with the autoradiographic [14C]iodo-antipyrine method in MAO-A knock-out mice, which demonstrate an elevation of 5-HT and NE levels in brain.5 Comparison to wild-type controls allowed examination of genotypic differences in cerebral activation resulting from the chronic elevations of these neurotransmitters. We also analysed the acute effect of administration of D-fenfluramine on the cortical activation patterns of knock-out and wild-type mice. D-Fenflur-amine and its metabolite D-norfenfluramine cause an acute release in the brain of 5-HT and to a lesser extent NE,4,31,38 with potent effects on the firing of both serotonergic and noradrenergic fibers.35 Administration of D-fenfluramine allowed examination of the acute pharmacological effects of 5-HT and NE on cortical activity, and evaluation of the differential activity patterns in response to chronic versus acute elevations of 5-HT and NE.
EXPERIMENTAL PROCEDURES
Animals
Our experiment employed adult, male MAO-A-deficient mice (knock-out, KO) and wild-type animals (WILD) of C3H/HeJ genetic background.5 Animals represented offspring of heterozygous knockout females of C3H/HeJ background that were backcrossed over 12 generations with C3H wild-type males. All efforts were made to minimize the number of animals used and their suffering, and all procedures performed were reviewed and approved by the Animal Care and Use Committee at the Veterans Administration West Los Angeles Health Care Center. At the end of the experiment, the genotypes of the mice were re-confirmed using a polymerase chain reaction analysis of DNA prepared from tails.5
Fenfluramine dose
Administration of D-fenfluramine in mice results in rapid peak levels in the brain of the parent compound, as well as its D-norfenfluramine metabolite.4 The acute effect of these compounds is an immediate increase in brain levels of 5-HT and NE, which peaks at 30–90 min and is thought to result from mechanisms of presynaptic release and reuptake inhibition.21,36,38 D-Fenfluramine preferentially affects serotonergic transmission, whereas its metabolite preferentially affects noradrenergic transmission,35 although at high doses this specificity is likely to be lost.39
Fenfluramine is well known to elicit a behavioral syndrome in rats and mice, characterized by tremor, rigidity, Straub tail (tail held upwards and erect), hindlimb abduction, lateral head weaving and reciprocal forepaw treading.17,42,51 Dose-related induction of this syndrome with fenfluramine has been used as a measure of neuronal activation of the central serotonergic system. We reasoned that a dose of fenfluramine sufficient to elicit a behavioral change in mice would likely be associated with changes in cortical activity patterns. A dose (ED50) sufficient to elicit characteristic behavioral changes in 50% of wild-type and knock-out mice was estimated by administering a single intraperitoneal injection of D-fenfluramine (Research Biochemicals International, Natick, MA) in 0.9% aqueous saline (0.2 ml), with dosage increments between animals defined by the up-and-down method for small samples.9 Animals (KO: 5.00 ± 0.00 weeks old, 18.70 ± 1.16 g body mass, n = 6; WILD: 5.00 ± 0.00 weeks old, 20.02 ± 0.59 g body mass, n = 6; mean ± S.E.M.) were recorded on video over 30 min in a round Plexiglas™ arena (20 cm high × 35 cm diameter) under natural lighting. Using the method of scoring described by Trulson et al.,42 the syndrome was considered to be present if at least four of the above six signs of the 5-HT syndrome were displayed. Coding of the behaviors was performed using Observer, a software package for the analysis and management of observational data (Noldus Information Technology, Sterling, VA) by two independent observers blinded to the mouse genotype and fenfluramine dose (inter-rater correlation, r = 0.97, P <0.001).
Assessment of cortical blood flow
Mice used in the CBF experiment were divided into four groups by genotype (KO vs WILD) and type of infusion [fenfluramine (FEN) vs saline (SAL)]: (1) KO/SAL: 19.63 ± 0.61 weeks old, 27.06 ± 0.92 g body mass, n = 8; (2) KO/FEN: 18.25 ± 1.19 weeks old, 27.99 ± 0.90 g body mass, n = 8; (3) WILD/SAL: 20.63 ± 1.01 weeks old, 28.96 ± 1.56 g body mass, n = 8; (4) WILD/FEN: 19.46 ± 0.91 weeks old, 30.26 ± 0.98 g body mass, n = 8. Animals were anesthetized with 1% halothane in 30% oxygen and 70% nitrous oxide, and received cannulation of the left femoral artery and vein. A 1 h period was allowed for recovery from anesthesia, while the animal movements were limited by flexible paper restraints linking the limbs to a padded surface. Rectal temperature was recorded and maintained at 36.5°C with a BAT-12 thermocouple thermometer connected to a TCAT-1A temperature controller (Physitemp, Clifton, NJ) and a source of radiant heat. Following recovery from anesthesia, the source of radiant heat was removed and animals were allowed to self-regulate their core temperature at an ambient room temperature of 27.0°C. Mean arterial blood pressure (MABP) and heart rate (HR) were continuously assessed from the arterial catheter, which was connected to a Statham strain gauge pressure transducer and polygraph recorder (Model 7B, Grass Instruments, Warwick, RI). Animals of each genotype received a single intraperitoneal injection of either D-fenfluramine (WILD/FEN: n = 8; KO/FEN: n = 8) or saline (WILD/SAL: n = 8; KO/SAL: n = 8). A dosage of D-fenfluramine of 21.2 mg/kg (i.p.) was chosen, which corresponded to the estimated ED50 for eliciting the behavioral 5-HT syndrome in knock-out mice, and would be likely to result in a differential drug response between the genotypes. Assessment of CBF occurred 40 min thereafter.
Immediately prior to implementing the CBF technique, arterial blood gases and pH were assessed from an arterial blood sample (70 μl) in an ABL-70 blood acid–base system (Radiometer America Inc., West Lake, OH). Assessment of CBF was made as described previously15,33 with a modification of the indicator fractionation method using [14C]iodo-antipyrine.12 Animals received a continuous intravenous infusion over 10 s of 180 μl saline containing 270 μCi/kg body weight of [14C]iodo-antipyrine (American Radiolabeled Chemicals, St. Louis, MO) administered by a motor-driven syringe pump, at the end of which the animal was immediately decapitated. Simultaneously with infusion, arterial blood was continuously withdrawn from a femoral catheter at a rate of 15 μl/s until decapitation. This procedure was adopted to balance the infusion and withdrawal of fluids, and avoid sudden changes in arterial volume and pressure given the small blood volume of the mouse. The arterial blood sample was processed for liquid scintillation counting of radioactivity in a Beckman LS8100 liquid scintillation spectrophotometer. Counting efficiency was verified by internal standardization with [14C]hexadecane.
Autoradiography
The brains were rapidly removed, flash frozen in methylbutane at −70°C, embedded in OCT™ compound (Miles) and subsequently cut in a cryostat at −16°C in 20-μm-thick coronal sections. Thirteen coronal sections were selected for each animal at the following anterior–posterior coordinates (mm) relative to bregma: 1.94, 1.54, 1.18, 0.74, 0.26, −0.34, −0.82, −1.34, −1.82, −2.46, −2.92, −3.64, −4.24 (positive if rostral to bregma). Sections were heat-dried on glass slides and exposed for two weeks to Kodak Ektascan films in spring-loaded X-ray cassettes along with eight radioactive 14C standards (Amersham, NY). Images (autoradiographs) of brain sections were digitized with a ChromaPro 45 IAIS “Dumas” film illumination system and a Phillips charge-coupled device monochrome imaging module coupled to a Flashpoint 128 digitizing board on a Dell Dimensions XPS R400 microcomputer. Brain regions of interest were identified using an anatomical atlas of the mouse brain10 and transcribed to a visual template. Overlay of this template on to the digitized images allowed measurement of the optical density of locations in the cortical mantle in a manner invariant between animals. Optical density was measured with Image Pro-Plus software (Media Cybernetics, Silver Springs, MD).
Data analysis
Quantification of optical density of the autoradiograms and comparison with that induced by standards of known radioactivity allowed determination of brain tissue 14C activity and CBF. CBF was calculated from the following equation:12
where Cb = brain tissue 14C activity at time T (decapitation) and Ca = arterial 14C activity. Integration of the arterial concentration time curve was performed mechanically by continuous withdrawal of blood from the femoral artery at a constant rate. Measurements of regional CBF (rCBF) were performed for each animal in 130 cortical regions, distributed in 13 coronal planes. These regions were sampled in both hemispheres and, for the statistical analysis, the values were averaged for each one.
For every experimental group, means and standard errors of the means (S.E.M.) were calculated for each region, each slice (all regions in a given slice) and globally (all regions in all slices). CBF group differences in global averages (average CBF of all regions in each animal) of WILD/FEN, KO/FEN and KO/SAL versus the control (WILD/SAL) were assessed by ANOVA and t-tests (unpaired, two-tailed, P <0.05) using the Bonferroni correction for three contrasts.
Patterns of rCBF distribution were subjected to multivariate analysis. A Z-transformation was first performed on the CBF data to produce patterns of rCBF. These patterns (Z-maps) were defined by calculation of the standard normal deviates (Z-scores) defined as:
where Z-Scorei is the standard normal deviate of blood flow at location “i”, CBFi is the blood flow of location i, and Mean and S.D. are the average and standard deviation of blood flow at all locations in a given animal. This transformation has been routinely employed in the analysis of positron emission tomography maps because it introduces minimal dependence on absolute CBF when the number of locations studied is large, as in the present case, and it does not propagate further error.8 Abstraction of the CBF pattern by this procedure eliminates variations in mean CBF between subjects and experimental groups created by global effects on vascular smooth muscle and systematic experimental error. This is an advantage when studying patterns, but it precludes discovery of potential differences in mean rates. We have consequently performed a univariate analysis of global CBF in addition to the multivariate analysis of rCBF.
To reduce the blood flow variables (130 cortical locations averaged across hemispheres) to a smaller set that optimally discriminated among all the experimental groups, Z-scores were then analysed by stepwise discriminant analysis using the “jacknife” procedure.18 The discrimination obtained with this analysis is represented in a scatter plot (canonical plot, Fig. 3), with the first canonical variable (the linear combination of variables that best discriminates among the groups) on the abscissa, and the second canonical variable (the next best linear combination orthogonal to the first one) on the ordinate. Characteristic profiles, representing patterns of blood flow that uniquely correspond to each of the canonical variables, were computed using an approach described in detail elsewhere.34
Fig. 3.
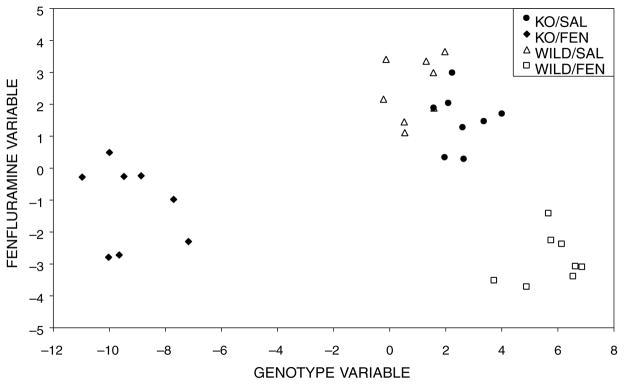
Canonical plots. Depicted are the two first canonical variables providing discrimination between the relative CBF (Z-scores) of knock-out (KO) and wild-type (WILD) mice (genotype variable), as well as by infusion type [fenfluramine (FEN) or saline (SAL)] for both knock-out and wild-type mice (fenfluramine variable).
Z-Score differences were used to reveal the effects of genotype (KO/SAL – WILD/SAL), as well as the effects of the fenfluramine challenge (KO/FEN – KO/SAL, WILD/FEN – WILD/SAL). Z-Score differences on the dorsal, lateral and basal cortical surfaces were displayed as topographical maps. In these two-dimensional maps (Fig. 2), the x- and y-coordinates are obtained from measures of the anatomical distances within the autoradiographs. The x-axis represents the distance from the midline (mm) along the cortical rim, and the y-axis represents distance from bregma (positive if rostral and negative if caudal to this landmark). To permit easier visual correlation, we superimposed on the topographic maps the borders among the main cerebral cortical areas as defined in the anatomical atlas of Franklin and Paxinos.10 The magnitude of the mean rCBF Z-score difference at each coordinate is coded on a color scale, with positive differences depicted separately from negative differences for easier visualization. To avoid discontinuities in the graphic representation, the space between our 13 coronal brain slices and 20 locations within each slice, where there were no measurements, was filled with values calculated by a standard linear interpolation.
Fig. 2.

Maps of the color-coded Z-score differences on the two-dimensional topographic surface of the flattened cortex. The x-axis (Locations) represents lateral distance from the midline (in mm). The y-axis (Slices) represents coronal slices, numbered from rostral to caudal, with distance to bregma as labeled above (positive values being rostral to this landmark). A, amygdaloid; AU, auditory; BF, barrel field; EC, ectorhinal; ENT, entorhinal; I, insular; M1, primary motor; M2/C, secondary motor and cingulate; O, olfactory; PI, piriform; PR, perirhinal; RSA, retrosplenial; S1, primary somatosensory; S2, secondary somatosensory; V2, secondary visual; WILD/SAL, wild-type mice receiving saline; WILD/FEN, wild-type mice receiving D-fenfluramine; KOA/SAL, knock-out mice receiving saline; KOA/FEN, knock-out mice receiving D-fenfluramine.
RESULTS
Serotonin syndrome
Fenfluramine elicited a behavioral syndrome characterized by tremor, rigidity, Straub tail, hindlimb abduction, lateral head weaving and reciprocal forepaw treading. Knock-out mice compared to wild-type mice demonstrated a clear increased sensitivity to behavioral elicitation of the 5-HT syndrome. Estimations of the ED50 for the 5-HT behavioral syndrome were 21.2 and 44.4 mg/kg in knock-out and wild-type mice, respectively. These results are consistent with previous reports showing that pretreatment with the MAO inhibitors pargyline or nialamide decreases the dose of fenfluramine needed to elicit this syndrome.27,42 To allow for a differential drug response, a dose of 21.2 mg/ml of fenfluramine was chosen for administration in the CBF experiments.
Cortical blood flow
Both wild-type and knock-out mice administered saline revealed their highest rCBF Z-scores in a band of cortex extending from the border of the motor area anteriorly, to the auditory and secondary visual areas posteriorly, including the somatosensory and barrel field regions (data not shown). An additional cluster of locations with high rCBF Z-scores was also found in the olfactory cortex. This topographical pattern is similar to that described previously in the unanesthetized, restrained mouse.33 A representative autoradiograph depicting rCBF in two coronal sections is presented in Fig. 1.
Fig. 1.
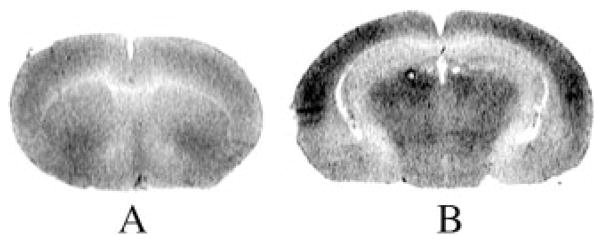
Representative [14C]iodo-antipyrine autoradiographs of a wild-type mouse at the level of the caudate–putamen (left) and hippocampus (right). Optical densities reflect variations in rCBF.
Genotypic differences in Z-score maps for animals administered saline (KO/SAL minus WILD/SAL) are shown in Fig. 2. Knock-out mice, compared to wild-type mice, demonstrated significantly higher rCBF Z-scores in the barrel field and primary somatosensory cortex (P <0.05); significantly lower rCBF Z-scores were seen in the midline anterior secondary motor cortex and entorhinal cortex (P <0.05). Lower rCBF Z-scores were also seen in the primary motor cortex, visual cortex, olfactory, piriform cortex and the amygdala, although these did not reach statistical significance.
Pharmacological differences in Z-score maps attributable to fenfluramine are also shown in Fig. 2. Knock-out mice administered fenfluramine compared to those administered saline (KO/FEN minus KO/SAL) demonstrated significantly lower rCBF Z-scores in the barrel field cortex, primary somatosensory cortex (P <0.05), midline primary and secondary motor cortices (P <0.0001), secondary visual cortex, as well as the auditory and perirhinal cortices (P <0.05). Lower rCBF was also seen in the secondary somatosensory cortex and primary visual cortex, and posterior portions of the insular cortex, although these did not reach statistical significance. CBF Z-scores were significantly higher across the amygdala, olfactory, piriform and anterior insular cortices (P <0.005). In wild-type mice, the response to fenfluramine was topographically similar to that seen in knock-out mice, but of lesser magnitude. Wild-type mice administered fenflur-amine compared to those administered saline (WILD/FEN minus WILD/SAL) demonstrated significantly lower rCBF Z-scores in the midline secondary motor cortex (P <0.01), as well as in medial portions of the primary motor cortex (P <0.05). Non-significant decreases were noted in the barrel field, somatosensory, entorhinal and primary and secondary visual cortices; non-significant increases in rCBF Z-scores were seen in the olfactory, piriform, anterior insular and perirhinal cortices, and the amygdala. Maps of the Z-score differences of KO/FEN minus WILD/FEN (data not shown) showed positive differences in the allocortex (olfactory, piriform, entorhinal) and the amygdala, and negative differences in the neocortex, a topography similar to that seen for the KO/FEN minus KO/SAL comparison.
Z-Maps were studied by stepwise discriminant analysis. This procedure achieved 97% success in classifying all cases into their respective groups, with data from 10 cortical locations selected by the discriminant procedure from the original 130 locations (Table 1). After “jack-knifing”, a procedure that removes from the discriminant function the contribution of the case being classified, the effectiveness of classification remained at 100% for all animals receiving fenfluramine infusions. Correct classification dropped to 88% and 75% for KO/SAL and WILD/SAL animals due to overlap among these groups in three of 16 cases.
Table 1.
Characteristic profiles for the first two canonical variables
| Region | Genotype variable | Fenfluramine variable |
|---|---|---|
| A | −0.03 | −0.12 |
| AU | 0.05 | 0.08 |
| BF | −0.01 | 0.05 |
| M1 | 0.07 | 0.20 |
| M2 | 0.02 | 0.19 |
| M2/C | −0.06 | −0.18 |
| PI | −0.05 | −0.07 |
| S1 | 0.07 | 0.09 |
| S2 | −0.01 | −0.02 |
| V2 | 0.04 | 0.03 |
A, amygdaloid; AU, auditory; BF, barrel field; M1, primary motor; M2, secondary motor; M2/C, transitional cortex M2 and cingulate; PI, piriform; S1, primary somatosensory; S2, secondary somatosensory; V2, secondary visual.
The first two canonical variables explained 98% and 91% of the total variation, and they allowed representation of canonical scores for each case in a single plane (canonical plot, Fig. 3). Examination of this plot indicates a tight clustering of cases within each group. Experimental groups receiving fenfluramine were distinct, whereas experimental groups receiving saline demonstrated a small overlap. The first canonical variable separated mice of different genotypes (genotype variable), and the second one separated the FEN from the SAL treatment groups (fenfluramine variable). The separation between genotypes was reversed after fenfluramine because the acute serotonergic/noradrenergic challenge differentially affected rCBF in cortical areas in an opposite fashion to that observed following saline administration.
The displacement of cases along the axes of the canonical plots (Fig. 3) depends on the values of both the characteristic profiles (Table 1) and the rCBF Z-scores. The right shift of the KO/SAL animals with respect to the WILD/SAL animals along the axis of the genotype variable was due to the larger Z-scores in the primary somatosensory cortex, primary and secondary motor cortices, secondary visual cortex, and auditory cortex (Fig. 2). Smaller Z-scores in KO/SAL animals with respect to the WILD/SAL animals in the barrel field cortex, piriform cortex, secondary somatosensory cortex, amygdala and the midline cingulate and motor cortices reinforced this trend, since characteristic profiles of these regions had a sign opposite to those of the group mentioned above. The separation of cases along the genotype variable was reversed and more pronounced after fenfluramine administration (Fig. 3).
The displacement of cases down the fenfluramine variable axis in animals that received this drug (Fig. 3) was due to their larger CBF Z-scores for the piriform cortex, amygdala and the transitional area between the cingulate and motor cortices, and their smaller CBF Z-scores for the barrel field cortex, primary somatosensory cortex, primary and secondary motor cortices, secondary visual cortex and auditory cortex.
Calculation of the global CBF (ml/g per min) did not reveal any significant genotypic differences between animals administered saline; there were no significant differences in global CBF in response to fenfluramine (ml/g per min: WILD/SAL 1.93 ± 0.20, KO/SAL 1.59 ± 0.17, WILD/FEN 1.73 ± 0.25, KO/FEN 1.82 ± 0.12). Likewise, there were no significant group difference in non-transformed CBF values averaged across each coronal cortical slice.
Effects on physiological variables
Physiological variables are displayed in Table 2. Prior to infusion of fenfluramine or saline, knock-out mice demonstrated a significantly lower HR than wild-type mice (b.p.m., mean ± S.E.M.: KO 405 ± 15, WILD 453 ± 15, P <0.05). Baseline MABP was lower in knock-out mice than wild-type mice, although differences did not reach statistical significance (mmHg: KO 68.1 ± 3.7, WILD 75.6 ± 3.2). There were no differences in core temperature during the baseline temperature-controlled condition (mean: KO 36.5 ± 0.1°C, WILD 36.5 ± 0.2°C).
Table 2.
Physiological variables (mean ± S.E.M.) in wild-type and knock-out mice at baseline (pre-infusion) and in response to D-fenfluramine (21 mg/kg, i.p.) or saline
| Units | Pre-infusion
|
Post-infusion
|
|||||
|---|---|---|---|---|---|---|---|
| All WILD (n = 16) | All KO (n = 16) | WILD/SAL (n = 8) | WILD/FEN (n = 8) | KO/SAL (n = 8) | KO/FEN (n = 8) | ||
| MABP | mmHg | 75.6 ± 3.2 | 68.1 ± 3.7 | 68.5 ± 5.2 | 92.4 ± 4.8* | 66.1 ± 6.7 | 86.8 ± 6.8† |
| HR | b.p.m. | 453 ± 15 | 405 ± 15|| | 455 ± 20 | 607 ± 38† | 420 ± 27 | 717 ± 36§‡ |
| Core temp. | °C | 36.5 ± 0.2 | 36.5 ± 0.1 | 36.9 ± 0.1 | 37.9 ± 0.5 | 36.8 ± 0.1 | 39.9 ± 0.2§‡ |
| pH | −log10(H+) | — | — | 7.32 ± 0.01 | 7.31 ± 0.03 | 7.30 ± 0.01 | 7.29 ± 0.02 |
| pCO2 | mmHg | — | — | 42.9 ± 1.4 | 40.0 ± 3.4 | 44.2 ± 2.1 | 36.9 ± 2.4* |
| pO2 | mmHg | — | — | 89.5 ± 2.9 | 81.4 ± 2.5 | 81.8 ± 4.7 | 77.3 ± 3.9 |
FEN, D-fenfluramine; KO, knock-out mice; SAL, saline; WILD, wild-type mice.
Pre-infusion:
P <0.05 KO vs WILD. Post-infusion:
P <0.05,
P <0.005 or
P <0.0001 FEN vs SAL in animals of the same genotype,
P <0.05 WILD/FEN vs KO/FEN.
Both knock-out and wild-type mice demonstrated a significantly higher HR in response to fenfluramine than to saline (b.p.m.: KO/FEN 717 ± 36, KO/SAL 420 ± 27, P <0.0001; WILD/FEN 607 ± 38, WILD/SAL 455 ± 20, P <0.005). The increase in HR in response to fenfluramine was significantly greater in knock-out animals than in wild-type animals (P <0.05).
Both knock-out and wild-type mice demonstrated a higher core temperature in response to fenfluramine than to saline. Differences were significant in knock-out mice but not in wild-type mice (°C: KO/FEN 39.9 ± 0.2, KO/SAL 36.8 ± 0.1, P <0.0001; WILD/FEN 37.9 ± 0.5, WILD/SAL 36.9 ± 0.1). The increase in core temperature in response to fenfluramine was significantly greater in knock-out animals than in wild-type animals (P <0.01).
Administration of fenfluramine resulted in MABP increases. These were apparent at 5 min and reached plateau levels at 10–15 min following i.p. injection. Fenfluramine compared to saline administration resulted in significantly greater MABP in knock-out mice (mmHg: KO/FEN 86.8 ± 6.8, KO/SAL 66.1 ± 6.7, P <0.005), as well as in wild-type mice (mmHg: WILD/FEN 92.4 ± 4.8, WILD/SAL 68.5 ± 5.2, P <0.05). Increases were equivalent, with no significant genotypic differences. In response to saline infusion, knock-out and wild-type mice showed no significant change in core temperature, HR or MABP. A significant correlation was noted between HR and core temperature (KO: r = 0.91; WILD: r = 0.63; P <0.001), as well as between HR and MABP (KO: r = 0.64; WILD: r = 0.56; P <0.005).
Although blood p CO2 was lower in knock-out mice receiving fenfluramine compared to knock-out mice receiving saline (mmHg: KO/FEN 36.9 ± 2.4, KO/SAL 44.25 ± 2.1, P <0.05), no significant change in blood pH was found. The same trend was observed in wild-type mice, although with no statistical significance (mmHg: WILD/FEN 40.0 ± 3.5, WILD/SAL 42.9 ± 1.4). No trends were observed when CBF was plotted as a function of blood p CO2.
DISCUSSION
Our study suggests that the effects on regional cortical blood flow of a lifelong absence of MAO-A, and the consequent chronic increases in 5-HT and NE, differ from those attributable to acute increases in these neurotransmitters following fenfluramine administration. Knock-out mice administered saline compared to their wild-type counterparts demonstrated a decreased rCBF in the allocortex (piriform, olfactory, entorhinal), visual, midline motor and retrosplenial cortices, and the amygdala; rCBF was higher in the barrel field and in primary and secondary somatosensory cortices. Several possible explanations present themselves to account for such genotypic differences. Differences in regional cortical perfusion between wild-type and knock-out mice may reflect underlying differences in the regional concentrations of 5-HT and/or NE, which are chronically elevated in the brains of adult knock-out mice.5 Interestingly, the topography of serotonergic, cortical projection fibers from the dorsal raphe nucleus parallels some of the genotypic differences in regional cortical perfusion of animals administered saline. Dorsal raphe neurons project densely to lateral cortical structures (piriform/entorhinal cortex), the amygdala and regions in the medial frontal cortex, with more sparing innervation of sensorimotor areas.44 In contrast, locus coeruleus neurons, the primary source of cortically projecting noradrenergic fibers, project broadly across the cortex, including the sensorimotor area.47,48 Differences in perfusion patterns may also reflect neurodevelopmental abnormalities in the knockout animals in whom excess 5-HT disrupts the segregation of somatosensory thalamocortical afferents.6 In the cortex, knock-out mice demonstrate a complete absence of the barrel field formation, and similar alterations are caused by pharmacological inhibition of MAO-A in developing wild-type animals.45 Genotypic differences in basal rCBF may also reflect a physiological adaptive response in the knockout animals. Such responses have been increasingly described in a number of genetic mutant mice.7,16,30,43 One may speculate that, in our study, knock-out animals vulnerable to excessive synaptic concentrations of 5-HT may chronically down-regulate the responsivity of serotonergic circuits in order to maintain physiological homeostasis. This is consistent with the observation that knock-out mice, compared to wild-type mice, show decreases in the brain of the 5-HT1A, 5-HT2A and 5-HT2C receptors, as well as the vesicular mono-amine transporter.37
Acute increases in 5-HT and NE in response to fenflur-amine were associated with a distinct pattern of rCBF in both wild-type and knock-out mice, whose topography was largely the opposite of that associated with the chronic increase in these neurotransmitters seen characteristically in knock-out mice at baseline. Animals administered fenfluramine compared to those administered saline demonstrated lower rCBF in the barrel field and somatosensory cortices, whereas higher rCBF was noted in the piriform, olfactory and entorhinal cortices and the amygdala. Changes in rCBF to fenfluramine were topographically identical across genotypes. As expected, the response in wild-type mice was of a lesser magnitude than that seen in knock-out mice, presumably because wild-type mice, owing to the presence of MAO-A, respond to fenfluramine with smaller increases of 5-HT and NE.
Previous work in rats and humans has demonstrated changes in cerebral metabolism following acute administration of fenfluramine19,24 or serotonergic agents such as citalopram.26 In these studies, cerebral metabolism and rCBF were closely correlated, and the authors concluded that their results did not support the notion of a direct serotonergic effect on the vascular supply. Although our study did not examine cerebral metabolism, the above suggests that any putative changes in the underlying cerebral metabolism of wild-type and knock-out mice in response to fenfluramine are likely to follow a topography similar to that observed for rCBF, although genotypic differences in the magnitude of this response may remain.
Brain noradrenergic and serotonergic neurotransmission is characterized by subsystem heterogeneity, multiple receptors and interactions with other neurotransmitter systems. Such factors have contributed to substantial gaps remaining regarding aspects of the anatomy and physiology of these neurotransmitters. It has been suggested that, in the somatosensory cortex, endogenously released 5-HT and NE may exert complementary modulatory-type actions on neuronal responsiveness,49 as well as differential effects on excitatory post-synaptic current frequency in the motor cortex.25 The design of our study does not allow discrimination of whether our observed changes are the result of elevations of 5-HT and/or NE, or whether changes in rCBF may be linked to a secondary effect, for instance, an indirect 5-HT/dopamine interaction.14,32,40,46
MAO-A-deficient mice demonstrated an rCBF topography different to that reported previously in mice deficient in MAO-B.33 MAO-B-deficient mice (C57Bl-6/129-Sv genetic background), compared to their wild-type counterparts, show characteristic increases in brain levels of phenylethylamine with normal levels of 5-HT and NE. MAO-B-deficient mice compared to wild-type mice demonstrate greater rCBF in the midline motor cortex and medial portions of the somatosensory and visual cortices. Lower rCBF is seen in the piriform cortex and anterolateral frontal cortex (including primary motor, primary somatosensory and anterior portions of the insular cortex). Interestingly, acute administration of phenylethylamine, the specific substrate of MAO-B, also results in a reversal of the baseline rCBF topography. Here again, an acute infusion of the enzyme substrate results in a cerebrovascular perfusion pattern opposite to that seen in animals with a lifelong absence of the enzyme and chronic elevations of the substrate.13
Fenfluramine administration resulted in a modest elevation of MABP in both knock-out mice and wild-type mice. The pressor response to fenfluramine was within the autoregulation limits of CBF, and thus was not expected to induce changes in this variable. This was confirmed by observation of a plot of CBF as a function of blood pressure (not shown), which revealed no trends on CBF within the observed range of pressures. Correlation of the pressure measure with that of HR suggests that the rise in MABP in response to fenfluramine may, at least in part, have been attributable to increases in HR.
At baseline prior to infusion, knock-out mice demonstrated a lower HR than wild-type mice, suggesting a change in sympathetic/parasympathetic tone in the animals deficient in MAO-A. Fenfluramine administration resulted in an increase in HR in both groups, although this effect was magnified significantly in knock-out animals. Our results are consistent with previous observations documenting a dose-related increase in HR in response to acute administration of fenfluramine,1,2,11 an effect which is exaggerated in animals pretreated with the MAO inhibitor pargyline.41 Fenfluramine administration resulted in an increase in core temperature in both knock-out and wild-type mice, an effect which was significantly more prominent in knock-out animals. The hyperthermic effects in response to fenfluramine observed in the present experiments have been reported previously in mice.22,23,50 The fact that tachycardia and hyperthermia were accentuated in knock-out compared to wild-type mice suggests the possibility of MAO-A as a limiting factor for the expression of these phenomena. The enhancement of HR observed in both experimental groups in response to fenfluramine may have been due, at least in part, to hyperthermia, as these two variables were significantly correlated.
CONCLUSIONS
Our work suggests a reorganization of rCBF maps in mice lacking the MAO-A gene. In these animals, rCBF at baseline appears to follow a pattern largely opposite to that observed in response to acute fenfluramine administration. Further work is needed to clarify whether such a differential blood flow response associated with chronic versus acute elevations of 5-HT and NE is the result of an adaptational physiological/metabolic response to a lifelong absence of MAO-A.
Acknowledgments
This work was supported by Mentored Clinical Science Development Program Award K12-AG-00521 (Dr Holschneider), the US Department of Veterans Affairs (Dr Scremin), NIMH grants R01 MH 37020 and R37 MH39085 (MERIT Award), the Research Scientist Award K05 MH 00796, and the Boyd and Elsie Welin Professorship (Dr Shih).
Abbreviations
- CBF
cortical blood flow
- FEN
fenfluramine-treated group of mice
- HR
heart rate
- 5-HT
serotonin
- KO
knock-out group of mice
- MABP
mean arterial blood pressure
- MAO
monoamine oxidase
- NE
norepinephrine
- rCBF
regional cortical blood flow
- SAL
saline-treated group of mice
- WILD
wild-type group of mice
References
- 1.Babulova A, Cotillo P, Bonaccorsi A, Podvalova I. Effects of fenfluramine on the adrenergic system. J Pharm Pharmac. 1972;24:886–893. doi: 10.1111/j.2042-7158.1972.tb08908.x. [DOI] [PubMed] [Google Scholar]
- 2.Bizzi A, Bonaccorsi A, Jespersen S, Jori A, Garattini S. Pharmacological studies on amphetamine and fenfluramine. In: Costa E, Garattini S, editors. Amphetamines and Related Compounds. Raven; New York: 1970. [Google Scholar]
- 3.Boudikova-Girard B, Scott MC, Weinshilboum R. Histamine N-methyltransferase: inhibition by monoamine oxidase inhibitors. Agents Actions. 1993;40:1–10. doi: 10.1007/BF01976745. [DOI] [PubMed] [Google Scholar]
- 4.Caccia S, Ballabio M, Guiso G, Rocchetti M, Garattini S. Species differences in the kinetics and metabolism of fenfluramine isomers. Archs int Pharmacodyn Thér. 1982;258:15–28. [PubMed] [Google Scholar]
- 5.Cases O, Seif I, Grimsby J, Gaspar P, Chen K, Pournin S, Muller U, Aguet M, Babinet C, Shih JC, De Maeyer E. Aggressive behavior and altered amounts of brain serotonin and norepinephrine in mice lacking MAOA. Science. 1995;268:1763–1766. doi: 10.1126/science.7792602. [DOI] [PMC free article] [PubMed] [Google Scholar]
- 6.Cases O, Vitalis T, Seif I, De Maeyer E, Sotelo C, Gaspar P. Lack of barrels in the somatosensory cortex of monoamine oxidase A-deficient mice: role of a serotonin excess during the critical period. Neuron. 1996;16:297–307. doi: 10.1016/s0896-6273(00)80048-3. [DOI] [PubMed] [Google Scholar]
- 7.Chen L, He M, Sibille E, Thompson A, Sarnyai Z, Baker H, Shippenberg T, Toth M. Adaptive changes in postsynaptic dopamine receptors despite unaltered dopamine dynamics in mice lacking monoamine oxidase B. J Neurochem. 1999;73:647–655. doi: 10.1046/j.1471-4159.1999.0730647.x. [DOI] [PubMed] [Google Scholar]
- 8.Clark C, Carson R, Kessler R, Margolin R, Buchsbaum M, DeLisi L, King C, Cohen R. Alternative statistical models for the examination of clinical positron emission tomography/fluorodeoxyglucose data. J cerebr Blood Flow Metab. 1985;5:142–150. doi: 10.1038/jcbfm.1985.18. [DOI] [PubMed] [Google Scholar]
- 9.Dixon WJ. The up-and-down method for small samples. Am statist Assoc J. 1965;60:967–978. [Google Scholar]
- 10.Franklin KBJ, Paxinos G. The Mouse Brain in Stereotaxic Coordinates. Academic; San Diego, CA: 1997. [Google Scholar]
- 11.Franko BV, Honkomp LJ, Ward JW. Cardiovascular and autonomic effects of fenfluramine HCl. J Pharm Pharmac. 1965;17:222–226. doi: 10.1111/j.2042-7158.1965.tb07648.x. [DOI] [PubMed] [Google Scholar]
- 12.Goldman H, Sapirstein LA. Brain blood flow in the conscious and anesthetized rat. Am J Physiol. 1973;224:122–126. doi: 10.1152/ajplegacy.1973.224.1.122. [DOI] [PubMed] [Google Scholar]
- 13.Grimsby J, Toth M, Karoum F, Klaidman L, Adams J, Chen K, Shih JC. Increased stress response and p-phenylethylamine in MAOB-deficient mice. Nature Genet. 1997;17:206–210. doi: 10.1038/ng1097-206. [DOI] [PubMed] [Google Scholar]
- 14.Herve D, Pickel VM, Joh TH, Beaudet A. Serotonin axon terminals in the ventral tegmental area of the rat: fine structure and synaptic input to dopaminergic neurons. Brain Res. 1987;435:71–83. doi: 10.1016/0006-8993(87)91588-5. [DOI] [PubMed] [Google Scholar]
- 15.Holschneider DP, Scremin OU. Effect of ovariectomy on cerebral blood flow in rats. Neuroendocrinology. 1998;67:260–268. doi: 10.1159/000054321. [DOI] [PubMed] [Google Scholar]
- 16.Holschneider DP, Shih JC. Genotype to phenotype: challenges and opportunities. Int J devl Neurosci. 2000;18:615–618. doi: 10.1016/s0736-5748(00)00026-5. [DOI] [PMC free article] [PubMed] [Google Scholar]
- 17.Jacobs BL, Klemfuss H. Brain stem and spinal cord mediation of a serotonergic behavioral syndrome. Brain Res. 1975;100:450–457. doi: 10.1016/0006-8993(75)90500-4. [DOI] [PubMed] [Google Scholar]
- 18.Jennrich R, Sampson P. Stepwise discriminant analysis. In: Dixon WJ, Brown MB, Engelman L, Jennrich RL, editors. BMDP Statistical Software Manual. University of California Press; Berkeley: 1990. [Google Scholar]
- 19.Kapur S, Meyer J, Wilson AA, Houle S, Brown GM. Modulation of cortical neuronal activity by a serotonergic agent: a PET study in humans. Brain Res. 1994;646:292–294. doi: 10.1016/0006-8993(94)90091-4. [DOI] [PubMed] [Google Scholar]
- 20.Kitani K, Kanai S, Carrillo MC, Ivy GO. Deprenyl increases the life span as well as activities of superoxide dismutase and catalase but not of glutathione peroxidase in selective brain regions in Fischer rats. Ann N Y Acad Sci. 1994;717:60–71. doi: 10.1111/j.1749-6632.1994.tb12073.x. [DOI] [PubMed] [Google Scholar]
- 21.Laferrere B, Wurtman RJ. Effect of D-fenfluramine on serotonin release in brains of anaesthetized rats. Brain Res. 1989;504:258–263. doi: 10.1016/0006-8993(89)91365-6. [DOI] [PubMed] [Google Scholar]
- 22.Le Douarec JC, Schmitt H, Laubie M. Pharmacologic study of fenfluramine and its optical isomers. Archs int Pharmacodyn Thér. 1966;161:206–232. [PubMed] [Google Scholar]
- 23.Maj J, Chojnacka-Wojcik E, Lewandowska A, Tatarczynska E. Central antiserotonin action of fluperlapine. Pol J Pharmac Pharm. 1985;37:517–524. [PubMed] [Google Scholar]
- 24.Mann JJ, Malone KM, Diehl DJ, Perel J, Nichols TE, Mintun MA. Positron emission tomographic imaging of serotonin activation effects on prefrontal cortex in healthy volunteers. J cerebr Blood Flow Metab. 1996;16:418–426. doi: 10.1097/00004647-199605000-00008. [DOI] [PubMed] [Google Scholar]
- 25.Marek GJ, Aghajanian GK. 5-HT2A receptor or alpha1-adrenoceptor activation induces excitatory postsynaptic currents in layer V pyramidal cells of the medial prefrontal cortex. Eur J Pharmac. 1999;367:197–206. doi: 10.1016/s0014-2999(98)00945-5. [DOI] [PubMed] [Google Scholar]
- 26.McBean DE, Ritchie IM, Olverman HJ, Kelly PA. Effects of the specific serotonin reuptake inhibitor, citalopram, upon local cerebral blood flow and glucose utilisation in the rat. Brain Res. 1999;847:80–84. doi: 10.1016/s0006-8993(99)02033-8. [DOI] [PubMed] [Google Scholar]
- 27.Modigh K, Svensson TH. On the role of central nervous system catecholamines and 5-hydroxytryptamine in the nialamide-induced behavioural syndrome. Br J Pharmac. 1972;46:32–45. doi: 10.1111/j.1476-5381.1972.tb06846.x. [DOI] [PMC free article] [PubMed] [Google Scholar]
- 28.Oldendorf WH. Brain uptake of radiolabeled amino acids, amines, and hexoses after arterial injection. Am J Physiol. 1971;221:1629–1639. doi: 10.1152/ajplegacy.1971.221.6.1629. [DOI] [PubMed] [Google Scholar]
- 29.Paslawski TM, Sloley BD, Baker GB. Effects of the MAO inhibitor phenelzine on glutamine and GABA concentrations in rat brain. Prog Brain Res. 1995;106:181–186. doi: 10.1016/s0079-6123(08)61214-5. [DOI] [PubMed] [Google Scholar]
- 30.Rioux A, Fabre V, Lesch KP, Moessner R, Murphy DL, Lanfumey L, Hamon M, Martres MP. Adaptive changes of serotonin 5-HT2A receptors in mice lacking the serotonin transporter. Neurosci Lett. 1999;262:113–116. doi: 10.1016/s0304-3940(99)00049-x. [DOI] [PubMed] [Google Scholar]
- 31.Rocher C, Bert L, Robert F, Trouvin JH, Renaud B, Jacquot C, Gardier AM. Microdialysis monitoring of variations in extracellular levels of serotonin, GABA and excitatory amino acids in the frontal cortex of awake rats in response to a single peripheral or central administration of dexfenfluramine. Brain Res. 1996;737:221–230. doi: 10.1016/0006-8993(96)00735-4. [DOI] [PubMed] [Google Scholar]
- 32.Schmidt CJ, Fadayel GM, Sullivan CK, Taylor VL. 5-HT2 receptors exert a state-dependent regulation of dopaminergic function: studies with MDL 100,907 and the amphetamine analogue, 3,4-methylenedioxymethamphetamine. Eur J Pharmac. 1992;223:65–74. doi: 10.1016/0014-2999(92)90819-p. [DOI] [PubMed] [Google Scholar]
- 33.Scremin OU, Holschneider DP, Chen K, Ming GL, Shih JC. Cerebral cortical blood flow maps are reorganized in MAOB-deficient mice. Brain Res. 1999;824:36–44. doi: 10.1016/s0006-8993(99)01167-1. [DOI] [PMC free article] [PubMed] [Google Scholar]
- 34.Scremin OU, Li MG, Scremin AM, Jenden DJ. Cholinesterase inhibition improves blood flow in the ischemic cerebral cortex. Brain Res Bull. 1997;42:59–70. doi: 10.1016/s0361-9230(96)00207-9. [DOI] [PubMed] [Google Scholar]
- 35.Scuvee-Moreau J, Dresse A. Influence of fenfluramine and norfenfluramine stereoisomers on the firing rate of central monoaminergic neurons in the rat. Eur J Pharmac. 1990;179:211–215. doi: 10.1016/0014-2999(90)90421-2. [DOI] [PubMed] [Google Scholar]
- 36.Series HG, Cowen PJ, Sharp T. p-Chloroamphetamine (PCA), 3,4-methylenedioxy-methamphetamine (MDMA) and D-fenfluramine pretreatment attenuates D-fenfluramine-evoked release of 5-HT in vivo. Psychopharmacology. 1994;116:508–514. doi: 10.1007/BF02247485. [DOI] [PubMed] [Google Scholar]
- 37.Shih JC, Ridd MJ, Chen K, Meehan WP, Kung MP, Seif I, De Maeyer E. Ketanserin and tetrabenazine abolish aggression in mice lacking monoamine oxidase A. Brain Res. 1999;835:104–112. doi: 10.1016/s0006-8993(99)01478-x. [DOI] [PubMed] [Google Scholar]
- 38.Shimizu H, Bray GA. Hypothalamic monoamines measured by microdialysis in rats treated with 2-deoxy-glucose or D-fenfluramine. Physiol Behav. 1989;46:799–807. doi: 10.1016/0031-9384(89)90040-1. [DOI] [PubMed] [Google Scholar]
- 39.Sipes IG, Ziance RJ, Buckley JP. Some cardiovascular and autonomic effects of fenfluramine hydrochloride. J Pharmac exp Ther. 1971;176:220–228. [PubMed] [Google Scholar]
- 40.Smith GS, Dewey SL, Brodie JD, Logan J, Vitkun SA, Simkowitz P, Schloesser R, Alexoff DA, Hurley A, Cooper T, Volkow ND. Serotonergic modulation of dopamine measured with [11C]raclopride and PET in normal human subjects. Am J Psychiat. 1997;154:490–496. doi: 10.1176/ajp.154.4.490. [DOI] [PubMed] [Google Scholar]
- 41.Tessel RE, Woods JH, Counsell RE, Basmadjian GP. Structure–activity relationships between meta-substituted N-ethylamphetamines and isolated guinea-pig atrial rate. J Pharmac exp Ther. 1975;192:319–326. [PubMed] [Google Scholar]
- 42.Trulson ME, Eubanks EE, Jacobs BL. Behavioral evidence for supersensitivity following destruction of central serotonergic nerve terminals by 5,7-dihydroxytryptamine. J Pharmac exp Ther. 1976;198:23–32. [PubMed] [Google Scholar]
- 43.Veksler VI, Kuznetsov AV, Anflous K, Mateo P, van Deursen J, Wieringa B, Ventura-Clapier R. Muscle creatine kinase-deficient mice. II Cardiac and skeletal muscles exhibit tissue-specific adaptation of the mitochondrial function. J biol Chem. 1995;270(19):921–19. 929. doi: 10.1074/jbc.270.34.19921. [DOI] [PubMed] [Google Scholar]
- 44.Vertes RP. A PHA-L analysis of ascending projections of the dorsal raphe nucleus in the rat. J comp Neurol. 1991;313:643–668. doi: 10.1002/cne.903130409. [DOI] [PubMed] [Google Scholar]
- 45.Vitalis T, Cases O, Callebert J, Launay JM, Price DJ, Seif I, Gaspar P. Effects of monoamine oxidase A inhibition on barrel formation in the mouse somatosensory cortex: determination of a sensitive developmental period. J comp Neurol. 1998;393:169–184. doi: 10.1002/(sici)1096-9861(19980406)393:2<169::aid-cne3>3.0.co;2-0. [DOI] [PubMed] [Google Scholar]
- 46.Waldmeier PC, Delini-Stula AA. Serotonin–dopamine interactions in the nigrostriatal system. Eur J Pharmac. 1979;55:363–373. doi: 10.1016/0014-2999(79)90110-9. [DOI] [PubMed] [Google Scholar]
- 47.Waterhouse BD, Devilbiss D, Fleischer D, Sessler FM, Simpson KL. New perspectives on the functional organization and postsynaptic influences of the locus ceruleus efferent projection system. Adv Pharmac. 1998;42:749–754. doi: 10.1016/s1054-3589(08)60856-x. [DOI] [PubMed] [Google Scholar]
- 48.Waterhouse BD, Lin CS, Burne RA, Woodward DJ. The distribution of neocortical projection neurons in the locus coeruleus. J comp Neurol. 1983;217:418–431. doi: 10.1002/cne.902170406. [DOI] [PubMed] [Google Scholar]
- 49.Waterhouse BD, Moises HC, Woodward DJ. Interaction of serotonin with somatosensory cortical neuronal responses to afferent synaptic inputs and putative neurotransmitters. Brain Res Bull. 1986;17:507–518. doi: 10.1016/0361-9230(86)90218-2. [DOI] [PubMed] [Google Scholar]
- 50.Wiczynska B, Chojnacka-Wojcik E, Rokosz-Pelc A, Mazela H, Przegalinski E. Antiserotonin activity of 9-methyl-2-[3-(4-phenyl-1-piperazinylpropyl)]-1,2,3,4-tetrahydro-beta-carbolin-1-one (B-193) Pol J Pharmac Pharm. 1989;41:169–181. [PubMed] [Google Scholar]
- 51.Yamada J, Sugimoto Y, Horisaka K. The evidence for the involvement of the 5-HT1A receptor in 5-HT syndrome induced in mice by tryptamine. Jpn J Pharmac. 1989;51:421–424. doi: 10.1254/jjp.51.421. [DOI] [PubMed] [Google Scholar]