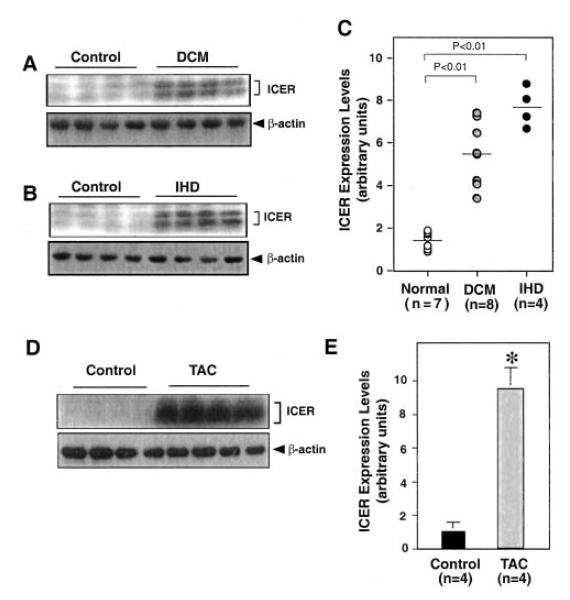
Figure 8.
Upregulation of ICER expression in human failing hearts and mouse failing hearts induced by chronic pressure overload (A and B). Western blots show ICER and β-actin protein levels in LV of nonfailing (control) and DCM (A) or IHD (B) hearts. C, Relative ICER expression level. The intensity of the band representing ICER was normalized to the intensity of 1 control sample that was designated as 1. D, Western blots show ICER and β-actin protein levels in control mouse hearts and 8-week TAC mouse heats. E, Relative ICER expression level. The intensity of the band representing ICER was normalized to the intensity of 1 control sample that was designated as 1. Data represent mean±SD of 4 samples. *P<0.01 vs control mice.

