In 2006, the Medicare Part D program introduced universal publicly subsidized prescription drug coverage to American seniors. The program relies upon competition among drug plans to provide coverage. Plans have enormous scope to design benefits and to set premiums, but they may not charge differential premiums based on risk.
Naturally, these features of the market have led to concern about the possibility of adverse selection (Mark Pauly and Yuhui Zeng, 2004). As the Part D market has evolved, fewer enrollees have chosen generous plans, perhaps reinforcing concerns that an adverse selection “death spiral” is underway. Florian Heiss, Daniel McFadden, and Joachim Winter (2009) construct a dynamic theoretical model of plan choice, and use it to conduct counterfactual policy simulations. They find that the current design of the program encourages adverse selection.
The primary tool available to Part D plans to induce risk selection is formulary and benefit design. Formulary and benefit design (FBD) encompasses the set of drugs covered by a plan (called its formulary) and the deductible, number of drug tiers, copayment/coinsurance on each tier, assignment of drugs to tiers, and etc. (called its benefit design). Because there are thousands of drugs, each of which may be covered on one of many tiers or not covered at all, there are a great many possible FBDs. It is not trivial to calculate one’s expected out-of-pocket (OOP) costs in any particular FBD. Furthermore, the average market has nearly 50 different prescription drug plans to choose from.
The cognitive burden of choosing the best plan is quite high, and this has animated another branch of the literature. Jason T. Abaluck and Jonathan Gruber (2009) document that, in 2006, only 12 percent of enrollees chose their OOP cost-minimizing plan, and that their average losses amounted to about 31 percent of their spending. However, Jonathan D. Ketcham, Claudio Lucarelli, Eugenio Miravete, and M. Christopher Roebuck (2010) find that 81 percent of individuals improved their choices between 2006 and 2007, reducing overspending by $300.
In this research, we use the full set of Medicare Part D prescription drug plans, a complete description of their FBD, and pharmacy claims data for a sample of elderly retirees to construct a simulation model of OOP drug spending. We use this simulation model to examine the individual incentives which exist in the Medicare Part D program for adverse selection. To do this, we measure the generosity of each Medicare prescription drug plan available in 2007. Then, we assess the differential incentive for high-drug users and low-drug users to enroll in stingy and generous plans. We find that high users have much stronger incentives to enroll in generous plans than do low users, thus there is significant scope for adverse selection in this market.
I. Medicare Part D Design
We only briefly describe the Part D program (c.f. Mark Duggan, Patrick Healy, and Fiona Scott Morton, 2008).
Elderly individuals who qualify for Medicare can receive prescription drug benefits in a number of ways. If they are covered by an employer’s retiree plan, then they may stay outside the Part D program. If they are enrolled in Medicare’s fee-for-service program, then they can purchase a stand-alone prescription drug plan (PDP). If they choose to enroll in a Medicare managed care plan, they can either purchase a PDP or enroll in a Medicare Advantage-Prescription Drug program (MA-PD) which combines managed care and drug coverage.
Both PDPs and MA-PDs must abide by minimum coverage requirements. In 2007, these minima required a deductible of no more than $265, then coverage for at least 75 percent of drug expenditures up to a covered amount of $2,400. From this level until OOP spending reached $3,850, no coverage was required---this is the “doughnut hole.” For OOP spending above $3,850, coinsurance was required to be no more than 5 percent, essentially.
Plans were free to provide coverage more generous than this minimum. They were permitted to waive the deductible, cover some or all drugs in the doughnut hole, etc. Furthermore, they were free to provide this coverage using benefit designs involving coinsurance or copayments or a mixture of the two. Plans were free to choose which drugs to cover (subject to a few requirements).
A significant majority of Part D enrollees were in plans which used a tiering structure. In a tiered plan, each drug on the plan’s formulary is assigned to a tier (often with names like “generics,” “preferred branded,” “non-preferred branded”), and each tier is assigned a particular copayment.
II. Data
We use two primary sources of data. First, we use a database of health insurance claims for privately insured individuals in the United States. These data are provided by a leading healthcare information company which provides cost management and benefit consulting services to employers, health plans, pharmaceutical manufacturers, and others. The database contains complete medical claims including inpatient care, outpatient care, and pharmaceutical use for individuals insured by approximately 40 large employers in the United States.
The pharmaceutical claims data contain a record for each outpatient prescription filled for each individual covered by each drug plan in the data. Each record contains a scrambled individual identifier, information on the type of drug, the drug name, the National Drug Code1 (NDC) identifying the drug, dosage, days supplied, place of purchase, and payments by enrollees and by health plans for the drug.
In addition to claims data, the database also provides basic demographic information and summary descriptions of the benefit designs of the private insurance plans.
Each employer in the database has a number of different health plans. These different plans may reflect a menu of different choices available to enrollees, different plans available to employees in different geographical areas, different plans available to union and non-union employees, and different plans available to active employees and retirees. Many employers offered health benefits to their retirees (and their dependents), and these plans and enrollees are reflected in the database.
From this database we draw a sample of individuals aged 65 and older. We draw only individuals who filled at least one prescription in 2007. In order to ensure that our sample represents a wide variety of health plans and benefit designs, we draw five enrollees randomly from each of the 342 plans covering people aged 65 and older in our data. For each of the 1,710 sampled individuals, we draw all of their pharmaceutical claims for 2007. The individuals in our sample are not enrolled in Medicare Part D: they are enrolled in their employer’s retiree prescription drug plan.
Our second source of data is the Medicare Prescription Drug Plan Formulary and Pharmacy Network Files (PDPFPNF). The PDPFPNF provides a detailed description of each Medicare Part D plan’s FBD. These files are available monthly starting in 2006, and we use the January 2007 files.
These files contain identifiers for each Medicare Part D plan. These identifiers link to formulary files which list the NDC code of each drug covered on each plan’s formulary. The formulary files also identify to which cost-sharing tier each drug is assigned. A separate file describes the coinsurance or copayment rate associated with each tier of coverage in each coverage segment (deductible, initial coverage segment, doughnut hole, catastrophic coverage). Thus, using the PDPFPNF, it is possible to identify the cost sharing associated with any covered drug in any Part D plan on any coverage segment.
We choose to focus only on PDP plans of which there are 1,909 in the data for 2007. Firms may offer many plans, so there are many fewer than 1,909 firms in the data. There are 39 PDP markets defined by the Centers for Medicare and Medicaid Services (CMS), and a firm which offers the same plan in each of these contributes 39 plans to the overall count. In addition, the same firm may offer multiple plans in the same market.
In addition to these primary sources of data, we also link plans to their enrollment and premium data, available from the CMS Web site.
III. Methods
Our principal methodology is a simulation model which maps any individual’s pharmaceutical claims history and any plan FBD into the OOP spending that the individual would have generated had he been enrolled in that plan. This is a seemingly straightforward exercise. Each enrollee’s prescription history for the year is “run through” each PDP plan’s FBD. As the history is run through, the simulation keeps track of which coverage segment the individual is on and looks up the relevant OOP payment using the plan’s FBD. 2 However, in order to perform this simulation, several issues must be confronted.
First, the relative prices of different drugs differ among plans. Some plans assign drug A to a tier with a $20 copayment and drug B to a tier with a $30 copayment. Some plans assign drug A to a tier with a $40 copayment and drug B to a tier with a $25 copayment. Still other plans assign drug A to a tier with a $25 copayment and do not cover drug B at all. The differences in OOP spending among plans depends on what assumptions one makes about the substitution elasticities among drugs and about the substitution elasticities between drugs and the outside good. Because the evidence on the magnitude of these elasticities is so sparse at present, we assume throughout that drugs are perfectly inelastically demanded---that the same basket of drugs is consumed no matter which plan an enrollee is assigned to.
Second, the prices faced by enrollees for prescriptions which are not covered by the PDP are not observed by us. A prescription may not be covered either if it is for a drug that is not on the plan’s formulary or if the enrollee is currently in the plan’s doughnut hole. Recall that we can observe, for the individuals in our privately-insured sample, the total price paid (i.e. their copayment plus the plan’s reimbursement to the pharmacy) for the prescriptions they fill. We assume that, in the cases where a drug is not covered by a plan we are simulating, the enrollee pays this full price observable in our individual data.
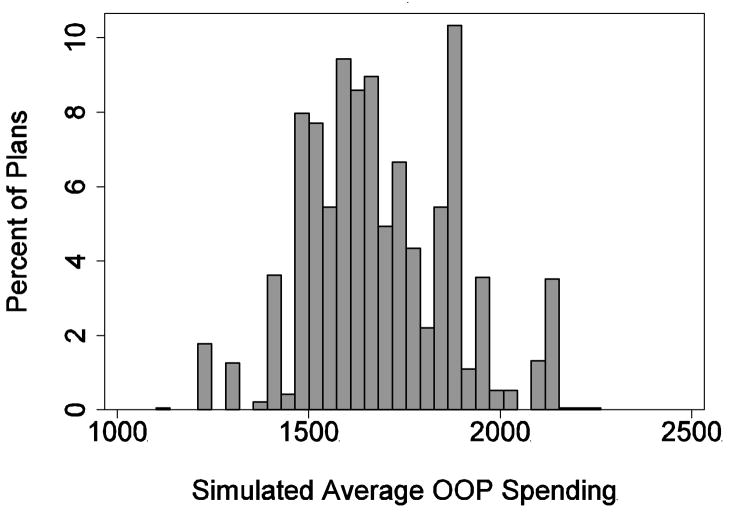
Each of the 1,710 individuals in our pharmacy claims database is simulated through each of the 1,909 PDP plans in our FBD database. To measure the overall generosity of each plan, we calculate the average3 (over individuals) OOP spending generated by each plan. This average OOP spending is a plan’s stinginess.
IV. Results
In order for adverse selection to be an issue, plans must differ significantly in their generosity, and the plans we examine do differ widely in many measures of generosity.
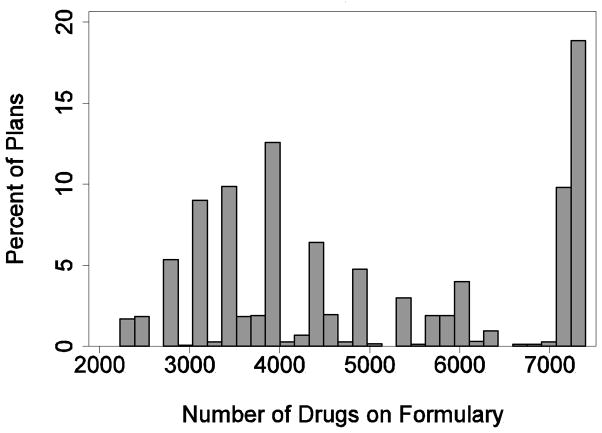
Figure 1 presents a histogram of the number of drugs contained on plan formularies. An observation in this figure is a PDP plan, and the frequencies are unweighted. The number of covered drugs varies widely, from a low of 2,226 to a high of 7,395. The median number of covered drugs is 4,378 and the inter-quartile range is 3,737. The “spikiness” of the histogram is caused by the fact that different plans offered by the same firm in different markets generally offer the same formulary.
Figure 1.
Variation in Drugs on Formulary
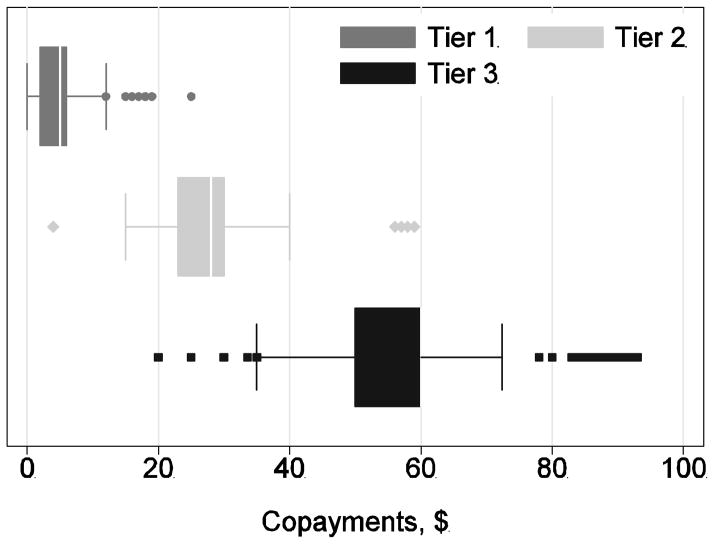
Cost sharing terms also differ widely among plans. Figure 2 presents a box-and-whiskers plot of the level of copayments for the first three payment tiers (generally for generics, brands from a preferred list, and brands from a non-preferred list) for the plans using a tiered copayment benefit design. As is apparent, plans differ widely in this design element as well. Copayments for tier 1 drugs vary from $0 to $25 with a mean of $4. Copayments for tier 3 drugs vary from $20 to $93 with a mean of $57.
Figure 2.
Variation in Copayments
Figure 3 presents the variation among plans in the measure of stinginess described above. A plan’s stinginess is its average (over individuals) in simulated OOP spending. Stinginess varied from $1,102 to $2,263. The median level of stinginess was $1,686 and its standard deviation was $190.
Figure 3.
Variation in Plan Stinginess
Many other characteristics displayed this same wide variation. About 29 percent of plans covered some generic drugs in the doughnut hole. Some 61 percent of plans had no deductible while 31 percent charged the maximum allowable deductible of $265.
To get an idea about the incentives for adverse selection, we divide the 1,710 individuals in our pharmacy claims data into three groups. These groups are defined in terms of their actual observed spending in the pharmacy claims data (not according to any of their simulated spending). High users comprise the top quartile of spenders. Low users comprise the bottom quartile of spenders, and moderate users comprise the balance.
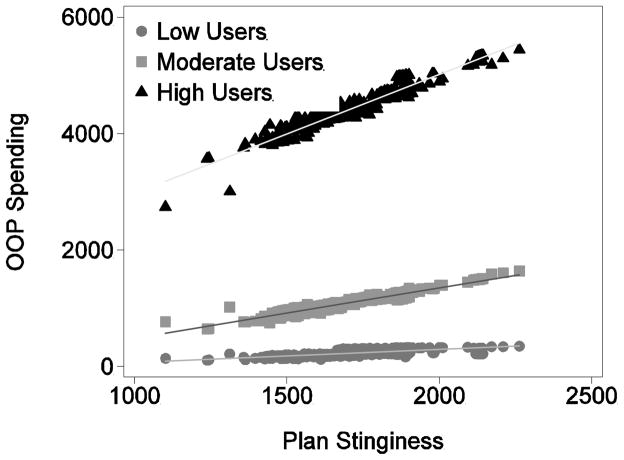
Figure 4 shows how individuals in these three different risk groups value plan generosity. The three groups of points correspond to the low, moderate, and high users. There are 1,909 points in each group, corresponding to the 1,909 PDP plans. Each point in (for example) the high user group represents the average simulated OOP spending for high users only in a single plan.
Figure 4.
Differential Valuation of Plan Generosity
The salient thing about this graph is that the slopes of the three lines are quite different. For moderate users, a $1 increase in a plan’s stinginess leads to about a $0.86 increase in OOP spending. For low users, a $1 increase in stinginess leads to $0.23 more in OOP spending. For a high user, a $1 increase in stinginess leads to a $2.04 increase in OOP spending. Across the inter-quartile range of plan stinginess, low users see a $105 difference in OOP spending while moderate and high users see $222 and $575 difference, respectively.
Very similar results were generated when limiting analysis only to plans in single markets and by further limiting analysis only to plans with enrollment greater than 10,000 individuals. It’s worth noting that these calculations all ignore premiums; however, premiums are constant across risk types; therefore, including them could have no effect.
V. Discussion/Conclusions
These results indicate that there may be considerable scope for adverse selection in the Medicare Part D market, but there are a number of caveats to the analysis.
First, we are implicitly assuming that enrollees know their drug spending in the coming year when they make their enrollment decisions. Taken literally, this is an untenable assumption; however, one-year-ahead drug spending is extremely predictable given knowledge of current drug consumption, and in a related analysis, Abaluck and Gruber (2009) found that replacing perfect foresight with the conditional expectation of one-year-ahead spending had little effect.
Second, scope for adverse selection or incentive for adverse selection is not the same thing as adverse selection itself. If enrollees do not choose their plans optimally, then actual adverse selection may be blunted or not existent. Indeed, Abaluck and Gruber (2009) find that enrollee choice of Part D plans is often sub-optimal. However, they also find that OOP spending is predictive of plan choice. They find that consumers weigh expected OOP spending less than they weigh premiums. Thus, it is reasonable to expect that an incentive for adverse selection would generate at least some adverse selection in fact.
Acknowledgments
We thank Claudio Lucarelli for valuable comments, and the National Institutes of Health for support under grant 5R01AG029514-04.
Footnotes
The NDC code is a code assigned by the Food and Drug Administration to each approved drug.
Throughout, we perform our calculations assuming that the enrollees are not eligible for low-income subsidies, additional subsidies available to poor individuals.
Throughout, all calculations using the individual pharmacy claims data are weighted so that the age distribution of the sample population matches the age distribution in the Medicare fee-for-service program.
References
- Abaluck John T, Gruber Jonathan. Working Paper 14759. National Bureau of Economic Research; 2009. Choice Inconsistencies Among the Elderly: Evidence from Plan Choice in the Medicare Part D Program. http://www.nber.org/papers/w14759. [Google Scholar]
- Duggan Mark, Healy Patrick, Morton Fiona Scott. Providing prescription drug coverage to the elderly: America’s experiment with Medicare Part D. Journal of Economic Perspectives. 2008;22(4):69–92. doi: 10.1257/jep.22.4.69. [DOI] [PubMed] [Google Scholar]
- Heiss Florian, McFadden Daniel, Winter Joachim. Working Paper 15392. National Bureau of Economic Research; 2009. Regulation of Private Health Insurance Markets: Lessons from Enrollment, Plan Type Choice, and Adverse Selection in Medicare Part D. http://www.nber.org/papers/w15392. [Google Scholar]
- Ketcham Jonathan D, Lucarelli Claudio, Miravete Eugenio, Christopher Roebuck M. Sinking, Swimming, or Learning to Swim in Medicare Part D. 2010 doi: 10.1257/aer.102.6.2639. http://eugeniomiravete.com/papers/KLMR_PartD.pdf. [DOI] [PubMed]
- Pauly Mark V, Zeng Yuhui. Forum for Health Economics & Policy. Vol. 7. Frontiers in Health Policy Research; 2004. Adverse Selection and the Challenges to Stand-Alone Prescription Drug Insurance; p. Article 3. http://www.bepress.com/fhep/7/3. [DOI] [PubMed] [Google Scholar]


