

Abstract
It was hypothesized that nanoscale adhesion ligand spacing regulates cell adhesion, proliferation, and differentiation, and that this control can be decoupled from the overall ligand density. Alginate was chemically modified with a peptide containing the cell adhesion sequence arginine–glycine–aspartic acid (RGD), and the nanoscale spacing of RGD ligands in alginate gels was varied. A decrease in the RGD island spacing from 78 to 36 nm upregulated the proliferation rates of MC3T3-E1 cells from 0.59 ± 0.08 to 0.73 ± 0.03 day−1 and resulted in 4-fold increase of the osteocalcin secretion rate. This finding was independent of the bulk ligand density of gels. These results indicate that nanoscale ligand organization may provide an important variable to regulate cell functions in many biomedical applications, including tissue engineering.
Introduction
The cellular adhesion ligands present in the extracellular matrix (ECM) play a critical role in controlling multiple aspects of cell phenotype, including morphology, motility, proliferation, and differentiation.1,2 While there are many receptor interaction sites available in ECM components, the Arg–Gly–Asp (RGD) sequence has been extensively exploited in studies aimed at improving the understanding of ligand–receptor interactions. This sequence binds to many integrin receptors, including αvβ3 and α5β1,3 and is found in many ECM proteins (e.g., fibronectin, laminin, vitronectin).4,5 The presence and distribution of this ligand in synthetic ECMs can clearly regulate cellular responses to these materials.6,7
The major independent variables one can manipulate to investigate the effect of adhesion ligand organization on cell phenotype include the overall or bulk ligand density, the number of ligands clustered together at one location (termed island density in this paper), and the spacing between ligand islands (termed ligand island spacing throughout this paper). The role of bulk ligand density has been widely investigated in past studies, and the density of laminin, fibronectin, and other ECM molecules adsorbed to tissue culture surfaces has been found to regulate the proliferation and differentiation of hepatocytes,8 endothelial cells,9 and other cell types.10 Similarly, the bulk density of RGD peptides in synthetic ECMs regulates the proliferation and/or differentiation of various cell types in vitro and in vivo.11,12 More recently, the size of domains containing cellular adhesion ligands, in the tens of microns scale, has been found to influence the spreading and apoptosis of endothelial cells,13 and the spacing between adhesion ligands in the hundreds of nanometer scale regulated cell spreading and focal contact formation.14 A recent report also indicates that the spacing between islands in the tens of nanometer scale can influence cell migration in vitro.15 However, these studies have not investigated cell phenotype beyond adhesion and migration.
We hypothesized that controlling the distance between cellular adhesion ligand islands, in the nanometer size scale, regulates the phenotype of preosteoblasts, and that these cellular responses could be decoupled from the effects of the bulk ligand density. We selected alginate hydrogels as a synthetic ECM for this study, as hydrogels formed from this material are generally considered biocompatible, due to their high water content and low interfacial tension with surrounding biological environments.16,17 Importantly, alginate lacks intrinsic cell-binding capacity and serves as a blank substrate upon which one can present defined types, densities, and organization of various cellular adhesion ligands.12,18 Alginate forms hydrogels via ionic cross-linking with divalent cations (e.g., Ca2+) and has been widely utilized in many biomedical applications.19,20 We independently varied both the bulk density of the adhesion ligands in alginate gels and the spacing between the ligand islands in the current study. A single adhesion ligand can be coupled to a polymer chain, and the cellular adhesion ligands subsequently can be uniformly distributed through the hydrogel (Figure 1A). In this situation, the RGD spacing and the bulk density of RGD peptides in the gel are coupled to each other. The polymer chain, however, can be also modified to contain multiple peptides. Simple mixing of RGD-modified and unmodified alginate at different mixing ratios allows one to decouple the RGD island spacing and bulk RGD density in the gel. Thus, cellular adhesion ligands can be spatially organized to form discrete islands that possess various local densities and sizes, while the bulk density of RGD peptides remains constant over the gel (Figure 1B). An RGD-containing peptide was chemically coupled to the alginate backbone and used to generate various nanoscale ligand-organized structures. The adhesion, proliferation, and differentiation of MC3T3-E1 preosteoblasts, a widely used model of osteoblast differentiation,21 were subsequently quantified following their plating on these gels.
Figure 1.

Schematic description of how nanoscale adhesion ligand organization was varied. A single adhesion ligand can be coupled to a polymer chain and uniformly distributed through the hydrogel (A). In contrast, the polymer chains can be also modified to contain multiple peptides, and then these chains can be simply mixed with unmodified polymer chains to form discrete ligand islands (B). In this example, the bulk ligand density (overall number of peptides/volume) was maintained constant in (A) and (B), while varying the island density (number of peptides/polymer chain) and island spacing (distance between polymer chains containing coupled peptides).
Materials and Methods
Peptide-Modified Alginate
Sodium alginate (Pronova) was modified with a peptide of the sequence (glycine)4–arginine–glycine–aspartic acid–serine–proline (G4RGDSP), which was purchased from Commonwealth Biotechnologies (Richmond, VA). In brief, sodium alginate was dissolved in 2-(N-morpholino) ethane-sulfonic acid (Sigma) buffer (pH 6.5, 0.3 M NaCl) at room temperature, and the peptide was added to the alginate solution in the presence of N-hydroxysulfosuccinimide (sulfo-NHS; Pierce) and 1-ethyl-3-(dimethylaminopropyl) carbodiimide (EDC; Aldrich).18 The peptide-modified alginate was purified by extensive dialysis against deionized water for 4 days (molecular weight cutoff, 3500), activated charcoal-treatment, and sterilization through a 0.22-μm filter. The density of RGD peptides coupled to the alginate backbone under the various reaction conditions was previously determined using radiolabeled RGD peptides as tracer molecules.18 A protective chemistry has not been used to prevent a coupling reaction between an amino group of arginine and the carboxyl group of alginate, as the only amine on the arginine that is protonated at the reaction conditions is a secondary amine, which would not participate in the carbodiimide reaction.
Hydrogel Preparation
Hydrogel disks for the adhesion and proliferation studies were prepared by ionic cross-linking of an alginate solution (2 wt %) with calcium sulfate (Sigma), cutting the gel into disks 10 mm in diameter and 0.75 mm thick, and preswelling disks in α-minimum essential media (α-MEM, Gibco) overnight. Hydrogel beads were prepared for differentiation studies by dropping alginate/cell solutions into a calcium chloride solution as previously described.10 We utilized a simple means to vary the structure of cellular adhesion ligands in the gels, using the inherent dimension of a single polymer chain. When alginate was modified to contain an average of one peptide per chain, the distance between RGD peptides in a gel formed entirely from this polymer was calculated to be 36 nm. This calculation was performed using the calculated specific volume of single alginate chain in the 2% gel. When the RGD-modified alginate was mixed with unmodified alginate, the RGD island spacing in the gel increased in parallel.
For example, 10 times dilution of RGD-modified alginate (e.g., nine parts of unmodified alginate with one part of alginate chains containing one or more RGD peptides per ligand islands) increased the RGD island spacing from 36 to 78 nm, as calculated from the spacing of the polymer chains in the resultant gels. In these idealized calculations, the RGD-modified polymer chains are assumed to be evenly distributed among the unmodified polymer chains. The various concentrations of RGD peptides, dilution factors, and idealized spacings in gels utilized in this study are listed in Table 1.
Table 1.
Characteristics of RGD Peptide-Organized Alginate Gels
| bulk RGD densitya (μg/mg alginate) | number of peptides per alginate chain | dilution factor | idealized RGD island spacing (nm) |
|---|---|---|---|
| 0.125 | 1 | 50 | 134 |
| 2 | 100 | 168 | |
| 1.25 | 1 | 5 | 62 |
| 2 | 10 | 78 | |
| 6.25 | 1 | 1 | 36 |
| 4 | 4 | 58 | |
| 10 | 10 | 78 | |
| 12.5 | 2 | 1 | 36 |
The mole ratio of carboxylate/sulfo-NHS/EDC in the reaction was kept constant at 40:1:2, and the amount of RGD peptides was varied. The reaction time was 24 h.
Computer Modeling
A two-dimensional Monte Carlo model was created to validate the idealized RGD island spacing in the gels. This model, in contrast to the idealized spacing calculation, reflects the random nature of polymer chain packing. Each alginate chain was represented as a hard disk with its center corresponding to the center of mass of the chain. The disks were randomly close packed according to an algorithm in which the disks were moved randomly while the systems was slowly compressed, and only non-overlapping moves were accepted. The distances between each RGD peptide-containing polymer chain and its six nearest RGD peptide-containing polymer chains were measured, averaged, and used as the RGD island spacing. To convert the computed RGD island spacing to nanometers, the molecular weight of alginate and the alginate concentration (w/v) were entered into the model.
Cell Culture Studies
MC3T3-E1 mouse calvarial preosteoblasts were cultured in α-MEM, containing 10% fetal calf serum (Hyclone) and 100 units/mL penicillin–streptomycin (Gibco). The cells were seeded on the surface of gels at the density of 1.0 × 10⁴ cells/cm2 and cultured in α-MEM. Photographs of MC3T3-E1 cells adhered to the gels were taken using a Nikon Eclipse E800 microscope, and the projected area of the cells was determined by means of Scion Image software (NIH, Bethesda, MD). At days 1, 3, and 5, the disks were treated with 1 mL of trypsin solution (0.05% in EDTA solution; Gibco) for 10 min and then placed in 7 mL of 50 mM EDTA in PBS (pH 7.4, 37 °C) for 20 min to dissolve the gel disks and collect the cells. The number of cells was then quantified using a Coulter counter (Coulter Electronics). Calibration of Coulter counting was performed periodically using cell counts performed with a haemocytometer and quantifying DNA content in samples.
MC3T3-E1 cells were also encapsulated into beads formed from alginate hydrogels (2 wt %), using calcium chloride as a cross-linker, at the concentration of 2.2 × 10⁷ cells/mL.20 The gel beads of approximately 1.4 mm diameter were collected and rinsed twice with PBS, transferred to 100 mL spinner flasks, and cultured in α-MEM containing 10% FBS and 100 units/mL penicillin–streptomycin. From day 2, media were changed every other day with fresh media supplemented with ascorbic acid (50 μg/mL), which was used to promote osteogenic differentiation of the cells. At days 2, 10, and 21, four samples of beads were collected, weighed, and placed in 24-well tissue culture plates. After adding 1 mL of fresh media to each sample, the plate was placed on an orbital shaker overnight at 37 °C. The media were then collected and assayed for osteocalcin content. The gel beads were dissolved in 50 mM EDTA in PBS for 30 min at 4 °C to release the encapsulated cells. After centrifugation and aspiration of the EDTA solution, passive lysis buffer (Promega) was added to the cell pellet. The cell lysates were then used for determination of DNA quantity. DNA quantification was performed using a Hoechst 33258 fluorescence assay. Samples were mixed with a Hoechst dye solution, and the fluorescence intensity was measured using a DynaQuant fluorometer. Calf thymus DNA was used as a standard. The osteocalcin assay was carried out using a mouse osteocalcin ELISA kit (BTI). Sample media and biotinylated secondary antibody were incubated in 96-well tissue culture plates coated with primary antibody. After washing and a short incubation with peroxidase–streptavidin conjugates, absorbance was measured at 450 nm and normalized by the total mass of DNA in that condition.
Statistical Analysis
Four samples were tested at each experimental condition (n = 4). Statistical analysis was performed by unpaired student t-test for two-tailed p-value determination using Instat software.
Results
To determine if the nanoscale organization of cellular adhesion ligands controls preosteoblast phenotype, RGD peptide-modified gels were prepared with various RGD bulk densities, island densities, and island spacings, and the response of preosteoblasts to the gels was quantified. First, a Monte Carlo model was exploited to determine the distribution of RGD peptide-coupled alginate chains in the gel and the RGD island spacing. Although a simple non-overlap model was created for our study, strikingly different distributions of RGD-modified alginate chains were observed depending on the dilution factor. The distance between islands decreased with the dilution factor, as anticipated. (Figure 2A,B). The average RGD island spacings were 89 ± 7 and 58 ± 2 nm for models with dilution factors of 10 and 4, respectively. These values are consistent with the calculated spacings for these conditions based on the idealized spacing (78 and 58 nm, respectively), as listed in Table 1. RGD islands that had other RGD islands immediately adjacent were termed groups of islands. The majority of groups of RGD islands in the model with a dilution factor of 10 were composed of single RGD-containing polymer chains, as one would observe with an even distribution of the chains in the gel. However, there were small fractions of larger groups at this condition, and there was an even greater fraction of large groups as the dilution factor was lowered to 4 (Figure 2C). These groups are essentially groups of a random percolation model.
Figure 2.

Distribution of RGD peptide-containing alginate chains in the gel at different dilution factors (A, 10; B, 4 dilution factor), calculated using a two-dimensional Monte Carlo modeling method (dark circle, RGD-containing polymer chain; gray circle, non-RGD-containing polymer chain). (C) The majority of peptide-containing polymer chains typically were present in a group size of one (no immediately adjacent peptide-containing chains), but the fraction of these chains present in groups of immediately adjacent peptide-containing chains increased with decreases in the dilution factor (○, 10; ●, 4 dilution factor).
To confirm that the adhesion and proliferation of osteoblasts can be controlled by the bulk RGD density (i.e., number of RGD peptides per total volume), MC3T3 cells were seeded on the surface of alginate gels with varying peptide densities. The number of cells adherent to the gels increased as the bulk density of RGD peptides in the gels increased (Figure 3A–C), as expected. The growth rate of the MC3T3 cells was also dependent on the bulk density of RGD peptides in the gels (Figure 3D), as expected.
Figure 3.

Effect of the bulk ligand density on the adhesion and multiplication of preosteoblasts. Photomicrographs of MC3T3 cells adherent to the surface of gels modified with different concentrations of peptides (A, [RGD] = 1.25; B, 6.25; C, 12.5 μg/mg polymer). Original pictures were taken after 24 h of culture (scale bar, 100 μm). (D) Growth rates of MC3T3 cells over 5 days after seeding on gels with different bulk RGD densities.
The RGD island spacing (i.e., distance between RGD islands) was next varied, while maintaining a constant bulk density of RGD peptides in the gels. MC3T3 cells were seeded on the surface of gels with an average ideal island spacing of either 62 nm (Figure 4A) or 78 nm (Figure 4B), while maintaining a constant bulk peptide density of 1.25 μg/mg alginate. Cells adherent to the gels with an island spacing of 78 nm demonstrated a more extended shape, compared to cells on the gels with an island spacing of 62 nm, irrespective of the same total number of RGD peptides in both gels. Quantification of the projected area of MC3T3s demonstrated a significant increase as the island spacing increased (Figure 4C). This finding indicates that the spacing of RGD islands in the nanometer scale regulates the morphology of cells adhered to the materials presenting the peptides. Surprisingly, the growth rate of the cells was suppressed as the RGD island spacing increased (Figure 4D). This finding was unexpected, as typically cell proliferation increases with cell spreading.22,23 The same trends were observed when the bulk density of RGD peptides was increased from 1.25 to 6.25 μg/mg alginate and the island spacing was varied from 36 to 78 nm (Figure 4C and 4D). The dependence of cell growth rates on RGD island spacings and local RGD densities was evaluated by plotting the combined data from both experiments as growth rate versus either RGD island spacing or the number of ligands/island (Figure 5). The proliferation rate of MC3T3 cells was closely correlated to the distance between ligand islands, despite changes in the bulk ligand density of the gels comprising this curve (Figure 5A). In contrast, no clear correlation between the proliferation rate of MC3T3 cells and the number of RGD peptides per single ligand island was observed (Figure 5B). This finding suggests that the RGD island spacing in the nanometer size scale is more important to cell growth than the bulk or island density of cellular adhesion ligands, in the ranges of RGD concentrations and domain sizes used in this study. The differentiation of MC3T3-E1 was also studied to test if the RGD island spacing regulated their differentiation. Gels with different RGD island spacings (36 versus 78 nm) but a constant bulk ligand density were evaluated. The secretion rate of osteocalcin, a typical marker of the late stage of osteoblast differentiation, significantly increased as the RGD island spacing was decreased from 78 to 36 nm while maintaining a constant bulk RGD density (Figure 6).
Figure 4.
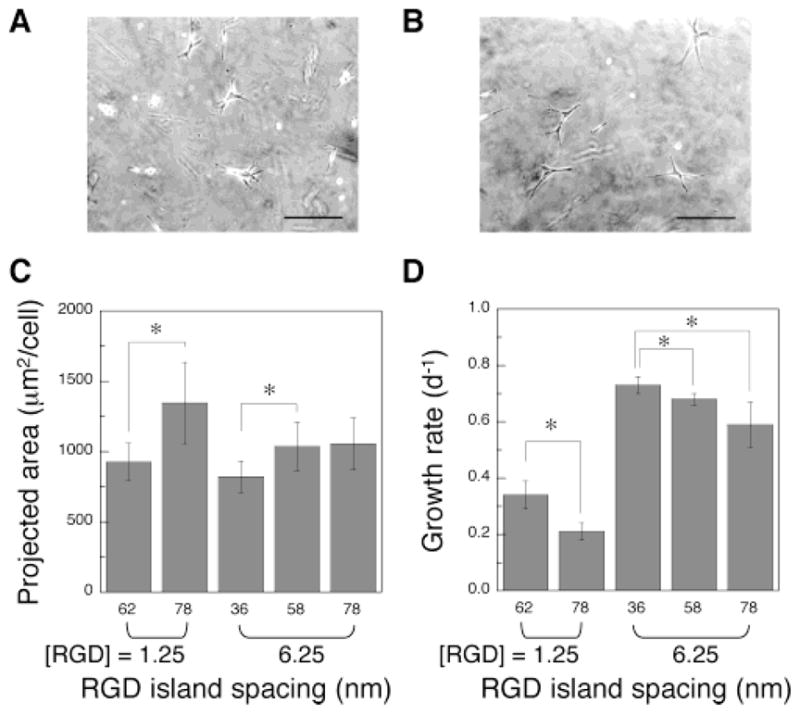
Effect of the RGD island spacing on the adhesion and proliferation of preosteoblasts. Photomicrographs of MC3T3 cells adherent to the surface of gels with different RGD island spacings (A, 62; B, 78 nm), while maintaining the same bulk RGD density ([RGD] = 1.25 μg/mg polymer). Original pictures were taken after 24 h of culture (scale bar, 100 μm). Projected area (C) and growth rates (D) of MC3T3 cells adherent to gels of differing bulk densities of peptides, and varying island spacings of ligands. Asterisk (*) represents statistical significance at a level of p < 0.05.
Figure 5.

(A) The osteoblast proliferation rate was strongly dependent on the RGD island spacing in gels, even in the face of various bulk ligand densities (○, 0.125; ●, 1.25; □, 6.25; ■, 12.5 μg/mg polymer). (B) No simple effect of the island density on the osteoblast proliferation rate was observed (○, 0.125; ●, 1.25; □, 6.25; ■, 12.5 μg/mg polymer).
Figure 6.

Osteoblast differentiation in gels. MC3T3 cells were cultured in gel beads with different RGD island spacings (○ no RGD; □, 36 nm; △, 78 nm), while maintaining a constant bulk ligand density ([RGD] = 6.25 μg/mg polymer) in the latter two conditions, and the secretion level of osteocalcin was quantified and normalized by the amount of DNA.
Discussion
The results of these studies demonstrate that the nanoscale organization of RGD peptides in gels used for cell culture regulates the adhesion, proliferation, and differentiation of osteoblasts. The adhesion and proliferation of MC3T3 cells were enhanced by increasing the bulk density of RGD peptides in gels, as anticipated. The spacing between islands of peptides strongly correlated to the cell proliferation rate, independently of the bulk RGD density. However, the island density, which was defined to be the number of RGD peptides per single polymer chain, did not clearly regulate osteoblast phenotype in the range examined in this study.
The adhesion and proliferation of MC3T3 cells cultured on alginate gels were dramatically enhanced by chemical conjugation of RGD peptides to the alginate backbone. The number of cells adherent to the gels, as well as the growth rate, was strongly dependent on the bulk RGD density of the gels interacting with the cells (Figure 3), which is in good agreement with previous studies.24. Specifically, the growth rate of MC3T3 cells was upregulated by an increase of the bulk RGD density in the gels up to 12.5 μg/mg alginate in this study. Differences in the range of ligand densities required for optimal cell adhesion and proliferation in this study and past studies10,18,24 may be attributed to differences in the types of ligands and cells utilized in the various studies. Overall, the present findings parallel those of many other systems used to present cellular adhesion ligands to cells and probe the effect of ligand types and bulk densities on cell phenotype.10,11,18,22,23
It was striking that, in certain experiments, the initial spreading of MC3T3 cells was significantly enhanced as the RGD island spacing increased but the growth rate of the cells was unexpectedly suppressed in parallel (Figure 4). These effects were decoupled from the bulk ligand density in the gel (Figure 5A). It has been reported that the minimal ligand spacing required for integrin-mediated cell adhesion is in the range of several tens of nanometers, depending on the types of adhesion ligands and substrates.25–27 However, the significance of the nanoscale organization of the ligands has not been investigated in detail, and most previous studies have focused on controlling the bulk ligand densities, to control ligand spacings. In these studies, it has been demonstrated that cellular adhesion and proliferation were enhanced as the RGD spacing decreased in parallel with an increase of the bulk ligand density. The discrepancy of our results from the previous studies may be attributed to alterations in focal contact and assembly and subsequent signaling that are not reflected in the cell shape. The effective ligand island spacing (approximately 50 nm) required for significant cell spreading and proliferation found in this study is lower than the previously reported value of 440 nm for integrin-mediated cell spreading,14 likely due to the softer substrate (hydrogel) used in this study than the rigid silanized glass used in that study. The spacings used in this study are very similar to the values (approximately 10–60 nm) demonstrated for effective cell migration on compliant PEG gels.15 The differentiation of MC3T3 cells interacting with gels containing spatially organized adhesion ligands in this study was significantly affected by the RGD island spacing (Figure 6). The secretion rate of osteocalcin from the cells was increased almost four times as the RGD island spacing decreased from 78 to 36 nm, even at the same bulk RGD density. This latter study was performed using cells encapsulated in gel beads as previously reported,10 and suggests cells respond to nanoscale ligand organization in three dimensions. This latter finding may be readily adapted and utilized for regeneration of tissues and organs in tissue engineering applications.28,29
Interestingly, no overriding relationship between preosteoblast proliferation and the island density was observed in the concentration ranges utilized in this study (e.g., 1–10 peptides per single RGD island). The growth rate of MC3T3s was increased with RGD island densities, when the bulk density increased in parallel, but not when the bulk density was maintained constant by simultaneously increasing island spacings (Figure 5B). Some fraction of the coupled peptides may not be accessible to cells in this gel system, or there may be some steric hindrance between peptides in an island. The spacing of ligand islands calculated using a random packing model was similar to calculations assuming an even and idealized distribution of RGD-modified polymer chains. However, the former calculation also revealed that a fraction of ligand islands are closely associated with each other. This effect has not been previously recognized and is likely present in all systems in which peptides are presented from polymer chains in a similar manner. These island groupings could have significant implications for the cell response to these types of materials.
Conclusions
These studies demonstrate that the nanoscale organization of adhesion ligands can regulate the adhesion, proliferation, and differentiation of preosteoblasts. The bulk ligand density, a typical parameter in the design and tailoring of biomaterials for cell culture, controlled osteoblast phenotype as previously reported. However, the island density (e.g., the number of RGD peptides per single RGD island) did not dramatically influence the proliferation of osteoblasts. Strikingly, controlling the ligand island spacing strongly regulated the adhesion, proliferation, and differentiation of osteoblasts interacting with the gels, and these cellular responses could be decoupled from the bulk ligand density in the gels. This approach to control the distribution and spacing of adhesion ligand islands in the nanometer size scale may shed light on the design and function of the extracellular matrix and be useful to regulate cell functions in many biomedical applications.
Acknowledgments
This work was supported by the U.S. Army Research Laboratory and the U.S. Army Research Office under contract/grant number DAAD190310168.
Footnotes
Note Added after ASAP Publication. Authors Lee and Alsberg have been designated (⊥) as contributing equally to this work. The original version was posted 7/13/04; the corrected version was posted 7/20/04.
References
- 1.Gottschalk KE, Kessler H. Angew Chem, Int Ed. 2000;41:3767–3774. doi: 10.1002/1521-3773(20021018)41:20<3767::AID-ANIE3767>3.0.CO;2-T. [DOI] [PubMed] [Google Scholar]
- 2.Duggan ME, Hutchinson JH. Expert Opin Ther Pat. 2000;10:1367–1383. [Google Scholar]
- 3.Ruoslahti E. Annu Rev Cell Dev Biol. 1996;12:697–715. doi: 10.1146/annurev.cellbio.12.1.697. [DOI] [PubMed] [Google Scholar]
- 4.Buck CA, Horwitz AF. Annu Rev Cell Biol. 1987;3:179–205. doi: 10.1146/annurev.cb.03.110187.001143. [DOI] [PubMed] [Google Scholar]
- 5.Humphries MJ. J Cell Sci. 1990;97:585–592. doi: 10.1242/jcs.97.4.585. [DOI] [PubMed] [Google Scholar]
- 6.Hubbell JA. Bio-Technol. 1995;13:565–576. doi: 10.1038/nbt0695-565. [DOI] [PubMed] [Google Scholar]
- 7.Shin H, Jo S, Mikos AG. J Biomed Mater Res. 2002;61:169–179. doi: 10.1002/jbm.10193. [DOI] [PubMed] [Google Scholar]
- 8.Mooney DJ, Langer R, Ingber DE. J Cell Sci. 1995;108:2311–2320. doi: 10.1242/jcs.108.6.2311. [DOI] [PubMed] [Google Scholar]
- 9.Ingber DE, Folkman J. J Cell Biol. 1989;109:317–330. doi: 10.1083/jcb.109.1.317. [DOI] [PMC free article] [PubMed] [Google Scholar]
- 10.Alsberg E, Anderson KW, Albeiruti A, Franceschi RT, Mooney DJ. J Dental Res. 2001;80:2025–2029. doi: 10.1177/00220345010800111501. [DOI] [PubMed] [Google Scholar]
- 11.Schense JC, Hubbell JA. J Biol Chem. 2000;275:6813–6818. doi: 10.1074/jbc.275.10.6813. [DOI] [PubMed] [Google Scholar]
- 12.Alsberg E, Anderson KW, Albeiruti A, Rowley JA, Mooney DJ. Proc Natl Acad Sci USA. 2002;99:12025–12030. doi: 10.1073/pnas.192291499. [DOI] [PMC free article] [PubMed] [Google Scholar]
- 13.Chen CS, Mrksich M, Huang S, Whitesides GM, Ingber DE. Science. 1997;276:1425–1428. doi: 10.1126/science.276.5317.1425. [DOI] [PubMed] [Google Scholar]
- 14.Massia SP, Hubbell JA. J Cell Biol. 1991;114:1089–1100. doi: 10.1083/jcb.114.5.1089. [DOI] [PMC free article] [PubMed] [Google Scholar]
- 15.Maheshwari G, Brown G, Lauffenburger DA, Wells A, Griffith LG. J Cell Sci. 2000;113:1677–1686. doi: 10.1242/jcs.113.10.1677. [DOI] [PubMed] [Google Scholar]
- 16.Hoffman AS. Adv Drug Deliv Rev. 2002;54:3–12. doi: 10.1016/s0169-409x(01)00239-3. [DOI] [PubMed] [Google Scholar]
- 17.Lee KY, Mooney DJ. Chem Rev. 2001;101:1869–1879. doi: 10.1021/cr000108x. [DOI] [PubMed] [Google Scholar]
- 18.Rowley JA, Madlambayan G, Mooney DJ. Biomaterials. 1999;20:45–53. doi: 10.1016/s0142-9612(98)00107-0. [DOI] [PubMed] [Google Scholar]
- 19.Gombotz WR, Wee SF. Adv Drug Deliv Rev. 1998;31:267–285. doi: 10.1016/s0169-409x(97)00124-5. [DOI] [PubMed] [Google Scholar]
- 20.Smidsrød O, Skjåk-Bræk G. Trends Biotechnol. 1990;8:71–78. doi: 10.1016/0167-7799(90)90139-o. [DOI] [PubMed] [Google Scholar]
- 21.Wang D, Christensen K, Chawla K, Xiao GZ, Krebsbach PH, Franceschi RT. J Bone Miner Res. 1999;14:893–903. doi: 10.1359/jbmr.1999.14.6.893. [DOI] [PubMed] [Google Scholar]
- 22.Hansen LK, Mooney DJ, Vacanti JP, Ingber DE. Mol Biol Cell. 1994;5:967–975. doi: 10.1091/mbc.5.9.967. [DOI] [PMC free article] [PubMed] [Google Scholar]
- 23.Neff JA, Tresco PA, Caldwell KD. Biomaterials. 1999;20:2377–2393. doi: 10.1016/s0142-9612(99)00166-0. [DOI] [PubMed] [Google Scholar]
- 24.Mann BK, Tsai AT, Scott-Burden T, West JL. Biomaterials. 1999;20:2281–2286. doi: 10.1016/s0142-9612(99)00158-1. [DOI] [PubMed] [Google Scholar]
- 25.Singer II, Kawka DW, Scott S, Mumford RA, Lark MW. J Cell Biol. 1987;104:573–584. doi: 10.1083/jcb.104.3.573. [DOI] [PMC free article] [PubMed] [Google Scholar]
- 26.Danilov YN, Juliano RL. Exp Cell Res. 1989;182:186–196. doi: 10.1016/0014-4827(89)90290-5. [DOI] [PubMed] [Google Scholar]
- 27.Brandley BK, Schnaar RL. Anal Biochem. 1988;172:270–278. doi: 10.1016/0003-2697(88)90442-3. [DOI] [PubMed] [Google Scholar]
- 28.Langer R, Vacanti JP. Science. 1993;260:920–926. doi: 10.1126/science.8493529. [DOI] [PubMed] [Google Scholar]
- 29.Griffith L, Naughton G. Science. 2002;295:1009–1014. doi: 10.1126/science.1069210. [DOI] [PubMed] [Google Scholar]