

Abstract

A simple and robust nanolithographic method that allows sub-100 nm chemical patterning on a range of oxide surfaces was developed in order to fabricate nanoarrays of plant light-harvesting LHCII complexes. The site-specific immobilization and the preserved functionality of the LHCII complexes were confirmed by fluorescence emission spectroscopy. Nanopatterned LHCII trimers could be reversibly switched between fluorescent and quenched states by controlling the detergent concentration in the imaging buffer. A 3-fold quenching of the average fluorescence intensity was accompanied by a decrease in the average (amplitude-weighted) fluorescence lifetime from approximately 2.24 ns to approximately 0.4 ns, attributed to the intrinsic ability of LHCII to switch between fluorescent and quenched states upon changes in its conformational state. The nanopatterning methodology was extended by immobilizing a second protein, the enhanced green fluorescent protein (EGFP), onto LHCII-free areas of the chemically patterned surfaces. This very simple surface chemistry, which allows simultaneous selective immobilization and therefore sorting of the two types of protein molecules on the surface, is a key underpinning step toward the integration of LHCII into switchable biohybrid antenna constructs.
Introduction
All photosynthetic systems in living organisms contain light-harvesting pigment–protein complexes (LHCs) that enhance photosynthetic efficiency by capturing and concentrating light energy for the reaction center complexes (RCs), where the primary conversion of light energy into electrochemical potential takes place. There have been several recent examples of immobilization of RCs on various artificial support materials in order to study their ability to generate electric current in the substrate in response to light.1−4 Several reports also demonstrate that is possible to immobilize LHCs onto artificial surfaces, where they retain their functional properties.5−7 The advent of new lithographic techniques, such as those based on light8 or nanoimprinting,9−11 have opened up the possibilities of controlling the surface arrangements of groups of LHC molecules in order to examine their collective properties for energy propagation.12 The major target for such nanopatterning work has been the light-harvesting 2 (LH2) complex from the photosynthetic bacterium Rhodobacter sphaeroides, both as the normal, wild-type complex and in the form of site-directed mutants with genetically introduced tags such as cysteine residues that allow coupling to gold and other substrates.13,14 An understanding of how we can manipulate the functional properties of nanoscale arrays of LHCs immobilized on surfaces is the first step toward generating effective artificial systems that convert light energy into usable electrical current.
The major trimeric chlorophyll a/b-binding light-harvesting complex of plants (LHCII), which serves both photosystem I (PSI) and photosystem II (PSII) and is probably the most abundant membrane protein on earth,15−17 is an excellent test case for construction of nanoscale arrays. LHCII absorbs light over much of the visible spectral range and is able to transfer excitation energy rapidly (within a few picoseconds) and at high quantum efficiency to neighboring light-harvesting complexes and then toward the PSII or PSI RCs. Single-molecule and time-resolved fluorescence studies on LHCII have shown that the complex can be readily and reversibly switched between two conformational states, one (highly fluorescent) with a long fluorescence lifetime of ∼4 ns and the other (weakly fluorescent) with a much shorter lifetime of ∼0.3 ns, by controlling the environmental conditions such as detergent and pH.18−25 These experiments reflect the intrinsic ability of LHCII to switch between highly and weakly fluorescent states, which is believed to play an important photoprotective role in controlling energy input into the RCs by nonphotochemical quenching of chlorophyll fluorescence (NPQ).26−30 The fact that this property of LHCII can be triggered in vitro by altering the environment of this membrane protein makes the LHCII complex, or an engineered variant, a possible candidate as a component in future biohybrid optoelectronic devices. The fabrication of nanoarrays of LHCII is therefore a key underpinning step toward the integration of LHCII into biohybrid antenna constructs.
Nanoimprint lithography (NIL)31−35 is one of the most widely used technologies for high-throughput nanofabrication and nanoscale patterning and has the capability to produce sub-100 nm features,36,37 in particular, linear patterns of functional LH2 molecules.12 The NIL process, however, requires high temperature and high pressure during the replication step as well as a reactive ion-etching (breakthrough etch) step. For nanoscale patterning, especially for direct patterning of functional surfaces, it is often desirable to operate at a lower temperature and with reduced pressure, ideally under ambient conditions. To address mask–sample alignment problems caused by the mismatch in thermal expansion coefficients, a reverse-nanoimprint lithography (RNIL) process was developed38 that operates at lower temperature and pressure compared to NIL but still requires temperatures of the order of 100 °C (the glass transition temperature of the resist polymer film). It has been shown that this approach works for several thermoplastic materials such as polystyrene (PS) and can produce good topographical patterns with features down to 350 nm.38
In this paper we present an alternative method that combines the nanoimprinting approach with a wet lift-off and transfer of a thin polymer film replica, together with self-assembly of functional organosilane molecules in vapor phase39 on a range of oxide surfaces (glass or silicon oxide). This nanolithographic method allows sub-100 nm chemical patterns to be achieved for the immobilization of functional biomolecules. The effectiveness of this lithography approach was demonstrated by fabrication of single LHCII nanolines and double LHCII/enhanced green fluorescent protein (EGFP) structures on glass substrates; in situ measurements of fluorescence emission spectra and lifetimes show that the LHCII complexes had retained their functional properties.
Experimental Section
Protein Expression and Purification
LHCII
Trimeric LHCII from spinach was isolated as previously described by Ruban et al.40 Xanthophyll/chlorophyll composition was determined as previously reported for violaxanthin-enriched LHCII complexes in Kruger et al.41
SATP-Modified EGFP
Introducing the combined F64L, S65T, V68L, S72A, M153T, V163A, S175G, and A206 K mutations into the gene sequence of yellow fluorescent protein (YFP) [amplified by polymerase chain reaction (PCR) from pCS2-Venus vector] resulted in enhanced green fluorescent protein (EGFP) gene.42 The resulting NdeI/BamHI fragment was cloned into a pET14b expression vector (Novagen). EGFP proteins were produced by heterologous expression in Escherichia coli (BL21); cells were grown to an OD680 of 0.6 at 37 °C and then induced by use of isopropyl β-d-1-thiogalactoside (IPTG; 0.4 mM) for 12 h at 25 °C. Pelleted cells (19000g for 20 min) were lysed by sonication, and the resulting lysate was clarified by a further spin (33000g for 30 min). The EGFP protein was purified to homogeneity from clarified lysate on a chelating Sepharose Fast Flow nickel–nitrilotriacetic acid (Ni–NTA) gravity flow column (GE Healthcare) as detailed in the manufacturer’s instructions. Protein purity was assessed by sodium dodecyl sulfate–polyacrylamide gel electrophoresis (SDS–PAGE). In order to introduce sulfhydryl groups into the EGFP molecule, 1 mL of protein solution [concentration 5 μM in phosphate-buffered saline (PBS), pH 7.4] was reacted with 10 μL of 50 mM N-succinimidyl S-acetylthiopropionate (SATP, ThermoFisher Scientific) stock solution in dimethyl sulfoxide (DMSO) for 40 min at room temperature leading to the coupling of protected (acetylated) sulfhydryl groups to the primary amines exposed on the surface of the EGFP molecule. The SATP-modified EGFP was separated from unreacted SATP on a PG10 desalting column equilibrated with PBS, pH 7.4, and was stored at −20 °C for further use. Immediately prior to immobilization onto the patterned surfaces, the sulfhydryl groups were deacetylated by mixing 1 mL of SATP-EGFP with 100 μL of deacetylation solution [500 mM hydroxylamine and 25 mM ethylenediaminetetraacetic acid (EDTA) in PBS, pH 7.4], and the reaction was left to proceed for 2 h at room temperature. Then the sulfhydryl-modified EGFP was purified from the deacetylation solution on a PG10 desalting column equilibrated with PBS, pH 7.4, and immediately used for surface immobilization.
Si Master Template Fabrication
The master templates were fabricated by electron beam lithography (EBL) by using a two-step masking process: first, a NEB-31A resist was spin-coated onto a ∼1 mm thick Si wafer at 3000 rpm, resulting in ∼300 nm resist layer. The EBL exposure dose ranged from 200 μC·cm–2 (for larger structures) to 1700 μC·cm–2 for the narrower lines. Then, the resist was developed with n-amyl acetate. Next, a 20 nm thickness of Al was deposited in an electron beam thermal deposition system and used as an etch mask for the Si wafer. The final etching of the template into the Si wafer was performed in a plasma-assisted etcher in CF4/Ar atmosphere with the plasma power set to 100 W. The process was optimized to obtain an etch depth of 80–100 nm. The final process step is a soak in piranha solution to remove the aluminum etch mask.
Chemical Patterning of Surfaces
Polystyrene (PS) (Mw = 234 kDa, Polymer Source) was dissolved in toluene (HPLC-grade, Fisher Scientific) to a concentration of 55 mg·mL–1. The master template with the lithographically formed ridges was cleaned in piranha solution, washed copiously with ultrapure deionized (DI) water, and blown dry with a nitrogen stream. Then it was spin-coated with the polystyrene solution at 2000 rpm for 30 s, resulting in a layer of polystyrene approximately 180 nm thick [the thickness was measured by atomic force microscopy (AFM) over a scratch in the PS film, data not shown]. The thickness of the PS layer was controlled by the spinning speed and solution concentration, and it is important that the PS film is thick enough to completely cover the features on the master mold. Then, after the PS layer was carefully scratched off the edges of the master template, the coated surface was immersed into a clean Petri dish filled with approximately 40 mL of ultrapure DI water at a shallow angle (10°–15°), letting the water wet the hydrophilic master mold surface and lift the hydrophobic PS film onto the water surface by means of the surface tension forces. The result is a free-standing PS film, the topography of which is a negative replica of the master mold surface. At this point the free-standing PS film can be picked up with a wire loop, inverted, and deposited onto a flat Si substrate for inspection. Subsequently, the free-standing PS film can be transferred (floated on) to a clean flat substrate (either a piranha-cleaned glass coverslip or Si substrate) in the same orientation as it was released from the master mold. In doing so, the relief of the polymer film would make contact with the flat substrate only with its protruding parts. After the edges of the PS film were trimmed (in order to ensure that the channels formed between the PS film relief and the substrate are open to the atmosphere), the substrate with the masking polymer layer was dried under vacuum for 16 h in order to remove any residual water trapped between the substrate and the PS film. During the next step, an organosilane self-assembled monolayer (SAM) was created by a chemical vapor deposition (CVD) process. The substrate with the masking PS layer on top was placed into a 0.6 L desiccator and was purged with dry nitrogen for 10 min. Then 30 μL of 3-mercaptopropyltrimethoxysilane (MPTMS), placed in a cap from a microcentrifuge tube, was introduced into the desiccator. After the sample was purged with dry nitrogen for another 10 min, the desiccator was sealed, pumped down to a pressure of approximately 20 mbar, and left under vacuum for 16 h to allow formation of a SAM on the exposed parts of the substrate. After the organosilane deposition was completed, the masking PS film was floated off the substrate as described above and was reused for patterning of a fresh substrate. The substrate with the patterned organosilane monolayer was inspected by AFM and then was further converted to fully chemically patterned surface by a second CVD step in order to assemble a contrasting 1H,1H,2H,2H-perfluorooctyltriethoxysilane (fluorosilane) SAM on the newly exposed (clean) parts of the substrate. Alternatively, the second deposition step can be conducted in solution (e.g., 5 mM fluorosilane dissolved in dry toluene) under protective nitrogen atmosphere.
The chemically patterned surfaces used for the simultaneous immobilization of two proteins were prepared following the same procedure with two differences: first, a master template with lithographically formed trenches was used to produce the PS replica; second, during the first CVD step a 3-aminopropyltriethoxysilane (APTES) SAM was assembled onto the exposed areas of a glass substrate followed by a second CVD step filling in the gaps with a MPTMS contrasting monolayer.
Protein Immobilization
LHCII-Only Nanoarrays
The MPTMS/fluorosilane nanopatterned surfaces were incubated with 1 mM solution of sulfosuccinimidyl 4-(N-maleimidomethyl)cyclohexane-1-carboxylate (sulfo-SMCC) in PBS, pH 7.4, for 40 min, leading to a coupling reaction between the maleimide groups of the sulfo-SMCC and the sulfhydryl groups on the patterned surfaces and leaving the active N-hydroxysuccinimide ester (NHS ester) groups of the cross-linker molecule exposed. After extensive washing with PBS buffer, the modified surfaces were incubated with 85 nM solution of LHCII in nitrogen-sparged buffer [PBS, pH 7.4, with 0.03% n-dodecyl β-d-maltoside (β-DDM)] for 5 min at room temperature in the dark. After another extensive wash step with nitrogen-sparged buffer, the samples were mounted for either AFM or fluorescence microscopy imaging.
Mixed LHCII/EGFP Nanoarrays
The APTES/MPTMS nanopatterned surfaces were incubated with a 1 mM solution of sulfo-SMCC in PBS, pH 7.4, for 40 min converting the sulfhydryl groups of the MPTMS regions on the surface into active N-hydroxysuccinimide ester (NHS ester) groups and, at the same time, converting the amine functional groups of the APTES regions to maleimide groups. After a wash with PBS buffer, the modified surfaces were incubated with mixed LHCII/EGFP solution in nitrogen-sparged buffer (PBS, pH 7.4, with 0.03% β-DDM). The total protein concentration was approximately 25 nM (LHCII:EGFP ratio of 10:1) and the incubation time was 40 min at room temperature in the dark. After an extensive wash with nitrogen-sparged buffer, the samples were mounted for fluorescence microscopy imaging.
Atomic Force Microscopy Characterization
The AFM data were collected on a Multimode 8 instrument equipped with a 15 μm scanner (E-scanner) coupled to a NanoScope V controller (Bruker). NanoScope software (v8.15, Bruker) was used for data collection, and Gwyddion (v2.32, open source software covered by GNU general public license, www.gwyddion.net) and OriginPro (v8.5.1, OriginLab Corp.) software packages were used for data processing and analysis. The measurements of the patterned SAMs were performed in tapping mode in air at ambient conditions by use of AC160TS probes (Olympus) with a nominal spring constant of approximately 40 N·m–1 and a nominal resonant frequency of around 300 kHz.
The chemically patterned surfaces with the immobilized protein molecules on them were imaged in peak force tapping mode at nearly physiological conditions in buffer (PBS, pH 7.4), at room temperature by use of BL-AC40TS probes (Olympus). In this case, the Z-modulation amplitude was adjusted to values in the range 20–24 nm, while the Z-modulation frequency was 2 kHz and the contact tip-sample force was kept in the range 80–100 pN.
Fluorescence Measurements
The glass substrate (coverslip) with the protein nanoarray was mounted on a standard microscope slide, nanopatterned side facing the slide, with a droplet (20 μL) of nitrogen-sparged buffer (PBS, pH 7.4, with or without 0.03% β-DDM) and was sealed with DPX mountant (Sigma–Aldrich).
Fluorescence emission properties of the LHCII nanoarays were measured on a home-built inverted optical microscope (based on AxioObserverA1m, Zeiss) equipped with a spectrometer (Acton 150, Princeton Instruments) and an electron-multiplying charge-coupled device (EMCCD) camera (ProEM 512, Princeton Instruments). Excitation source was from a collimated light-emitting diode (LED) light source (M470L2,Thorlabs), and the resulting fluorescence emission was detected through the spectrometer onto the EMCCD camera.
During fluorescence imaging and spectral measurements, the excitation light was filtered by a 470/40 nm bandpass filter, then reflected by either 605 or 488 nm dichroic beamsplitter to the sample, and the fluorescence emission from the sample was filtered by either 593 or 500 nm long-pass filters. The spectra were captured with a slit width of 800 μm and a 150 line·mm–1 grating at a central wavelength of either 680 or 540 nm in the spectrometer. Each fluorescence image and the spectra were average of 10 frames with 0.1 s exposure time with an electron multiplication gain of 90.
Time-lapsed fluorescence measurements were conducted in a home-built flow cell (with a volume of approximately 100 μL) made of commercial optical adhesive (NOA 81, Norland Corp.), which was mounted on a standard microscope slide. The glass coverslip with linear LHCII nanopatterns was attached and sealed within the flow cell by using DPX microscopy resin (Sigma–Aldrich). Initially, the flow cell was flushed with imaging buffer supplied with 0.03% β-DDM, and the data acquisition started at a rate of approximately 0.2 image·s–1 (each image was an average of 8 frames with 0.08 s exposure). Then the flow cell was flushed with approximately 500 μL of imaging buffer without detergent at a flow rate of 1.5 mL·min–1. Finally, another 500 μL of imaging buffer with detergent was injected into the flow cell while data were continuously acquired. The average fluorescence intensity of the LHCII complexes for each image was calculated as an average from 10 pixels (each pixel belonging to a line of LHCII). The intensity of the same set of pixels was measured for each one of 12 images acquired in a time sequence, and the variation of the average fluorescence intensity was plotted against the time (or consecutive frame number).
Time-Resolved Measurements
For time-resolved measurements, a supercontinuum white light laser, (SC 480-10, Fianium) with a repetition rate of 80 MHz was used as a light source and the excitation light was cleaned up by additional 470/40 nm band-pass filter. The laser beam was focused on the sample surface illuminating a diffraction limited spot. The modulation of the laser was synchronized with a time-correlated single-photon counting (TCSPC) module (SPC-150, Becker & Hickl) for fluorescence lifetime measurements. Fluorescence lifetimes were recorded by parking the focused laser spot over one of the LHCII nanolines and selecting a central wavelength by use of the monochromator. Then the signal from the illuminated spot on the sample surface was sent to a photomultiplier tube (PMT) detector. The secondary slit in front of the PMT allows further spectral narrowing of the measured signal; typically we were able to select ±15 nm around the central wavelength of 680 nm selected by the monochromator. SPCM software (Becker & Hickl) was used for data acquisition, and OriginPro was used for data analysis and fitting. During the time-resolved measurements, the pulse energy was approximately 0.05 pJ, resulting in approximately 14 photons·pulse–1·trimer–1.
Time-Resolved Measurements on Homogeneous LHCII Monolayers
Time-correlated single photon counting measurements were performed by use of a FluoTime 200 ps fluorometer (PicoQuant). Fluorescence lifetime decay kinetics were measured on LHCII monolayers with excitation provided by a 470 nm laser diode at a 10 MHz repetition rate. These settings were carefully chosen to be far below the onset of singlet–singlet exciton annihilation (<0.1 pJ). Fluorescence was detected at 680 nm (isolated LHCII) with a 1 nm slit width. The instrument response function was ∼50 ps.
Results and Discussion
Nanolithography and Self-Assembly of Organosilane Molecules on Oxide Surfaces
The simple lithography process, schematically represented in Figure 1, eliminates the need for high temperature and high pressure during the replication step as well as the residual-layer removal step (breakthrough reactive ion etching) in order to expose the clean substrate under the masking polymer layer (required steps in all NIL variants).43−47 Two different types of master templates were used in this work, one with protruding ridges and one with sunken trenches, produced by a standard electron beam lithographic process onto silicon wafers (see Experimental Section).
Figure 1.

Schematic representation of the lithographic process. The master template (A) is spin-coated (B) with a thin layer of polystyrene (PS), resulting in a sandwich structure where the PS layer replicates the topography of the master (C). The PS layer is then lifted from the master template in a water bath (D) and can be inverted for inspection (E). Then the PS film can be deposited on a clean flat substrate of glass or silicon (F, G), onto which an organosilane SAM is deposited in vapor phase (H). Subsequently, the masking PS layer is lifted off the substrate (I) and the sample is inspected by AFM (J), followed by deposition of a second, contrasting organosilane SAM (K). The resulting chemically nanopatterned surface (L) is used for selective immobilization of light harvesting antenna complexes (M).
After spin-coating (Figure 1B) a thin polystyrene (PS) layer onto either of the master templates (shown in Figure 2A,B), the PS film was floated off in a water bath, (Figure 1D), resulting in a free-standing polymer film with a relief replica of the master template features.
Figure 2.

AFM topographic images of the two different master templates used in this work: ridges with a width of approximately 80 nm (A) and approximately 350 nm wide trenches (B). The corresponding PS replicas for panels A and B after being inverted for inspection by AFM are shown in panels C and D, respectively. Scale bars in all panels represent 2 μm.
Inversion of this film (Figure 1E) exposes the surface previously in contact with the master template for inspection by atomic force microscopy (AFM) (Figure 2C,D). The AFM images in Figure 2 show that the PS films replicate the master template features, resulting in trenches with an average width of 82 nm with a 4 μm period (Figure 2C) or 350 nm wide ridges with a 2 μm period (Figure 2D) depending on the master templates used. The high fidelity of the imprinting procedure replicates the variable width of the channels together with some larger defects (Figure 2C). The free-standing PS film can be transferred (floated on) to a clean flat substrate such as a piranha-cleaned glass coverslip or a silicon (Si) wafer in the same orientation that was released from the master template (Figure 1F). In making contact with the flat substrate (Figure 1G), without any additional steps (e.g., etching), the polymer film leaves exposed regions of the substrate, onto which organosilane self-assembled monolayers (SAMs) can be formed by a chemical vapor deposition (CVD) process (Figure 1H). The sample is placed into a desiccator together with 30 μL of 3-mercaptopropyltrimethoxysilane (MPTMS) and left overnight to allow formation of a SAM on the exposed parts of the substrate (Figure 1H). At this point the masking PS film can be removed from the substrate, again by floating it off, and can be reused for patterning of a fresh substrate up to 5 times without any degradation of the pattern produced. The use of a solventless CVD process is critical, as solvents used in the conventional solution-based SAM deposition would dissolve the masking PS thin film. It is worth noting that the AFM topographic images of the PS replica would give a better representation of the expected geometry of the patterned SAMs compared to the AFM topographic images of the actual master templates. Due to the convolution between the AFM probe shape and the steep walls of the relatively high-aspect ratio template features, the AFM would overestimate the ridge width and would underestimate the trench width at their bases.
The AFM images of the formed SAM patterns (Figure 3A,B) reveal well-defined lines of MPTMS molecules with a height of 6.5 Å (Figure 3C,D), which is close to the theoretical value of the length of the MPTMS molecule of 7.7 Å,48 while the rest of the surface remains clean, as shown by the random pattern of straight lines resulting from the mechanical polishing of the Si wafer, seen in the backgrounds of Figure 3A,B. The widths of 82 and 380 nm of the SAM lines in Figure 3A,B correspond very well to the width of the features on the PS replicas.
Figure 3.

AFM topographic images of patterned MPTMS monolayers on a Si substrate formed with two different PS replica films: MPTMS monolayer with 380 nm gaps in it (A) and 82 nm wide lines of MPTMS (B). The corresponding cross-section profiles along the dashed lines are shown in panels C and D, respectively. Scale bars represent 2 μm.
The substrate can be further converted to a fully chemically patterned surface either in solution or again in a vapor phase (Figure 1K) by assembling a second, contrasting organosilane SAM on the newly exposed (clean) parts of the substrate.
Immobilization of Functional Photosynthetic Antenna Complexes
Photoactive biological systems are typically studied by optical techniques, making opaque substrates such as Si wafers problematic because of their inability to transmit light and their tendency to quench the fluorescence of the sample. Glass is a much more convenient substrate for investigation of biological systems, and for that reason we prepared chemically nanopatterned glass substrates using the method described above. Figure 4A shows an AFM topographic image of 70 nm wide lines of MPTMS formed onto a glass substrate with a height of approximately 7 Å, corresponding to the thickness of a monolayer. Next, a contrasting 1H,1H,2H,2H-perfluorooctyltriethoxysilane (fluorosilane) SAM was assembled in order to fill in the gaps between the MPTMS nanolines. Then a small cross-linker molecule, sulfosuccinimidyl 4-(N-maleimidomethyl)cyclohexane-1-carboxylate (sulfo-SMCC), was used to covalently link the lysine residues of LHCII, which are particularly enriched on the N-terminal (chloroplast stroma-facing) side of the complex, to the sulfhydryl groups of the linear nanopattern (see Experimental Section).The resulting linear protein nanoarrays of LHCII were characterized in situ by AFM and by time-resolved fluorescence microscopy.
Figure 4.

AFM topographic images of 70 nm wide linear patterns on a glass substrate after MPTMS monolayer assembly (A) and after immobilization of the LHCII complexes (B). The inset in panel B shows one of the lines with immobilized LHCII complexes in greater detail. The corresponding cross sections of the MPTMS lines (C) and a line with LHCII attached (D) give heights of about 0.7 and 5.8 nm, respectively. The average width of the lines in both cases is about 70 nm with a narrower part with a width down to 58 nm. The scale bars represent 2 μm.
The AFM topographs revealed that the LHCII proteins are immobilized directly over the MPTMS monolayer with very little nonspecific attachment to the fluorosilane areas of the surfaces. The average height of the protein lines was approximately 5.8 nm, in good agreement with the 6 nm height of the LHCII trimers.15,16 The average width of the protein lines is approximately 70 nm with a line width down to 58 nm at full width at half-maximum (fwhm) measured across the straight defect-free parts of the linear pattern (Figure 4B,D). The AFM data also suggest very close packing of the LHCII trimers in the linear arrays since the height of the lines is very uniform with no observable gaps or interruptions.
In order to confirm the localization and the preserved functionality of the LHCII complexes attached along the nanopatterned lines, the samples were characterized in a home-built fluorescence microscope capable of spectral and time-resolved data acquisition. The ability of LHCII to switch between highly and weakly fluorescent states allows control of energy transfer to the RCs where photochemistry takes place. It has been shown that this switching can be replicated with bulk LHCII complexes in vitro by manipulating detergent concentration and pH.18−21 We were able to observe reversible changes in the fluorescent emission of the immobilized LHCII complexes in real time by mounting the sample with the nanopatterned LHCII in a home-built flow cell (see Experimental Section) and acquiring time-lapsed fluorescence data, shown in Figure 5, while varying the concentration of n-dodecyl β-d-maltoside (β-DDM) detergent in the imaging buffer (as described in the Experimental Section). The emission intensity of the LHCII nanolines in the presence of β-DDM detergent (Figure 5D, maroon trace) is approximately 2.9 times higher compared to the emission intensity of the LHCII nanoline in the absence of β-DDM (Figure 5D, green trace). The fwhm of the peaks in both cases is approximately 265 nm (diffraction-limited). Figure 5E shows the variation of average intensity from the LHCII complexes depending on the detergent concentration (with time) in the imaging buffer.
Figure 5.

LHCII linear nanopattern on a glass substrate imaged in the presence of (A, C) 0.03% β-DDM and (B) in its absence. The corresponding intensity profiles, in panel D, were obtained along the dashed lines in panels A and B. The images were acquired at the same camera settings and are represented with identical brightness and contrast settings. (E) Average fluorescence intensity dependence on time while detergent concentration was varied with time. The time intervals when detergent was present (I and III) or absent (II) in the flow cell are shown in green and pink, respectively. Error bars represent the standard deviation from the average of 10 data points.
When detergent-containing buffer was flushed out of the flow cell and replaced by detergent-free buffer, a significant, ∼3-fold drop decrease (from 1300 to approximately 400 au) of the average fluorescence intensity of the LHCII complexes was observed. When the detergent concentration in the imaging buffer was restored, the average fluorescence intensity increased to approximately 1200 au. It is worth noting that the bright and dark regions along the lines of LHCII, clearly visible in the fluorescence images, are the consequence of the nonuniform width of the LHCII lines: the wider part of the lines appear brighter due to the larger number of light-emitting LHCII molecules “per unit length” of the nanoline.
In order to further investigate the transition between the highly fluorescent and the weakly fluorescent state of the immobilized molecules, we recorded the emission spectra and the fluorescence lifetime of 70 nm lines of LHCII complexes either in the presence of 0.03% β-DDM detergent or in its absence. Figure 6A shows fluorescence image acquired on a sample of LHCII immobilized on nanopatterned glass substrate with line widths of approximately 70 nm. A region of interest (ROI) on the sample was defined by closing the entrance slit on the monochromator and binning the CCD detector rows accordingly (Figure 6A). The signal was sent from the defined ROI to a diffraction grating within the monochromator and spread around a chosen central wavelength onto the CCD detector, thus allowing the acquisition of an emission spectrum (Figure 6D).
Figure 6.

LHCII linear nanopattern on a glass substrate, with an intensity scale bar (A) and the in situ emission spectra acquired over two different regions of interest; the emission spectrum for LHCII complexes in solution is also included as a control (dashed line) (B). Fluorescence lifetime decay curves were measured for nanopatterned LHCII complexes (C), in the presence of detergent (orange data) and in its absence (dark cyan data), and for a complete monolayer of LHCII (D), in the presence of detergent (maroon data) and in its absence (cyan data), respectively. The instrument response functions (IRF) are shown in gray for both measurements.
The spectrum acquired over one of the 70 nm lines has a maximum at 682 nm and also displays a shoulder at around 730 nm, consistent with the spectrum of LHCII in aqueous solution (shown for comparison in Figure 6B). In addition, 470 nm excitation light predominantly excites chlorophyll b and carotenoids (chlorophyll a absorbance maximum is at 430 nm), while the observed fluorescence emission maximum is at 682 nm (chlorophyll a emission), which is evidence for internal energy transfer from chlorophyll b to chlorophyll a. This is a clear indicator that immobilizing LHCII complexes on the substrate preserves their structural and functional integrity. The emission spectrum of a control ROI, defined within the gap between two LHCII lines, showed only the background baseline with no prominent peaks.
Figure 6C shows fluorescence lifetime decays recorded over one of the LHCII lines in imaging buffer supplied with detergent (0.03% β-DDM; orange data), and in imaging buffer without detergent (dark cyan data). The best fit of the decay curves recorded in the presence of detergent identified two exponential components with lifetimes of 3.2 ns (64%) and 0.52 ns (36%), giving an average (amplitude-weighted) lifetime of approximately 2.24 ns. The absence of detergent resulted in much faster fluorescence decay with an average (amplitude-weighted) lifetime of approximately 0.4 ns (99% for the 0.38 ns component and 1.1% for the 2.1 ns component). This dramatic reduction of the lifetime is consistent with previous studies, which indicated that detergent removal shifts the equilibrium between the number of strong and weak emitters, leading to a decrease in the fluorescence emission and fluorescence lifetime of the population of LHCII complexes.18−21 Monolayers of LHCII complexes, prepared by protein immobilization onto nonpatterned MPTMS SAMs (on glass surfaces), were used for comparative fluorescence lifetime measurements (again with and without detergent present in the buffer) in a commercial instrument (Figure 6D). The best fit of the data gave average (amplitude-weighted) lifetime values of approximately 2.23 ns in the presence of detergent and 0.35 ns for the quenched state (no detergent present), which are in very good agreement with the values obtained for the nanopatterned LHCII samples. In summary, both the internal energy transfer from chlorophyll b to chlorophyll a and the capacity of the LHCII complex to reversibly switch between highly and weakly fluorescent states have been retained following nanopatterning and immobilization on the glass substrate. Given that the LHCII complexes are covalently attached, and therefore immobilized, to the glass substrate,we can discount the possibility that this switchable quenching behavior is a consequence of altering the aggregation state of the complexes.
Simultaneous Immobilization of Two Photoactive Proteins
Integration of the LHCII into biohybrid light-harvesting constructs requires retention of the ability of these antenna complexes to transfer absorbed excitation energy to their neighbors and, most importantly, to photochemical RCs. This, in turn, requires patterned multicomponent LHC-RC nanoarrays.
In order to demonstrate the versatility of the nanopatterning method proposed here and its usefulness in sorting and controlling the nanoscale positioning of two different proteins, we simultaneously immobilized two different photoactive proteins, LHCII and an enhanced green fluorescent protein (EGFP), onto a chemically patterned glass surface. Only a few patterning methods, mainly based on the click-chemistry approach, are suitable for the realization of multicomponent patterns.49−51To fabricate the two-protein samples, the nanopatterned glass surfaces were prepared in a slightly different way: a PS replica with 350–380 nm wide trenches (Figure 2D), produced with the master template in Figure 2B, was used to pattern either fluorosilane or 3-aminopropyltriethoxysilane (APTES) SAMs during the first functionalization step (Figure 1H). In the second CVD step (Figure 1K), these patterns were complemented with a MPTMS monolayer, resulting in alternating linear arrays of either fluorinated (broad) lines and sulfhydryl (narrow) lines or amine (broad) lines and sulfhydryl (narrow) lines. Then the nanopatterned surfaces were incubated with sulfosuccinimidyl 4-(N-maleimidomethyl)cyclohexane-1-carboxylate (sulfo-SMCC) for 40 min at pH 7.4. This additional functionalization step converts the sulfhydryl groups into active N-hydroxysuccinimide ester (NHS ester) groups and, on the second type of sample, simultaneously converts the amine functional groups to maleimide groups. Both maleimide–sulfhydryl and NHS ester–amine reactions are well understood and have attractive characteristics such as high selectivity, high yield, fast reaction in aqueous phase at room temperature, and biocompatibility.52 Moreover, the two reactions are highly orthogonal to each other and can be carried out simultaneously with a minimum amount of nonspecific immobilization. In the last step, the first type of nanopatterned glass surface was incubated with LHCII solution (see Experimental Section) in order to produce LHCII-only nanopattern; the second type of patterned surface was incubated with a mixed solution of LHCII and N-succinimidyl S-acetylthiopropionate (SATP) -functionalized EGFP (see Experimental Section) in order to produce a mixed LHCII/EGFP nanopattern.
Figure 7 panels A and B show fluorescence images acquired on LHCII-only and mixed LHCII/EGFP samples, respectively. The results clearly show that the bifunctionalized nanopatterned surface sorted the mixture of two proteins according to their functional groups: the LHCII complexes with available lysine residues bound predominantly to the NHS ester regions on the surface, while the SATP-functionalized EGFP bound predominantly to the maleimide regions. The selectivity of the surface immobilization was confirmed by fluorescence spectroscopy (Figure 7C). Emission spectra recorded over the LHCII and EGFP domains of the patterns confirmed the site specificity of the immobilization process and show that this method for patterning two types of protein has further potential. One application includes fabricating combinations of antenna and RCs for investigating energy migration and trapping in novel 2D arrangements not found in native or engineered photosynthetic organisms.
Figure 7.
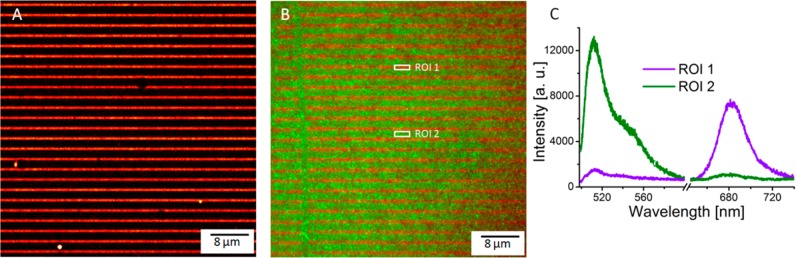
Fluorescence image of LHCII-only linear pattern (A) and of mixed LHCII (red)/EGFP (green) linear pattern (B). The emission spectra (C), recorded over the two different regions of interest marked in panel B, show predominantly LHCII emission for region 1 and EGFP emission for region 2.
Conclusion
In conclusion, LHCII was successfully immobilized onto a chemically patterned glass surface. Site-specific immobilization was confirmed by fluorescence emission spectroscopy, and detergent-induced switching between fluorescent and quenched states verified the functionality of these immobilized antenna complexes. In addition a second protein, EGFP, was immobilized onto LHCII-free areas of the chemically patterned surfaces by very simple surface chemistry that allows simultaneous selective immobilization and therefore sorting of the two types of protein molecules on the surface. During the one-pot functionalization, both surface groups recognized their respective functionalities on the different protein molecules, and thus the surface was selectively tagged by the proteins according to the predesigned chemical pattern.
Acknowledgments
C.V. and C.N.H. gratefully acknowledge support from the BBSRC (U.K.), and M.P.J. was supported by a fellowship from the Leverhulme Trust, the Krebs Institute at the University of Sheffield, and Project Sunshine, University of Sheffield. This work was also supported as part of the Photosynthetic Antenna Research Center (PARC), an Energy Frontier Research Center funded by the U.S. Department of Energy, Office of Science, Office of Basic Energy Sciences under Award DE-SC 0001035. PARC’s role was to fund L.W. and the fabrication of the master templates by E.G. and G.M.
The authors declare no competing financial interest.
References
- Frolov L.; Rosenwaks Y.; Carmeli C.; Carmeli I. Fabrication of photo-electronic device by direct chemical binding of the photosynthetic reaction center protein to metal surfaces. Adv. Mater. 2005, 17, 2434–2437. [Google Scholar]
- Tan S. C.; Crouch L. I.; Mahajan S.; Jones M. R.; Welland M. E. Tuning the open circuit voltage of photoprotein-based photoelectrochemical cells by manipulation of the vacuum potential of the electrolyte. ACS Nano 2012, 6, 9103–9109. [DOI] [PubMed] [Google Scholar]
- Gerster D.; Reichert J.; Bi H.; Barth J. V.; Kaniber S. M.; Holleitner A. W.; Visoly-Fisher I.; Sergani S.; Carmeli I. Photocurrent of a single photosynthetic protein. Nat. Nanotechnol. 2012, 7, 673–676. [DOI] [PubMed] [Google Scholar]
- Das R.; Kiley P. J.; Segal M.; Norville J.; Yu A. A.; Wang L.; Trammell S.; Reddick L. E.; Kumar R.; Zhang S.; Stellacci F.; Lebedev N.; Schnur J.; Bruce B. D.; Baldo M. A. Solid state integration of photosynthetic protein molecular complexes. Nano Lett. 2004, 4, 1079–1083. [Google Scholar]
- Nagata M.; Amano M.; Joke T.; Fuji K.; Okuda A.; Kondo M.; Ishigure S.; Dewa T.; Iida K.; Secundo F.; Amao Y.; Hashimoto H.; Nango M. Immobilization and photocurrent activity of a light-harvesting antenna complex II, LHCII, isolated from a plant on electrodes. ACS Macro Lett. 2012, 1, 296–299. [DOI] [PubMed] [Google Scholar]
- Liu J.; Lauterbach R.; Paulsen H.; Knoll W. Immobilization of light-harvesting chlorophyll a/b complex (LHCIIb) studied by surface plasmon field-enhanced fluorescence spectroscopy. Langmuir 2008, 24, 9661–9667. [DOI] [PubMed] [Google Scholar]
- Lauterbach R.; Liu J.; Knoll W.; Paulsen H. Energy Transfer between surface-immobilized light-harvesting chlorophyll a/b complex (LHCII) studied by surface plasmon field-enhanced fluorescence spectroscopy (SPFS). Langmuir 2010, 262217315–17321. [DOI] [PubMed] [Google Scholar]
- Reynolds N. P.; Janusz S.; Escalante-Marun M.; Timney J.; Ducker R. E.; Olsen J. D.; Otto C.; Subramaniam V.; Leggett G. J.; Hunter C. N. Directed formation of micro- and nanoscale patterns of functional light-harvesting LH2 complexes. J. Am. Chem. Soc. 2007, 129, 14625–14631. [DOI] [PubMed] [Google Scholar]
- Escalante M.; Maury P.; Bruinink C. M.; van der Werf K.; Olsen J. D.; Timney J. A.; Huskens J.; Hunter C. N.; Subramaniam V.; Otto C. Directed assembly of functional light harvesting antenna complexes onto chemically patterned surfaces. Nanotechnology 2008, 192025101. [DOI] [PubMed] [Google Scholar]
- Escalante M.; Zhao Y.; Ludden M. J. W.; Vermeij R.; Olsen J. D.; Berenschot E.; Hunter C. N.; Huskens J.; Subramaniam V.; Otto C. Nanometer arrays of functional light harvesting antenna complexes by nanoimprint lithography and host-guest interactions. J. Am. Chem. Soc. 2008, 130, 8892–8893. [DOI] [PubMed] [Google Scholar]
- Falconnet D.; Pasqui D.; Park S.; Eckert R.; Schift H.; Gobrecht J.; Barbucci R.; Textor M. A novel approach to produce protein nanopatterns by combining nanoimprint lithography and molecular self-assembly. Nano Lett. 2004, 4101909–1914. [Google Scholar]
- Escalante M.; Lenferink A.; Zhao Y.; Tas N.; Huskens J.; Hunter C. N.; Subramaniam V.; Otto C. Long-range energy propagation in nanometer arrays of light harvesting antenna complexes. Nano Lett. 2010, 10, 1450–1457. [DOI] [PubMed] [Google Scholar]
- Magis G. J.; den Hollander M. J.; Onderwaater W. G.; Olsen J. D.; Hunter C. N.; Aartsma T. J.; Frese R. N. Light harvesting, energy transfer and electron cycling of a native photosynthetic membrane adsorbed onto a gold surface. Biochim. Biophys. Acta 2010, 1798, 637–645. [DOI] [PubMed] [Google Scholar]
- Magis G. J.; Olsen J. D.; Reynolds N. P.; Leggett G. J.; Hunter C. N.; Aartsma T. J.; Frese R. N. Use of engineered unique cysteine residues to facilitate oriented coupling of proteins directly to a gold substrate. Photochem. Photobiol. 2011, 87, 1050–1057. [DOI] [PubMed] [Google Scholar]
- Liu Z.; Yan H.; Wang K.; Kuang T.; Zhang J.; Gul L.; An X.; Chang W. Crystal structure of spinach major light-harvesting complex at 2.72 Å resolution. Nature 2004, 428, 287–292. [DOI] [PubMed] [Google Scholar]
- Standfuss J.; Terwisscha van Scheltinga A. C.; Lamborghini M.; Kuhlbrandt W. Mechanisms of photoprotection and nonphotochemical quenching in pea light-harvesting complex at 2.5 Å resolution. EMBO J. 2005, 24, 919–928. [DOI] [PMC free article] [PubMed] [Google Scholar]
- Andreasson E.; Albertsson P.-A. Heterogeneity in photosystem I: The larger antenna of photosystem Iα is due to functional connection to a special pool of LHCII. Biochim. Biophys. Acta 1993, 1141, 175–182. [Google Scholar]
- Ilioaia C.; Johnson M. P.; Horton P.; Ruban A. V. Induction of efficient energy dissipation in the isolated light-harvesting complex of photosystem II in the absence of protein aggregation. J. Biol. Chem. 2008, 283, 29505–29512. [DOI] [PMC free article] [PubMed] [Google Scholar]
- Johnson M. P.; Ruban A. V. Photoprotective energy dissipation in higher plants involves alteration of the excited state energy of the emitting chlorophyll(s) in the light harvesting antenna II (LHCII). J. Biol. Chem. 2009, 284, 23592–23601. [DOI] [PMC free article] [PubMed] [Google Scholar]
- Kruger T. P. J.; Ilioaia C.; Johnson M. P.; Ruban A. V.; Papagiannakis E.; Horton P.; van Grondelle R. Controlled disorder in plant light-harvesting complex II explains its photoprotective role. Biophys. J. 2012, 102, 2669–2676. [DOI] [PMC free article] [PubMed] [Google Scholar]
- Kruger T. P. J.; Novoderezhkin V. I.; Ilioaia C.; van Grondelle R. Fluorescence spectral dynamics of single LHCII trimers. Biophys. J. 2010, 98, 3093–3101. [DOI] [PMC free article] [PubMed] [Google Scholar]
- Vasil’ev S.; Irrgang K.-D.; Schrotter T.; Bergmann A.; Eichler H.-J.; Renger G. Quenching of chlorophyll a fluorescence in the aggregates of LHCII: Steady state fluorescence and picosecond relaxation kinetics. Biochemistry 1997, 36247503–7512. [DOI] [PubMed] [Google Scholar]
- Kirchhoff H.; Hinz H.-J.; Rosgen J. Aggregation and fluorescence quenching of chlorophyll a of the light-harvesting complex II from spinach in vitro. Biochim. Biophys. Acta, Bioenerg. 2003, 1606, 105–116. [DOI] [PubMed] [Google Scholar]
- Jennings R. C.; Garlaschi F. M.; Zucchelli G. Light-induced fluorescence quenching in the light harvesting chlorophyll a/b protein complex. Photosynth. Res. 1991, 27157–64. [DOI] [PubMed] [Google Scholar]
- Grudziński W.; Krupa Z.; Garstka M.; Maksymiec W.; Swartz T. E.; Gruszecki W. I. Conformational rearrangements in light-harvesting complex II accompanying light-induced chlorophyll a fluorescence quenching. Biochim. Biophys. Acta, Bioenerg. 2002, 1554, 108–117. [DOI] [PubMed] [Google Scholar]
- Ruban A. V.; Johnson M. P.; Duffy C. D. P. The photoprotective molecular switch in the photosystem II antenna. Biochim. Biophys. Acta 2012, 1817, 167–181. [DOI] [PubMed] [Google Scholar]
- Yan H.; Zhang P.; Wang C.; Liu Z.; Chang W. Two lutein molecules in LHCII have different conformations and functions: Insights into the molecular mechanism of thermal dissipation in plants. Biochem. Biophys. Res. Commun. 2007, 3552457–463. [DOI] [PubMed] [Google Scholar]
- Cogdell R. J. The structural basis of non-photochemical quenching is revealed?. Trends Plant Sci. 2006, 11259–60. [DOI] [PubMed] [Google Scholar]
- Miloslavina Y.; Wehner A.; Lambrev P. H.; Wientjes E.; Reus M.; Garab G.; Croce R.; Holzwarth A. R. Far-red fluorescence: A direct spectroscopic marker for LHCII oligomer formation in nonphotochemical quenching. FEBS Lett. 2008, 582, 3625–3631. [DOI] [PubMed] [Google Scholar]
- Bode S.; Quentmeier C. C.; Liao P.-N.; Hafi N.; Barros T.; Wilk L.; Bittner F.; Walla P. J. On the regulation of photosynthesis by excitonic interactions between carotenoids and chlorophylls. Proc. Natl. Acad. Sci. U.S.A. 2000, 1063012311–12316. [DOI] [PMC free article] [PubMed] [Google Scholar]
- Chou S. Y.; Krauss P. R.; Renstrom P. J. Imprint of sub-25 nm vias and trenches in polymers. Appl. Phys. Lett. 1995, 67, 3114. [Google Scholar]
- Chou S. Y.; Krauss P. R.; Renstrom P. J. Imprint lithography with 25-nanometer resolution. Science 1996, 272, 85–87. [Google Scholar]
- Chou S. Y.; Krauss P. R.; Renstrom P. J. Nanoimprint lithography. J. Vac. Sci. Technol. B 1996, 14, 4129. [Google Scholar]
- Chou S. Y.; Krauss P. R. Imprint lithography with sub-10 nm feature size and high throughput. Microelectron. Eng. 1997, 35, 237–240. [Google Scholar]
- Li M.; Wang J.; Zhuang L.; Chou S. Y. Fabrication of circular optical structures with a 20 nm minimum feature size using nanoimprint lithography. Appl. Phys. Lett. 2000, 76, 673. [Google Scholar]
- Ahn S.-W.; Lee K.-D.; Kim J.-S.; Kim S. H.; Park J.-D.; Lee S.-H.; Yoon P.-W. Fabrication of a 50 nm half-pitch wire grid polarizer using nanoimprint lithography. Nanotechnology 2005, 16, 1874. [Google Scholar]
- Austin M. D.; Ge H.; Wu W.; Li M.; Yu Z.; Wasserman D.; Lyon S. A.; Chou S. Y. Fabrication of 5 nm linewidth and 14 nm pitch features by nanoimprint lithography. Appl. Phys. Lett. 2004, 84265299–5301. [Google Scholar]
- Guo L. J. Recent progress in nanoimprint technology and its applications. J. Phys. D: Appl. Phys. 2004, 37, R123–R141. [Google Scholar]
- George A.; Blank D. H. A.; ten Elshof J. E. Nanopatterning from the gas phase: high resolution soft lithographic patterning of organosilane thin films. Langmuir 2009, 252313298–13301. [DOI] [PubMed] [Google Scholar]
- Ruban A. V.; Young A.; Pascal A.; Horton P. The effects of illumination on the xanthophyll composition of the photosystem II light-harvesting complexes of spinach thylakoid membranes. Plant Physiol. 1994, 104, 227–234. [DOI] [PMC free article] [PubMed] [Google Scholar]
- Kruger T. P. J.; Ilioaia C.; Johnson M. P.; Ruban A. V.; van Grondelle R. Disentangling the low-energy states of the major light-harvesting complex of plants and their role in photoprotection. Biochim. Biophys. Acta, Bioenerg. 2014, 1837, 1027–1038. [DOI] [PubMed] [Google Scholar]
- Kremers G.-J.; van Muunster E. B.; Goedhart J.; Gadella T. W. J. Quantitative lifetime unmixing of multiexponentially decaying fluorophores using single-frequency fluorescence lifetime imaging microscopy. Biophys. J. 2007, 46, 3775–3783. [DOI] [PMC free article] [PubMed] [Google Scholar]
- Plachetka U.; Bender M.; Fuchs A.; Vratzov B.; Glinsner T.; Lindner F.; Kurz H. Wafer scale patterning by soft UV-nanoimprint lithography. Microelectron. Eng. 2004, 73–74, 167–171. [Google Scholar]
- Kehagias N.; Reboud V.; Chansin G.; Zelsmann M.; Jeppesen C.; Schuster C.; Kubenz M.; Reuther F.; Gruetzner G.; Sotomayor Torres C. M. Reverse-contact UV nanoimprint lithography for multilayered structure fabrication. Nanotechnology 2007, 18, 175303. [Google Scholar]
- Bender M.; Fuchs A.; Plachetka U.; Kurz H. Status and prospects of UV-nanoimprint technology. Microelectron. Eng. 2006, 83, 827–830. [Google Scholar]
- McMackin I.; Choi J.; Schumaker P.; Nguyen V.; Xu F.; Thompson E.; Babbs D.; Sreenivasan S. V.; Watts M.; Schumaker N. Step and repeat UV nanoimprint lithography tools and processes. Proc. SPIE 2004, 5374. [Google Scholar]
- Truskett V. N.; Watts M. P. C. Trends in imprint lithography for biological applications. Trends Biotechnol. 2006, 247312–317. [DOI] [PubMed] [Google Scholar]
- Aswal D. K.; Lenfant S.; Guerin D.; Yakhmi J. V.; Vuillaume D. A tunnel current in self-assembled monolayers of 3-mercaptopropyltrimethoxysilane. Small 2005, 17725–729. [DOI] [PubMed] [Google Scholar]
- Ganesan R.; Kratz K.; Lendlein A. Multicomponent protein patterning of material. J. Mater. Chem. 2010, 20, 7322–7331. [Google Scholar]
- Broyer R. M.; Schopf E.; Kolodziej C. M.; Chen Y.; Maynard H. D. Dual click reactions to micropattern proteins. Soft Matter 2011, 7, 9972–9977. [Google Scholar]
- Tolstyka Z. P.; Richardson W.; Bat E.; Stevens C. J.; Parra D. P.; Dozier J. K.; Distefano M. D.; Dunn B.; Maynard H. D. Chemoselective immobilization of proteins by microcontact printing and bioorthogonal click reactions. ChemBioChem. 2013, 14, 2464–2471. [DOI] [PMC free article] [PubMed] [Google Scholar]
- Hermanson G. T.Bioconjugate Techniques, 3rd ed.; Academic Press: San Diego, CA, 2013; pp 233–241. [Google Scholar]