

Abstract

The atomic-scale mechanisms underlying the growth of Ag on the (√2×√2)R45°-Fe3O4(001) surface were studied using scanning tunneling microscopy and density functional theory based calculations. For coverages up to 0.5 ML, Ag adatoms populate the surface exclusively; agglomeration into nanoparticles occurs only with the lifting of the reconstruction at 720 K. Above 0.5 ML, Ag clusters nucleate spontaneously and grow at the expense of the surrounding material with mild annealing. This unusual behavior results from a kinetic barrier associated with the (√2×√2)R45° reconstruction, which prevents adatoms from transitioning to the thermodynamically favorable 3D phase. The barrier is identified as the large separation between stable adsorption sites, which prevents homogeneous cluster nucleation and the instability of the Ag dimer against decay to two adatoms. Since the system is dominated by kinetics as long as the (√2×√2)R45° reconstruction exists, the growth is not well described by the traditional growth modes. It can be understood, however, as the result of supersaturation within an adsorption template system.
Keywords: metal adatoms, nanoparticle growth, adsorption template, metal oxide surface, Fe3O4, magnetite
Adsorption templates are increasingly utilized to investigate fundamental processes at surfaces because they offer a stable, well-defined initial state from which the evolution of a system can be studied and the influence of external stimuli determined. To date, moiré lattices,1−3 surface reconstructions,4 and ordered point defects5−7 have been found to provide the necessary combination of nucleation sites and corrugated surface potential to stabilize monodisperse metal clusters at elevated temperatures. Such systems are promising for studies of heterogeneous catalysis, for example, since the ability to tune the size of the clusters is ideal for studies of the size effect.
The adsorption template provided by the (√2×√2)R45°-Fe3O4(001) surface is unique in that the reconstruction stabilizes single Au adatoms to unprecedented temperatures (as high as 673 K).8 As such, this model system is potentially ideal to probe the mechanisms underlying single-atom catalysis under reaction conditions.9−13 However, while Au adatoms are stable thermally, the coverage is limited to 0.17 ML by the onset of cluster nucleation. In this study, we turn our attention to the adsorption of Ag on the Fe3O4(001) surface. This choice was motivated by our desire to further establish the universality of the adatom template for the transition metals, to discover whether adatom coverages in excess of 0.17 ML could be achieved, and by reports of highly active subnano Ag clusters in the literature.14
In addition to studies of catalytic activity, the adatom template system also offers an ideal basis for fundamental studies of cluster nucleation and growth, a long-standing topic of fundamental research that underpins vital technologies such as microelectronics and heterogeneous catalysis. Volmer–Weber growth (V–W, 3D crystallites) dominates in such systems since the surface energies of metal oxides are often lower than those of metals,15,16 but Stranski–Krastanov (S–K) growth, in which 3D crystallites coexist with a stable wetting layer, occurs in systems with strong adatom–substrate interactions. In this paper, we use scanning tunneling microscopy and density functional theory based calculations to study the atomistic details of Ag growth at the Fe3O4(001) surface. While the thermodynamic preference is for 3D crystallites, as shown previously,17 our results show that the (√2×√2)R45° reconstruction strongly influences the growth kinetics and that a near complete layer of adatoms can be stabilized at room temperature. This unusual behavior stems from the large distance between stable adsorption sites and the relative instability of the Ag dimer, which decays into two adatoms on formation. Since kinetics dominate over thermodynamics below 720 K, the system is not well described by the traditional growth modes. We propose an alternative description in which the surface is treated as an adsorption template and cluster nucleation results from supersaturation effects.
Results
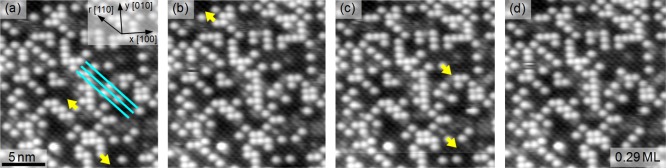
The STM images presented in Figure 1 provide an overview of the Fe3O4(001) surface following the deposition of Ag at room temperature. The Fe3O4(001) substrate is characterized by rows of protrusions running in the ⟨110⟩ directions, which correspond to the rows of surface Fe atoms in Figure 2a.18−21 The Fe row direction, indicated by the cyan lines in Figure 1a, rotates by 90° from one terrace to the next as a consequence of the inverse spinel structure. At the lowest Ag coverage (Figure 1a,d; 0.33 ML) Ag adatoms (yellow arrow) are observed at equivalent sites within the R45° unit cell. Note that 1 ML is defined as one adatom per Fe3O4(001)-(√2×√2)R45° unit cell (1.42 × 10¹⁸ atoms/m2). The adatoms are statistically distributed and show no preference for step edges or other defect sites. No clusters are observed. DFT calculations reveal that the preferred adsorption site is identical to that observed previously for Au8 and Pd22 adatoms, i.e., 2-fold coordinated to surface oxygen atoms, protruding ∼0.2 nm above the surface plane. The Ag adatoms are strongly bound (1.44 eV) and possess a charge state of +1. Figure 2a shows a perspective view of the optimized structure. Calculations of a Ag dimer find two similarly stable configurations, flat and upright (see Figure 2b,c and Table 1). In both configurations the bond length to the surface oxygen atom is larger than for a Ag adatom. In the flat case, both Ag atoms have a charge state of +1, as the single adatom. In the upright case, however, we estimate the atom with no direct contact with the surface is neutral, while the other has a charge state of approximately ∼+0.5. Crucially, the dimer is less stable than two adsorbed adatoms, consistent with the lack of features attributable to Ag dimers in the experimental images at any coverage.
Figure 1.

STM images of three different coverages of Ag/Fe3O4(001) deposited at room temperature. (a, d) 0.33 ML of Ag (Usample = +1.3 V, It = 0.3 nA): stable adatoms (one highlighted by the arrow). The Fe rows of the Fe3O4(001) substrate run along the ⟨110⟩ directions (cyan lines). The red box highlights a surface hydroxyl group, a common defect that occurs via dissociative adsorption of water in oxygen vacancies.23 (b, e) 0.58 ML of Ag (Usample = +1.2 V, It = 0.3 nA): high adatom coverage and a few small clusters. (c, f) 1.45 ML Ag (Usample = +1.2 V, It = 0.3 nA): full adatom layer, clusters at step edges and on terraces.
Figure 2.

Structural models of the adsorption geometry of Ag/Fe3O4(001) as determined by DFT+U calculations: (a) Perspective view of a Ag adatom bound to surface oxygen in an adsorption site between the Fe rows. (b) Perspective view of an upright Ag dimer bonding to surface oxygen with one Ag atom. (c) Top view of a flat Ag dimer aligned with the Fe rows; both Ag atoms bind to the surface.
Table 1. Calculated DFT+U Binding Energies (in eV) per Atom (compared to a free Ag atom) and Bond Distances of the Ag Atoms to the Surface Oxygen (Ag–O) and to the Second Ag Atom of the Dimer (Ag–Ag) for the Stable Configurations of Ag Monomers and Dimers at the Fe3O4(001) Surface.
| configuration | EB/atom [eV] | Ag–O bond length [Å] | Ag–Ag bond length [Å] |
|---|---|---|---|
| free Ag dimer | 0.91 | 2.55 | |
| Fe3O4/Ag single atom | 1.44 | 2.07 | |
| Fe3O4/Ag dimer flat | 1.21 | 2.40 | 2.72 |
| Fe3O4/Ag dimer upright | 1.25 | 2.30 | 2.60 |
When the Ag adatom coverage is increased to 0.58 ML, clusters are observed with a density of 0.75 × 10¹⁶ m–2 (Figure 1b,e). The smallest clusters have an apparent height of ∼0.2 nm with respect to the Fe rows irrespective of bias voltage, which suggests that they may be 2D. While the excellent lattice match between Ag(001) and Fe3O4(001), differing by just 2.7%,17 would be conducive to epitaxial growth, it is important to note that STM apparent heights contain contributions from electronic structure in addition to topography and, thus, may not reflect the true height of the cluster. At 1.45 ML Ag (Figure 1c,f), the adatom density approaches one adatom per (√2×√2)R45° unit cell, and the cluster density increases to 2.7 × 10¹⁶ m–2. The largest clusters observed at this coverage exhibit an apparent height of ∼0.8 nm and are certainly 3D.
An STM movie comprising 67 sequential frames acquired following deposition of 0.29 ML Ag is available as part of the Supporting Information. On average, three adatoms change site per frame, with the vast majority of hops occurring between neighboring stable sites along the Fe row direction. An analysis of the cross row adatom hopping reveals a strong preference for the fast scanning direction of the STM ([100] compared to the crystallographically equivalent [010] direction), suggesting that this is likely tip induced. Surface hydroxyl groups do not appear to affect the mobility of the Ag adatoms, in contrast to Pd adatoms, which are stabilized on Fe3O4(001)22 and TiO2(110).24 During the acquisition of the movie, the system was exposed to 10–8 mbar CO (frame 11 to 48) and 10–8 mbar CO2 (frame 49 to 67), which had no discernible effect on the hopping rate. This is in stark contrast to Pd adatoms, which form highly mobile Pd carbonyl species on CO exposure.22Figure 3 shows four sequential STM images taken from the movie, in which the adatom mobility is indicated. Hopping atoms are indicated by yellow arrows, and the local Fe row direction is again indicated by the cyan lines.
Figure 3.
STM image sequence (Usample = +1.2 V, It = 0.4 nA) illustrating the room-temperature mobility of the Ag adatoms. The cyan lines indicate the Fe row direction; the yellow arrows, the direction of motion of the moving adatom. In this sequence, only movement along the Fe rows is observed.
Figure 4 shows STM images acquired following deposition of 0.51 ML Ag, the lowest coverage for which Ag clusters were observed (cluster density ∼0.15 × 10¹⁶ m–2). At this coverage the adatom distribution is extremely inhomogeneous; in some regions it is close to 1 ML, e.g., the area encompassed by the yellow line, while other areas are almost completely empty. The number of consecutive sites occupied along a particular row can be as high as 14, e.g., in the area enclosed by the red line. The observed clusters have apparent heights that vary from ∼0.2 to 0.5 nm with respect to the Fe rows.
Figure 4.
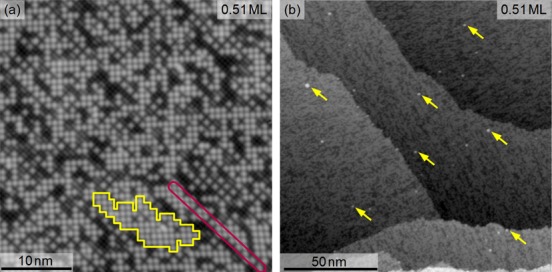
STM images (Usample = +1.2 V, It = 0.3 nA) of 0.51 ML Ag/Fe3O4(001) deposited at room temperature. (a) High-resolution image showing inhomogeneously distributed adatoms. The region encompassed by the yellow line has a local Ag coverage close to 1 ML. The purple line encloses a single row in which 14 consecutive adsorption sites are occupied by Ag adatoms. (b) Large-area scan showing the presence of a low density of clusters (∼0.15 × 10¹⁶ m–2, examples highlighted by yellow arrows).
In Figure 5 we plot the results of a thermal stability study conducted on samples with initial Ag coverages of 0.2 and 1.45 ML. In the plot, the average density of adatoms counted in STM images is shown as a function of annealing temperature. For an initial coverage of 0.2 ML, the adatom density remains constant up to 670 K, but drops quickly to zero by 820 K. This is a clear indication that, at least up to 670 K, cluster nucleation is not thermally induced. As the initial coverage increases, the decrease in adatom coverage shifts to 520 and 370 K for 0.58 and 1.45 ML, respectively. Thus, a somewhat paradoxical situation arises whereby an initially lower adatom coverage leads to a higher adatom coverage between 520 and 800 K. This suggests that clusters affect the stability of the adatom layer.
Figure 5.
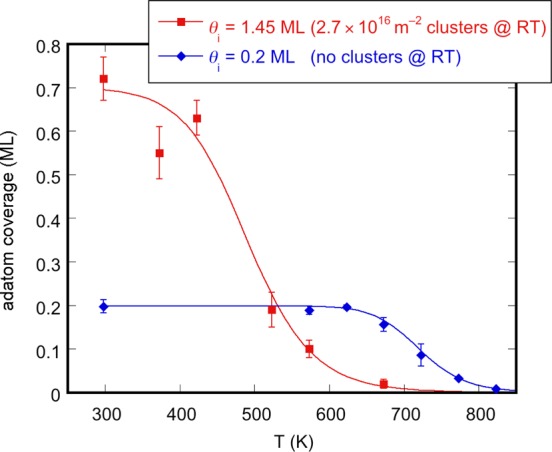
Thermal stability of Ag adatoms for different initial coverages (and cluster densities). The error bars are given by the standard deviation. The solid lines are intended as a guide to the eye only. In the absence of clusters (0.2 ML), Ag adatoms remain stable up to 670 K, at which point clusters nucleate and the adatom coverage drops quickly to zero. At the high initial coverage, the cluster nuclei are already present on the surface at room temperature. During annealing they grow through the capture of the otherwise stable Ag adatoms beginning at 370 K.
In Figure 6 we show two representative images acquired following the annealing experiments described above. Figure 6a shows the 1.45 ML Ag/Fe3O4(001) surface annealed at 370 K. At this temperature, clusters coexist with the adatom array, as was the case at room temperature, but the clusters are larger and patches devoid of Ag adatoms exist in their vicinity (examples are shaded in Figure 6). In what follows, such areas will be termed “vacancy trails”. The vacancy trails are aligned with the local Fe row direction, giving further evidence that the preferential diffusion along the row direction is not merely an effect caused by STM. In most cases the vacancy trails extend from a cluster located at a step edge, along the local Fe row direction, to the middle of a terrace. Following annealing to 545 K (Figure 6b) all clusters reside at either step edges or antiphase domain boundaries25 in the (√2×√2)R45° reconstruction. The shape of the clusters in Figure 6b appears elongated to the right side because the feedback loop of the STM did not adjust the tip–sample distance quickly enough after surmounting the large Ag clusters. Clusters are again associated with vacancy trails, which extend equal distances into the neighboring terraces. This is highlighted for the cluster in the center of Figure 6b, which sits at the junction between three terraces. From the areas of these large vacancy trails we can roughly estimate the number of atoms contained in the clusters. For example, assuming an initial adatom coverage of 0.58 ML Ag, the shaded region in Figure 6b corresponds to ∼225 Ag adatoms.
Figure 6.
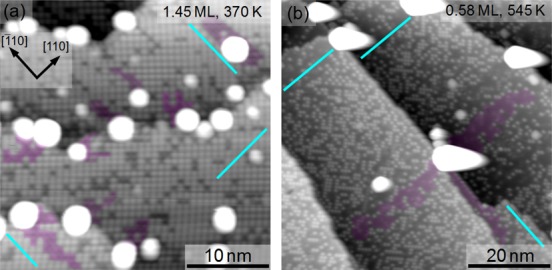
Observation of the different cluster growth mechanisms. (a) STM image (Usample = +1.2 V, It = 0.3 nA, 34 × 34 nm2, 1.45 ML Ag, flash-annealed at 370 K) illustrating the coexistence of Ag clusters and adatoms. Vacancy trails (some are shaded in red) lead to the clusters. These arise when the clusters capture Ag adatoms while diffusing on the surface. (b) STM image (Usample = +1.45 V, It = 0.3 nA, 67 × 67 nm2) of 0.58 ML Ag, flash-annealed at 545 K. Ag adatoms coexist with large Ag clusters immobilized at step edges. Vacancy trails lead to the clusters in equal distances on different terraces. This is consistent with adatom diffusion taking over as the primary cause of cluster growth. The cyan lines indicate the local Fe row directions along ⟨110⟩.
With the lifting of the (√2×√2)R45° reconstruction at ∼720 K,26 a dramatic change occurs. All small clusters disappear and are replaced by sparsely distributed Ag clusters with an apparent height of ∼10 nm (see Supporting Information). At 720 K, some Ag adatoms remain on the surface, even in close proximity to the large clusters, but after annealing to 820 K all Ag adatoms are incorporated into clusters.
Discussion
Combining the experimental data presented above with the results of the theoretical calculations, we are able to develop a full picture of growth in the Ag/Fe3O4(001) system. At low coverage, evaporated Ag atoms arrive with a random distribution and diffuse to occupy 2-fold coordinated sites within the (√2×√2)R45° reconstruction. The adatoms are stable, well-separated, and sufficiently immobile that homogeneous nucleation cannot spontaneously occur at very low coverage (as would occur in a typical Volmer–Weber growth). Monte Carlo simulations (see Supporting Information) show that already by 0.03 ML incident Ag atoms begin to arrive at locations where both neighboring sites along the Fe row direction are already occupied by a Ag adatom. Since no adatoms are observed in such locations at any coverage, this unfavorable Ag is efficiently redistributed within the adatom array. Our DFT+U calculations suggest that this redistribution is mediated by a Ag dimer, which forms readily (1.25 eV per Ag atom), but is ultimately unstable with respect to two stable adatoms (1.44 eV/Ag atom). When the dimer decays, one of the atoms is deposited in the next site along the row. Such a mechanism can also explain how such high coverages can be achieved. Ag atoms arriving in rows with many occupied sites will be passed backward and forward along the row, forming and breaking dimers, until the decay occurs adjacent to a vacancy. Crucially, the Ag dimer, like the Ag adatoms, remains bound at the preferred site and cannot diffuse and meet further Ag adatoms in order to grow. This restricts the number of simultaneously interacting Ag atoms to two, insufficient to form a stable cluster nucleus.
While dimer decay efficiently expands the adatom phase at low coverage, it is also responsible for the nucleation of stable clusters above 0.5 ML. At this coverage, the Ag distribution is highly inhomogeneous, and many consecutively occupied sites can be found in some rows (see Figure 4). If two excess Ag atoms exist in such a row, they will diffuse back and forth until they reach an empty site or until they occupy neighboring sites. When dimer decay occurs adjacent to an existing dimer, the number of Ag atoms that can simultaneously interact suddenly increases from two to three, and a cluster nucleates. Note that this does not mean that the smallest stable clusters contain three atoms, just that the homogeneous nucleation process is initiated by this interaction. It is possible, indeed likely, that further Ag adatoms from the vicinity are incorporated to form a stable cluster.
So how can we classify the growth of Ag at the Fe3O4(001) surface? At first glance, the coexistence of a complete adatom monolayer and 3D clusters suggests a S–K growth mode. However, the binding energy of an adatom to the surface (1.44 eV) is significantly less than inside a Ag cluster (∼2.9 eV), and the surface free energy of Ag(001) is significantly higher than that of Fe3O4(001).17 Together, these two numbers show that V–W growth should be clearly favored. The annealing experiments shown in Figure 6 are consistent with a thermodynamic preference for 3D crystallites, since the clusters grow at the expense of the adatom phase. The problem with this assignment, however, is that the stable adatom coverage is far in excess of what could be expected for a typical V–W system. Only after annealing to 800 K, when the reconstruction has been lifted, does the system grow in the V–W mode. We therefore conclude that the (√2×√2)R45° reconstruction introduces a kinetic barrier that prevents adatoms from transitioning to the thermodynamically favored 3D phase.
Kinetically hindered 3D growth has been observed previously in several systems.27−34 For example, a metastable Ag adatom layer (nearest-neighbor distance 0.38 nm) forms at room temperature on the Si(001)-(2×1) surface, despite the thermodynamic preference for 3D crystallites. Above 1 ML coverage, Ag clusters nucleate from and grow at the expense of the adatom phase, as observed here. It was reasoned that Ag adatoms bind more strongly to the Si substrate than they do as monomers atop a 2D Ag island and that additional Ag diffuses to the edge of the island where it joins the adatom phase. Cluster formation was explained as the result of multiple Ag atoms meeting in the second layer, with metal–metal bonding parallel to the surface stabilizing the 3D phase.34 This description cannot be applied to the Ag/Fe3O4(001) system because the distance between stable sites is too large (0.84 nm) for the adatom phase to be considered a “first layer”. Additional Ag atoms deposited into the adatom phase do not encounter a Ag island, rather an array of isolated adatoms. Consequently, Ag redistribution occurs within the adatom phase via formation and decay of Ag dimers and not by diffusion over the adatom phase.
In what follows, we develop an alternative description of the system in which cluster nucleation results from local supersaturation within the adsorption template system. We first define the saturation adatom coverage as 1 ML, i.e., the maximum amount of Ag that can be accommodated in stable sites on the adatom template. Note that this is not related to saturation adatom coverage in thermodynamic equilibrium, which is extremely low, but is a property of the system comparable to the solubility limit. When additional Ag is deposited onto the saturated template, the system contains more Ag than the solubility limit and enters a supersaturated state. It is important to note that supersaturation occurs locally well below the global solubility limit of 1 ML at room temperature because the adatom coverage is inhomogeneous and diffusion is slow. In the supersaturated adatom array, Ag dimers form and break, but larger nuclei cannot form. It is only when the degree of supersaturation (the Ag coverage) is increased that the critical size is exceeded and a stable nucleus forms.
In addition to studies of diffusion and growth, we anticipate the Fe3O4(001) adsorption template should find significant application in studies of heterogeneous catalysis. Recently, single atoms have been proposed to catalyze important reactions such as water–gas-shift and CO oxidation,9−13 but as yet there is little direct evidence as to how single atoms perform this function. The Fe3O4(001) adsorption template is the only model system where single atoms can be stabilized at reaction temperatures, making it ideal to uncover the atomic-scale details. In particular, it will be fascinating to study how the electronic structure of the adatoms, modified through their interaction with the metal-oxide support, affects adsorption properties. This has been proposed as a critical factor enhancing the reactivity of subnano species over larger nanoparticles.14,35,36 Finally, since the adatom templating property is an inherent property of the substrate, a well-defined model system can be created to study the reactivity of any metal adatom in any reaction.
Conclusions
In summary, the experiments described here highlight the power of adsorption templates for the study of fundamental processes at the atomic scale. The atomic-scale processes responsible for mass transport, cluster nucleation, and growth are determined for a kinetically hindered V–W system, and the relative instability of the Ag dimer is revealed as the barrier preventing Ag adatoms from transitioning to the thermodynamically preferable 3D phase. Similar behavior can be expected in other systems when the following conditions are met: (i) only one adatom is stable per adsorption site; (ii) the adatoms are almost immobile at the growth temperature; (iii) the dimer is unstable compared to two isolated adatoms; and (iv) the separation of the nucleation sites is sufficiently large to prevent homogeneous cluster formation. In the absence of atomically resolved STM, this could be detected via titration of the nucleation sites or by photoemission spectroscopy; a linear increase of the adatom coverage (or decrease of nucleation sites) would be followed by sudden recovery of much of the substrate area.
Methods
The experiments were performed on a synthetic Fe3O4 single crystal, prepared in an ultra-high-vacuum (UHV) chamber with a base pressure below 10–10 mbar by cycles of sputtering with Ar+ ions (pAr = 8 × 10⁻⁶ mbar, 1 keV, 1.2 μA, 15 min) followed by annealing with electron beam heating in O2 at 870 K (pO2 = 10–7 mbar, 15 min). Higher oxygen pressures were avoided in order to prevent the creation of bulk Fe vacancies or α-Fe2O3 inclusions over the long-term.37 For the thermal stability study, the sample was flash-annealed in UHV for 1 min at the given temperature, as measured by a K-type thermocouple attached to the sample holder. The uncertainty of the specified temperatures is estimated at ±50 K. Silver was deposited onto the as-prepared surface at room temperature from a Mo crucible in an LN2-cooled electron beam evaporator. Ag coverages are specified in monolayers (ML), defined as one adatom per Fe3O4(001)-(√2×√2)R45° unit cell (1.42 × 10¹⁸ atoms/m2). Deposition rates (∼2 ML/min) were calibrated using a water-cooled quartz crystal microbalance (QCM). STM measurements were performed in the adjacent analysis chamber (base pressure 5 × 10–11 mbar) using a customized Omicron μ-STM operated in constant current mode at room temperature with an electrochemically etched W tip. The Ag adatom coverage in each case is determined directly from the STM images, except for 1.45 ML, where the nominal QCM coverage is given.
The DFT-based theoretical calculations utilize the augmented plane wave + local orbitals (APW+lo) method as embodied in the WIEN2k38 code. We employ the generalized gradient approximation (GGA) of Perdew etal.39 and treat the correlated Fe-3d electrons with a Hubbard-U correction (GGA+U) and the double counting correction in the fully localized limit. Specifically we employ an effective U value of 3.8 eV for the Fe-3d states. In the APW+lo method, space is divided into spheres around the atoms and an interstitial region. We use atomic sphere radii of 1.86, 1.6, and 2.1 bohr for Fe, O, and Ag, respectively. The plane-wave cutoff is set to 12 Ry, and the 2D Brillouin zone is sampled with a 2 × 2 × 1 k-mesh. We use a Fermi broadening of 0.08 eV. The Feoct-terminated Fe3O4(001) surface is modeled using a symmetric slab with 13 layers and a 2 × 2 supercell (192 Fe and O atoms). The free surface has been fully relaxed, while for the adatom systems the four innermost layers have been frozen.
Acknowledgments
This material is based upon work supported as part of the Center for Atomic-Level Catalyst Design, an Energy Frontier Research Center funded by the U.S. Department of Energy, Office of Science, Office of Basic Energy Sciences, under award number DE-SC0001058. G.S.P. acknowledges support from the Austrian Science Fund project number P24925-N20. R.B. acknowledges a stipend from the TU Vienna and Austrian Science Fund doctoral college SOLIDS4FUN, project number W1243. The work at Tulane is supported by the NSF under grant DMR-1205469.
Supporting Information Available
The Supporting Information contains an STM movie showing the mobility of Ag adatoms, a large-scale STM image showing a large Ag cluster created by annealing to 720 K, additional thermal stability data, and details about Monte Carlo simulations. This material is available free of charge via the Internet at http://pubs.acs.org.
The authors declare no competing financial interest.
Supplementary Material
References
- Berdunov N.; Mariotto G.; Balakrishnan K.; Murphy S.; Shvets I. V. Oxide Templates for Self-Assembling Arrays of Metal Nanoclusters. Surf. Sci. 2006, 600, L287–L290. [Google Scholar]
- Corso M.; Auwärter W.; Muntwiler M.; Tamai A.; Greber T.; Osterwalder J. Boron Nitride Nanomesh. Science 2004, 303, 217–220. [DOI] [PubMed] [Google Scholar]
- N’Diaye A. T.; Bleikamp S.; Feibelman P. J.; Michely T. Two-Dimensional Ir Cluster Lattice on a Graphene Moiré on Ir(111). Phys. Rev. Lett. 2006, 97, 215501. [DOI] [PubMed] [Google Scholar]
- Chambliss D. D.; Wilson R. J.; Chiang S. Nucleation of Ordered Ni Island Arrays on Au(111) by Surface-Lattice Dislocations. Phys. Rev. Lett. 1991, 66, 1721–1724. [DOI] [PubMed] [Google Scholar]
- Kuhnke K.; Kern K. Vicinal Metal Surfaces as Nanotemplates for the Growth of Low-Dimensional Structures. J. Phys.: Condens. Matter 2003, 15, S3311–S3335. [Google Scholar]
- Repain V.; Baudot G.; Ellmer H.; Rousset S. Two-Dimensional Long-Range-Ordered Growth of Uniform Cobalt Nanostructures on a Au(111) Vicinal Template. Europhys. Lett. 2002, 58, 730–736. [Google Scholar]
- Schmid M.; Kresse G.; Buchsbaum A.; Napetschnig E.; Gritschneder S.; Reichling M.; Varga P. Nanotemplate with Holes: Ultrathin Alumina on Ni3Al(111). Phys. Rev. Lett. 2007, 99, 196104. [DOI] [PubMed] [Google Scholar]
- Novotny Z.; Argentero G.; Wang Z.; Schmid M.; Diebold U.; Parkinson G. S. Ordered Array of Single Adatoms with Remarkable Thermal Stability: Au/Fe3O4(001). Phys. Rev. Lett. 2012, 108, 216103. [DOI] [PubMed] [Google Scholar]
- Yang X.-F.; Wang A.; Qiao B.; Li J.; Liu J.; Zhang T. Single-Atom Catalysts: A New Frontier in Heterogeneous Catalysis. Acc. Chem. Res. 2013, 46, 1740–1748. [DOI] [PubMed] [Google Scholar]
- Qiao B.; Wang A.; Yang X.; Allard L. F.; Jiang Z.; Cui Y.; Liu J.; Li J.; Zhang T. Single-Atom Catalysis of CO Oxidation using Pt1/FeOx. Nat. Chem. 2011, 3, 634–641. [DOI] [PubMed] [Google Scholar]
- Sun S.; Zhang G.; Gauquelin N.; Chen N.; Zhou J.; Yang S.; Chen W.; Meng X.; Geng D.; Banis M. N.; etal. Single-Atom Catalysis Using Pt/Graphene Achieved through Atomic Layer Deposition. Sci. Rep. 2013, 3, 1775. [Google Scholar]
- Fu Q.; Saltsburg H.; Flytzani-Stephanopoulos M. Active Nonmetallic Au and Pt Species on Ceria-Based Water-Gas Shift Catalysts. Science 2003, 301, 935–938. [DOI] [PubMed] [Google Scholar]
- Kyriakou G.; Boucher M. B.; Jewell A. D.; Lewis E. A.; Lawton T. J.; Baber A. E.; Tierney H. L.; Flytzani-Stephanopoulos M.; Sykes E. C. H. Isolated Metal Atom Geometries as a Strategy for Selective Heterogeneous Hydrogenations. Science 2012, 335, 1209–1212. [DOI] [PubMed] [Google Scholar]
- Lei Y.; Mehmood F.; Lee S.; Greeley J.; Lee B.; Seifert S.; Winans R. E.; Elam J. W.; Meyer R. J.; Redfern P. C.; etal. Increased Silver Activity for Direct Propylene Epoxidation via Subnanometer Size Effects. Science 2010, 328, 224–228. [DOI] [PubMed] [Google Scholar]
- Campbell C. T. Ultrathin Metal Films and Particles on Oxide Surfaces: Structural, Electronic and Chemisorptive Properties. Surf. Sci. Rep. 1997, 27, 1–111. [Google Scholar]
- Bäumer M.; Freund H.-J. Metal Deposits on Well-Ordered Oxide Films. Prog. Surf. Sci. 1999, 61, 127–198. [Google Scholar]
- Gatel C.; Snoeck E. Comparative Study of Pt, Au and Ag Growth on Fe3O4(001) Surface. Surf. Sci. 2006, 600, 2650–2662. [Google Scholar]
- Stanka B.; Hebenstreit W.; Diebold U.; Chambers S. Surface Reconstruction of Fe3O4(001). Surf. Sci. 2000, 448, 49–63. [Google Scholar]
- Wiesendanger R.; Shvets I. V.; Bürgler D.; Tarrach G.; Güntherodt H. J.; Coey J. M. D.; Gräser S. Topographic and Magnetic-Sensitive Scanning Tunneling Microscope Study of Magnetite. Science 1992, 255, 583–586. [DOI] [PubMed] [Google Scholar]
- Pentcheva R.; Wendler F.; Meyerheim H. L.; Moritz W.; Jedrecy N.; Scheffler M. Jahn-Teller Stabilization of a “Polar” Metal Oxide Surface: Fe3O4(001). Phys. Rev. Lett. 2005, 94, 126101. [DOI] [PubMed] [Google Scholar]
- Łodziana Z. Surface Verwey Transition in Magnetite. Phys. Rev. Lett. 2007, 99, 206402. [DOI] [PubMed] [Google Scholar]
- Parkinson G. S.; Novotny Z.; Argentero G.; Schmid M.; Pavelec J.; Kosak R.; Blaha P.; Diebold U. Carbon Monoxide-Induced Adatom Sintering in a Pd-Fe3O4 Model Catalyst. Nat. Mater. 2013, 12, 724–728. [DOI] [PubMed] [Google Scholar]
- Parkinson G. S.; Novotny Z.; Jacobson P.; Schmid M.; Diebold U. Room Temperature Water Splitting at the Surface of Magnetite. J. Am. Chem. Soc. 2011, 133, 12650–12655. [DOI] [PubMed] [Google Scholar]
- Addou R.; Senftle T. P.; O’Connor N.; Janik M. J.; van Duin A. C. T.; Batzill M.. Influence of Hydroxyls on Pd Atom Mobility and Clustering on Rutile TiO2(011)-2×1. ACS Nano [Online early access]. DOI: 10.1021/nn501817w. Published Online: May 7, 2014. http://pubs.acs.org/doi/abs/10.1021/nn501817w (accessed June 11, 2014). [DOI] [PubMed] [Google Scholar]
- Parkinson G. S.; Manz T. A.; Novotny Z.; Sprunger P. T.; Kurtz R. L.; Schmid M.; Sholl D. S.; Diebold U. Antiphase Domain Boundaries at the Fe3O4(001) Surface. Phys. Rev. B 2012, 85, 195450. [Google Scholar]
- Bartelt N. C.; Nie S.; Starodub E.; Bernal-Villamil I.; Gallego S.; Vergara L.; McCarty K. F.; De la Figuera J. Order-Disorder Transition on the (100) Surface of Magnetite. Phys. Rev. B 2013, 88, 235436. [Google Scholar]
- Silly F.; Castell M. R. Bimodal Growth of Au on SrTiO3(001). Phys. Rev. Lett. 2006, 96, 086104. [DOI] [PubMed] [Google Scholar]
- Soria F.; Poppa H. Comparison of the Early Stages of Condensation of Cu and Ag on Mo(100) with Cu and Ag on W(100). J. Vac. Sci. Technol. 1980, 17, 449–452. [Google Scholar]
- Winau D.; Itoh H.; Schmid A. K.; Ichinokawa T. Reconstructions and Growth of Ag on Si(001)(2×1). Surf. Sci. 1994, 303, 139–145. [Google Scholar]
- Glueckstein J. C.; Evans M. M. R.; Nogami J. Surface Unwetting during Growth of Ag on Si(001). Phys. Rev. B 1996, 54, R11066–R110069. [DOI] [PubMed] [Google Scholar]
- Takeuchi O.; Kageshima M.; Sakama H.; Kawazu A. Atomically Resolved Nucleation and Initial Growth of a Ag Three-Dimensional Island on Si(001) Substrate. Phys. Rev. B 2011, 83, 205433. [Google Scholar]
- Kong D.; Drucker J. Tuning Ag/Si(100) Island Size, Shape, and Density. J. Appl. Phys. 2013, 114, 144310. [Google Scholar]
- Ernst K. H.; Ludviksson A.; Zhang R.; Yoshihara J.; Campbell C. T. Growth Model for Metal Films on Oxide Surfaces: Cu on ZnO(0001)-O. Phys. Rev. B 1993, 47, 13782–13796. [DOI] [PubMed] [Google Scholar]
- Starr D. E.; Ranney J. T.; Larsen J. H.; Musgrove J. E.; Campbell C. T. Measurement of the Energetics of Metal Film Growth on a Semiconductor: Ag/Si(100)-(2×1). Phys. Rev. Lett. 2001, 87, 106102. [DOI] [PubMed] [Google Scholar]
- Kaden W. E.; Wu T.; Kunkel W. A.; Anderson S. L. Electronic Structure Controls Reactivity of Size-Selected Pd Clusters Adsorbed on TiO2 Surfaces. Science 2009, 326, 826–829. [DOI] [PubMed] [Google Scholar]
- Li H.; Li L.; Li Y. The Electronic Structure and Geometric Structure of Nanoclusters as Catalytic Active Sites. Nanotechnol. Rev. 2013, 2, 515–528. [Google Scholar]
- Nie S.; Starodub E.; Monti M.; Siegel D. A.; Vergara L.; El Gabaly F.; Bartelt N. C.; De la Figuera J.; McCarty K. F. Insight into Magnetite’s Redox Catalysis from Observing Surface Morphology during Oxidation. J. Am. Chem. Soc. 2013, 135, 10091–10098. [DOI] [PubMed] [Google Scholar]
- Blaha P.; Schwarz K.; Madsen G. K. H.; Kvasnicka D.; Lutz J.. WIEN2k, An Augmented Plane Wave + Local Orbitals Program for Calculating Crystal Properties; Karlheinz Schwarz, Techn. Univ. Wien: Austria, 2001. [Google Scholar]
- Perdew J. P.; Burke K.; Ernzerhof M. Generalized Gradient Approximation Made Simple. Phys. Rev. Lett. 1996, 77, 3865–3868. [DOI] [PubMed] [Google Scholar]
Associated Data
This section collects any data citations, data availability statements, or supplementary materials included in this article.