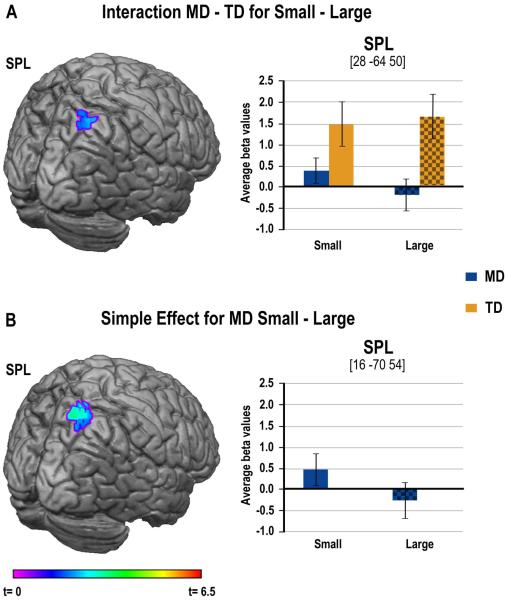
Figure 3.
Group differences in activation for multiplication in numerical ROIs. (A) On the left-hand side, image of the cluster in SPL showing greater activation for Small compared to Large problems for the MD children compared to the TD children. On the right-hand side, bar charts represent average activations for each group and for each problem size. (B) On the left-hand side, image of the cluster showing greater activation for Small compared to Large problems only in the MD children. On the right-hand side, bar charts represent average activations for each problem size.

