Abstract
Closed-loop deep brain stimulation (DBS) systems have the potential to optimize treatment of movement disorders by enabling automatic adjustment of stimulation parameters based on a feedback signal. Evoked compound action potentials (ECAPs) and local field potentials (LFPs) recorded from the DBS electrode may serve as suitable closed-loop control signals. The objective of this study was to understand better the factors that influence ECAP and LFP recording, including the physical presence of the electrode, the geometrical dimensions of the electrode, and changes in the composition of the peri-electrode space across recording conditions. Coupled volume conductor-neuron models were used to calculate single-unit activity as well as ECAP responses and LFP activity from a population of model thalamic neurons. Comparing ECAPs and LFPs measured with and without the presence of the highly conductive recording contacts, we found that the presence of these contacts had a negligible effect on the magnitude of single-unit recordings, ECAPs (7% RMS difference between waveforms), and LFPs (5% change in signal magnitude). Spatial averaging across the contact surface decreased the ECAP magnitude in a phase-dependent manner (74% RMS difference), resulting from a differential effect of the contact on the contribution from nearby or distant elements, and decreased the LFP magnitude (25% change). Reductions in the electrode diameter or recording contact length increased signal energy and increased spatial sensitivity of single neuron recordings. Moreover, smaller diameter electrodes (500 µm) were more selective for recording from local cells over passing axons, with the opposite true for larger diameters (1500 µm). Changes in electrode dimensions had phase-dependent effects on ECAP characteristics, and generally had small effects on the LFP magnitude. ECAP signal energy and LFP magnitude decreased with tighter contact spacing (100 µm), compared to the original dimensions (1500 µm), with the opposite effect on the ECAP at longer contact-to-contact distances (2000 µm). Finally, acute edema reduced the single neuron and population ECAP signal energy, as well as LFP magnitude, and glial encapsulation had the opposite effect, after accounting for loss of cells in the peri-electrode space. This study determined recording conditions and electrode designs that influence ECAP and LFP recording fidelity.
1. Introduction
Measuring neural activity using the same electrode array implanted for deep brain stimulation (DBS) could contribute to understanding the mechanisms of this promising therapy [1, 2] and improve outcomes by providing a feedback signal for closed-loop control. Local field potentials (LFPs), representing synchronized neural oscillations, can be recorded from the DBS electrode [3–5], and may serve as a feedback control signal for automatic adjustment of stimulation to optimize therapy [6, 7]. The evoked compound action potential (ECAP) is generated by activation of an ensemble of neurons adjacent to the electrode, can also be recorded from the DBS electrode, and provides insight into the type and spatial extent of neural element excitation during DBS [8]. The aim of the present work was to conduct a systematic, quantitative assessment of the influence of the electrode on ECAP and LFP recordings, including the physical presence of the recording contacts, the dimensions of the electrode, and the presence of edema or glial encapsulation in acute and chronic recording conditions, respectively.
We first determined the effect of the large, highly conductive electrode contacts on the recorded signals, as well as the sensitivity of the recorded signals to electrode diameter, contact length, and contact spacing. Prior analyses of electromyogram recordings [9] and cortical pyramdical cell microelectrode recordings [10] suggested modest effects of the presence of the electrode on the recorded signal. Reductions in the recording contact surface area generally increased signal amplitude, as demonstrated by LFP recordings with a microelectrode versus a DBS electrode [11] and single-unit recordings made with microelectrodes [10, 12]. Further, smaller contacts should be more spatially sensitive, with contributions extending to neurons several millimeters with measurement from a DBS electrode [11] and only ~100 µm from a microelectrode [10, 13]. Smaller spacing between contacts reduces the distance from recording contacts to the activated neural population, but can also reduce contributions from more distant neurons, and therefore may decrease the maximum signal amplitude [11]. Previous studies investigated modified DBS electrode designs for targeted stimulation or improved energy efficiency, including segmentation of electrodes [14–16], adjustment of the contact diameter-to-length ratio [17], and high perimeter contact shapes [18], but we are unaware of similar analysis of DBS electrode designs for neural recording.
Subsequently, we quantified the effects of changes in the peri-electrode space between acute and chronic recording conditions on the recorded signals. Several studies have documented reduction following acute edema or chronic glial encapsulation of voltages generated in the brain during stimulation [19, 20]. Acute edema reduced the amplitude of simulated single-unit recordings by 24% while glial encapsulation increased the signal amplitude by 17%, contrary to the notion that encapsulation leads to electrical isolation of the recording contacts (except when the resistivity of the peri-electrode space was sufficiently high) [10]. Further, the impedance of the peri-electrode space was correlated with the amplitude of the low frequency LFPs (2–7 Hz, including theta band), but not the beta band LFPs [11, 21, 22].
2. Methods
A computational model was used to calculate ECAPs and LFPs recorded with a DBS electrode from a population of model thalamic neurons, as well as evoked responses generated by single neural elements. The three stage model included: (1) a finite element method (FEM) volume conductor model of the DBS electrode implanted within the ventral intermediate (Vim) nucleus of the thalamus, (2) multi-compartment cable models of thalamocortical neurons and their presynaptic inputs, which provided the electrical sources for the ECAP or LFP, and (3) application of the reciprocity theorem to calculate potentials generated at the DBS recording contacts by neuronal transmembrane currents. The monopolar symmetric contact configuration (monopolar stimulation contact between two symmetrical, bipolar recording contacts) was used to match previous studies [8, 23].
2.1. FEM volume conductor model
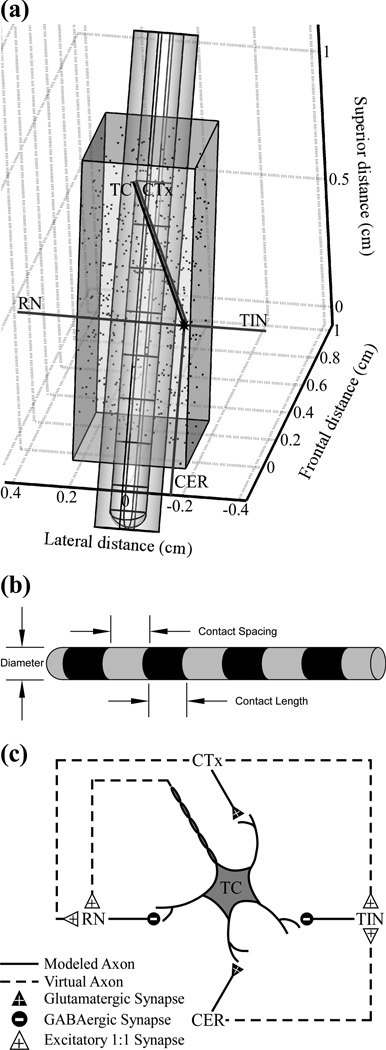
The FEM model was implemented in COMSOL Multiphysics v3.4 (COMSOL, Burlington, MA) to calculate potentials generated by DBS (figure 1(a)). The volume conductor included geometrical representations of the DBS electrode within a prism-shaped Vim, and both were surrounded by adjacent brain tissue represented as a cylinder parallel to the DBS electrode and centered at the electrode tip [24]. The conductivities of the electrode contacts, electrode insulation, and brain tissue were 5×1061×10−13, and 3 0. S/m, respectively [10, 20]. In a subsequent version of this model, a 500 µm thick peri-electrode space was introduced around the DBS electrode to represent edema (1.7 S/m) or a glial encapsulation layer (0.1 S/m) [20, 25]. The DBS electrode was shifted from its original location [24] by 6 mm along its axis in a ventral direction, which more accurately represented clinical electrode placement as well as the ECAP shape recorded in humans during Vim DBS [26]. The electrode dimensions initially matched the Medtronic 3387 clinical electrode, with 1.27 mm diameter, 1.5 mm contact length, and 1.5 mm contact spacing, and were subsequently varied with diameters from 0.5 to 1.5 mm, recording contact lengths of 1 to 2 mm, and contact spacings of 0.1 to 2 mm (figure 1(b)). The electrode tip location was shifted to maintain the same location for the stimulating contact for the different contact lengths and spacings, which preserved neural activation across geometries. To calculate potentials generated by monopolar DBS, a 1 V boundary condition was imposed at contact 1, the outer boundary of the surrounding cylindrical tissue was grounded, and the model was meshed and solved.
Figure 1.
Computational model used to determine the effects of the electrode geometry and peri-electrode tissue properties on recorded neural signals. (a) The finite element method (FEM) geometry of a Medtronic 3387 deep brain stimulation (DBS) electrode is shown, surrounded by a peri-electrode space domain, and implanted in a prism representation of the ventral intermediate (Vim) nucleus of the thalamus. The locations of 500 thalamocortical (TC) somata within Vim thalamus are indicated by the dots, and the axon positioning is shown for one neuronal unit, which includes a TC neuron and presynaptic inputs from the cortex (CTx), cerebellum (CER), reticular nucleus (RN), and thalamic interneurons (TIN). (b) Schematic description of electrode dimensions. (c) Synaptic connections between neural elements. Used with permission from [8].
Sensitivity analysis indicated that the modeled tissue volume was sufficiently large, because doubling the diameter and height changed the potentials by only 2.0 ± 1.3%. Similarly, the FEM mesh density (~184,000 elements) was sufficiently high, as doubling the number of elements changed potentials by only 0.48 ± 0.1%.
2.2. Multi-compartment cable models
The potentials from the FEM model were coupled to validated multi-compartment cable models of neurons implemented in NEURON v7.1 [27]. The neuron models had geometric [28] and ion channel representations of thalamocortical (TC) neurons, including the soma, initial segment, and dendritic tree [29], and presynaptic inputs from the cortex (CTx), cerebellum (CER), reticular nucleus (RN), and thalamic interneurons (TIN) [24]. Interconnections between neural elements included excitatory glutamatergic synapses from CTx and CER to TC, inhibitory GABAergic synapses from RN and TIN to TC, and excitatory 1:1 synapses from TC and CTx to RN, and from CTx and CER to TIN, implemented with virtual terminating axons (figure 1(c)). Additional details on implementation of synaptic activity in the model are described elsewhere [24]. A single neural unit, defined as one TC cell and its presynaptic axonal inputs from CTx, CER, RN, and TIN, was repeated 500 times, with TC soma locations randomly distributed within Vim (figure 1(a)), and each modeled neuron made an individual contribution to the recorded signals. Any neural elements that intersected the DBS electrode or peri-electrode space (when present) were removed.
The potentials at the compartment locations of all model elements were calculating using quadratic interpolation of the potentials at the FEM mesh nodes, and extracellular stimulation was delivered to the neural models by scaling the potentials by the specified DBS amplitude. The model was solved using a backwards Euler implicit integration solver with a fixed time step of 25 µs. The stimulation waveform was symmetric and biphasic, delivered in a 1 s train with 100 Hz frequency, 50 µs/phase pulse duration, and cathodic-phase first polarity, with a pre-stimulation delay of 0.5 s for initialization. The selected DBS parameters were based on settings used in prior experimental ECAP recordings [8], and are similar to values used clinically: frequencies of 100–185 Hz and pulse widths of 60–210 µs [30]. The resulting transmembrane currents were measured from each model compartment as a function of time and served as the electrical sources for ECAP calculation. Additionally, transmembrane potentials were measured at the initial segment of the TC neuron and at the proximal node of Ranvier of each presynaptic input for detection of neural activation. From this we calculated percentage activation as the fraction of a given element type that fired an action potential within a given 0.1 ms bin following DBS pulses. LFPs were calculated in a similar manner as ECAPs, but without delivery of DBS, since LFPs are generated by ongoing neuronal oscillations in the brain. To produce these LFPs, the intrinsic patterns of activity present in the original model [24], including harmaline bursting of CER inputs and 20 Hz Poisson spiking of CTx inputs, were introduced in the LFP model, but not the ECAP model. The timing of the harmaline bursting and Poisson spiking was varied within the population between each of the CER and CTX inputs.
2.3. Calculation of ECAPs and LFPs using the reciprocity theorem
The reciprocity theorem was used to calculate the potentials generated by neuronal transmembrane currents [10, 31, 32]. This approach first required calculation of the reciprocal FEM solution in COMSOL: a unit current condition was imposed across the boundary of one recording contact, with all other contacts (including stimulating contact 1) set to an open condition. The resulting potentials were calculated at the locations of all model neuron compartments. This was interpreted as the voltage impressed on the contact for a unit current at a given compartmental location, and was adjusted by multiplicative scaling according to the actual magnitude and sign of the respective transmembrane current, as determined using NEURON. The process was repeated for the transmembrane currents at all compartments, and the population-derived signal was the superposition of individual compartment contributions at each time step. This was performed separately for recording contacts 0 and 2 in turn, and the ECAP or LFP was calculated as the differential voltage across the two recording contacts.
2.4. ECAP and LFP data processing
The signal magnitude calculated by the neuronal population (500 cellular units) was multiplied by 364 to account for the cell density in the human Vim (65 cells/mm2 in 50 µm sections [33]). The stimulus artefact in the ECAP signal was removed by template subtraction [34], in which the artefact template was calculated using a subthreshold stimulation pulse (0.01 V), scaled to match the artefact generated in the trial of interest, and subtracted. The ECAP was band-pass filtered from 10 Hz – 10 kHz with two cascaded first-order Butterworth filters and averaged with stimulus-triggering over eight responses to replicate the processing performed experimentally [8], and the LFP was filtered from 2–100 Hz [35].
ECAP signals were compared across model iterations using signal energy and RMS error (RMSE). ECAP signal energy was calculated by squaring the signal and integrating over individual ECAP phases. RMSE was calculated as in [9]:
The magnitude of LFP signals was calculated as the standard deviation over a 2.5 s duration waveform and compared across model iterations.
2.5. Single-unit recordings
The evoked responses generated by a single model local cell (TC neuron) or passing axon (60 node, 2 µm diameter MRG model [36]) positioned near two bipolar contacts (0+/2−) were calculated in a modified model. The axons of both elements were parallel to the electrode, and the lateral distance to the electrode boundary varied from 0.125 to 10 mm. The TC soma was centered lengthwise on contact 0, and the center node of the passing axon was centered on contact 1. The elements were activated by applying a suprathreshold depolarizing intracellular stimulation pulse with 100 nA amplitude and 50 µs duration at the TC soma or most ventral node of the passing axon. ECAPs were calculated as above, by coupling the multi-compartment cable models and reciprocal FEM approach. The stimulus artefact was removed using the template subtraction method, with the template calculated using a hyperpolarizing intracellular stimulation pulse of equal magnitude. Finally, signal energy was calculated by squaring the signal and integrating over the first 5 ms, excluding the first 0.25 ms for passing axons due to residual stimulus artefact.
3. Results
Computer simulation was used to calculate how the ECAP and LFP generated by a population of model thalamic neurons, or the evoked response measured from single neural elements, were affected by the presence of the recording electrode, the geometry of the recording electrode, and changes in the composition of the peri-electrode space.
3.1. ECAP and LFP signal waveforms
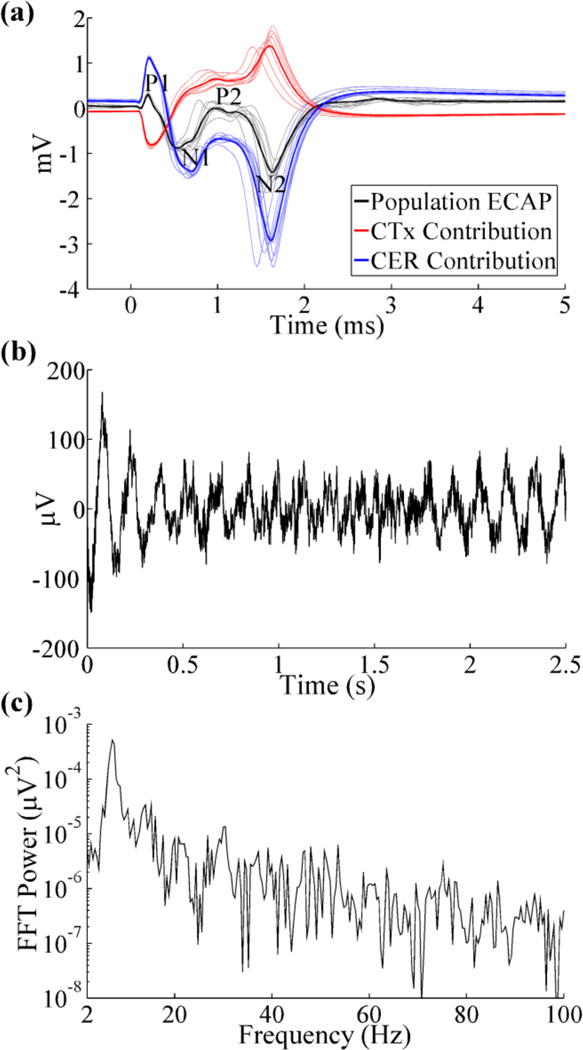
The ECAP waveform recorded from the population model was similar to that from clinical recordings [26], with a small, initial positive (P1) phase, followed by a large negative (N1) phase, secondary positive (P2) phase, and large, secondary negative (N2) phase (figure 2(a)). Cerebellar afferents generated the dominant contribution to all phases of the model ECAP, although contributions from cortical inputs reduced the magnitude of P1, N1, and N2 through destructive interference and shifted P2 to more positive voltages. The remaining elements had negligible contributions to the ECAP.
Figure 2.
Evoked compound action potential (ECAP) and local field potential (LFP) signals recorded with the Medtronic 3387 electrode. (a) Composite ECAP response with 3 V DBS, and individual contributions from activation of CTx and CER inputs. The average ECAP and single responses are shown in the bold and light traces, respectively, and phases of the ECAP are labeled. (b) LFP signal arising from intrinsic network activity. The LFP magnitude (standard deviation) was 37.04 µV. (c) FFT power spectrum of LFP signal from (b), with a peak frequency at 7.2 Hz.
The LFP signal recorded with DBS off oscillated at a fundamental frequency of 7.2 Hz, in the high theta band (figures 2(b), (c)), and was similar to recordings made in humans with ET [35, 37].
3.2. Effect of the presence of the DBS electrode
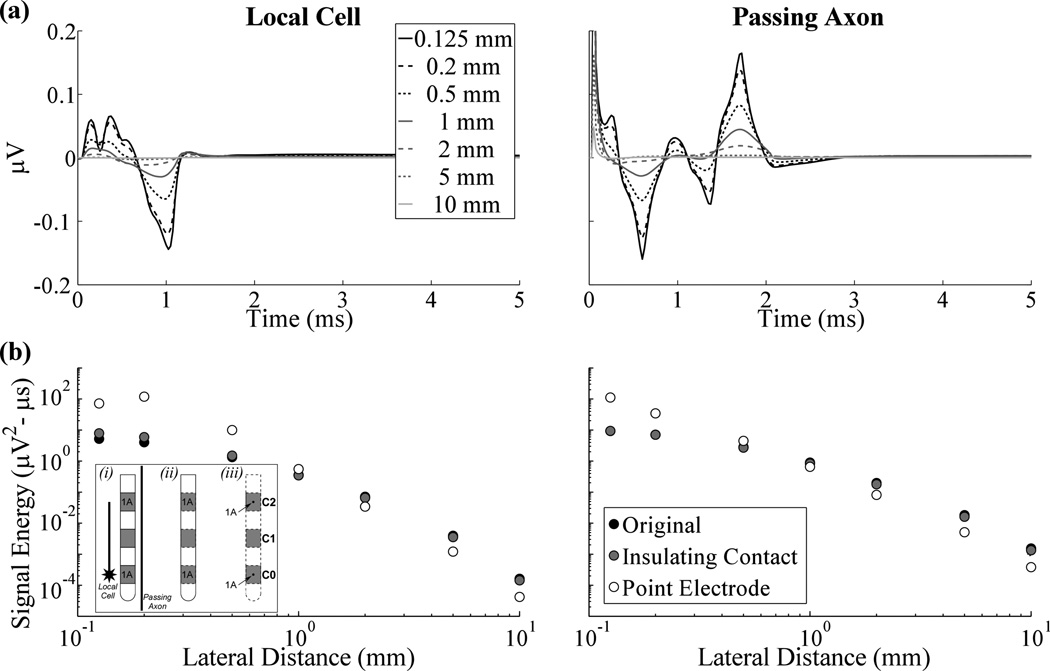
The signals generated by a single TC local cell and a single passing axon during action potential propagation past the two bipolar recording contacts are shown in figure 3(a). A residual stimulus artefact was measured from the passing axon, observed as the initial positive deflection, and was not included in the calculation of signal energy. The maximum peak-to-peak signal amplitudes measured from the local cell and passing axon with a Medtronic 3387 electrode were 0.21 µV and 0.32 µV, respectively, and typically decreased as the electrode to element lateral distance increased (figures 3(a),(b)). Signal energy was negligible (≥2 orders of magnitude smaller than the greatest energy observed) at electrode to element distances beyond ~1 mm (figure 3(b)). Additionally, the energy from elements stimulated with a sub-threshold pulse (~40 nA) was 2–3 orders of magnitude smaller than that from excited neural elements for a given electrode to element distance.
Figure 3.
Evoked responses measured from a single local cell or passing axon across electrode designs. (a) The evoked response at various lateral distances between the neural element and electrode using the dimensions of the Medtronic 3387 electrode with the original model. (b) Signal energy versus lateral distance for the original, insulating contact, and point electrode models, represented by black, gray, and white points, respectively. The lateral distance is measured to the location of the point electrodes for the latter model. The inset on the left is a cartoon describing the conditions used in the: (i) original model, with separate conductivities for the DBS electrode contacts and insulation, (ii) insulating contact model, in which the conductivity of contacts was set to that of insulation, and (iii) point electrode model, in which point sources were placed at the center of the contacts and the DBS electrode was no longer explicitly represented. Contacts 0 and 2 (C0 and C2) were recording contacts across the three conditions, and were set to 1 A in turn, with all other contacts set to a passive condition, to solve for the reciprocal FEM solutions and calculate the recorded neural signal. Separately, C1 was the stimulating contact and set to 1 V (with a distant ground) in the forward FEM model used to calculate potentials during DBS (not shown). The position of the single local cell or passing axon, relative to the DBS electrode, is shown in (i).
We analyzed how the evoked response signal energy from a single local cell or passing axon was altered by the presence of the electrode. In the original model, the recording contacts were highly conductive in the reciprocal FEM solution, whereas in the insulating contact model the conductivity of the recording contacts was changed to that of the insulating shaft. It was found that the original and insulating contact models resulted in similar signal energies across different electrode to element distances for local cells and passing axons (figure 3(b)). In the point electrode model, the DBS electrode was replaced by zero area point electrodes at the center of the original locations of the recording contacts. Compared to the signal energy of evoked responses recorded with DBS contacts, that observed with point electrodes was greater at lateral distances <1 mm and smaller at distances >1 mm for both the local cell and passing axon.
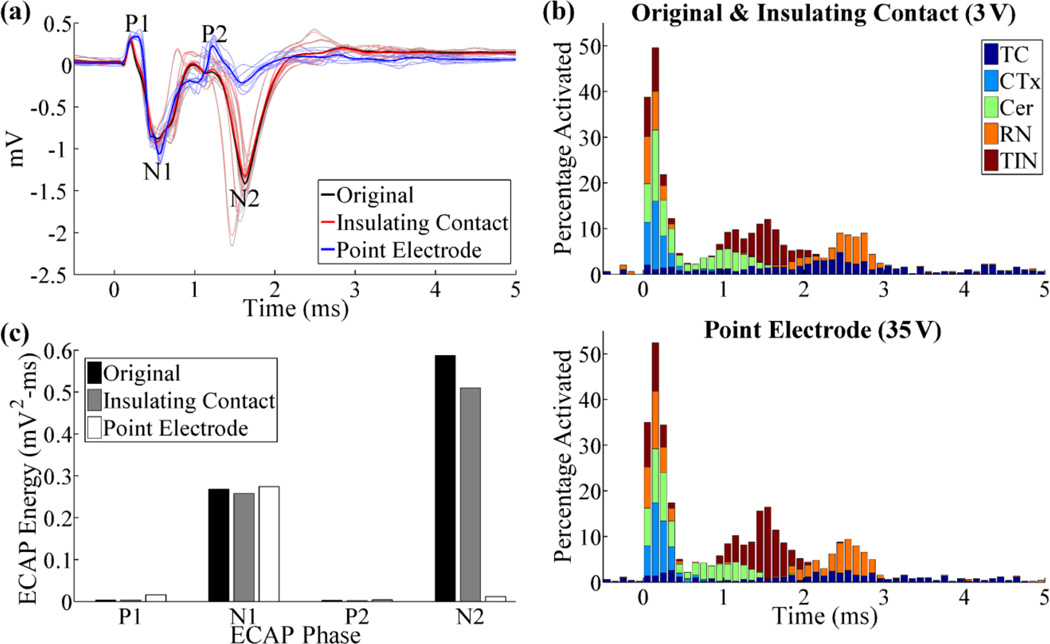
A similar analysis was performed at the population level for the ECAP and LFP responses. Compared to the original model, the insulating contact model resulted in a similar ECAP waveform (RMSE=7%) with a 4% and 13% reduction in N1 and N2 phase energy, respectively, indicating that the presence of the recording contacts had a negligible effect on the ECAP (figure 4(a),(c)). Similarly, the LFP magnitude was reduced by only 5% when the highly conductive recording contacts were absent (insulating contact), as compared to the original model. For the point electrode model, both the stimulating and recording electrodes were replaced by point sources, and the stimulation amplitude was increased from 3 V to 35 V to maintain neural activation (figure 4(b)). Compared to recordings with the DBS contacts, recordings with the point electrodes exhibited increased ECAP phases energies in P1 (340%), N1 (2%), and P2 (15%), and reduced phase energy in N2 (−98%) and an overall RMSE=74% between the two recordings (figure 4(a), (c)). The LFP amplitude, calculated as the standard deviation of the signal, was reduced by 25% in the point electrode model, compared to the original model.
Figure 4.
(a) ECAP responses for different electrode representations in the reciprocal FEM model. The DBS amplitude was 3 V for the original and insulating contact models, and 35 V for the point electrode model. (b) Percentage of elements activated in 0.1 ms bins after DBS pulses, for the conditions tested in (a). This was calculated for each element type individually (TC, CTx, CER, RN, or TIN) and is shown in a summed, stacked bar format, in which activation of a specific element type (0–100%) is given by the height of the corresponding segment within the bar. (c) Signal energy of each phase from the ECAP responses in (a).
3.3. Effect of electrode geometry
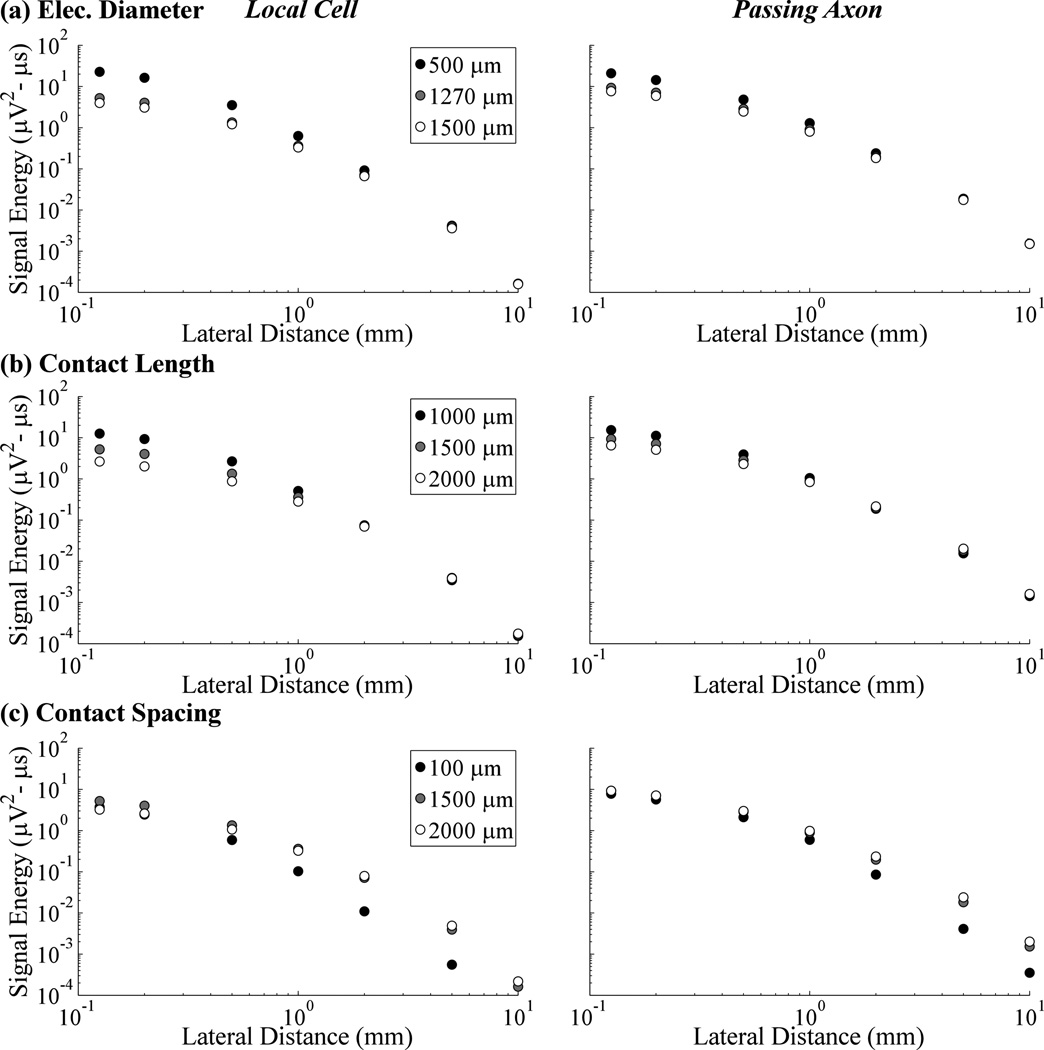
For both the single local cell and the passing axon, evoked response signal energy increased with smaller electrode diameters (figure 5(a)) or shorter contact lengths (figure 5(b)). This effect was most pronounced with small lateral distances, with convergence between different diameters and contact lengths with increasing electrode to element lateral distance. Smaller contacts were also more spatially selective, producing steeper reductions in signal energy as the lateral distance increased, whereas there was less relative decline in signal energy over distance with the larger contacts. Compared to the original Medtronic 3387 design, using the smallest contact diameter (500 µm) increased recording selectivity for the local cell over the passing axon (signal energy ratio of 1.09 at a cell distance of 0.125 mm), whereas the largest diameter (1500 µm) was more selective for the passing axon (ratio of 0.52). Contact-to-contact distances smaller than that of the Medtronic 3387 electrode reduced the energy of the recorded response, whereas larger spacings had an ambiguous effect dependent on element type (figure 5(c)). Smaller contact spacings also reduced contributions from more distant neurons, based on the steeper reduction in signal energy as electrode to element distance increased.
Figure 5.
Signal energy from single neurons versus lateral distance between the electrode and the local cell or passing axon, shown across electrode diameters (a), contact lengths (b), and contact spacings (c).
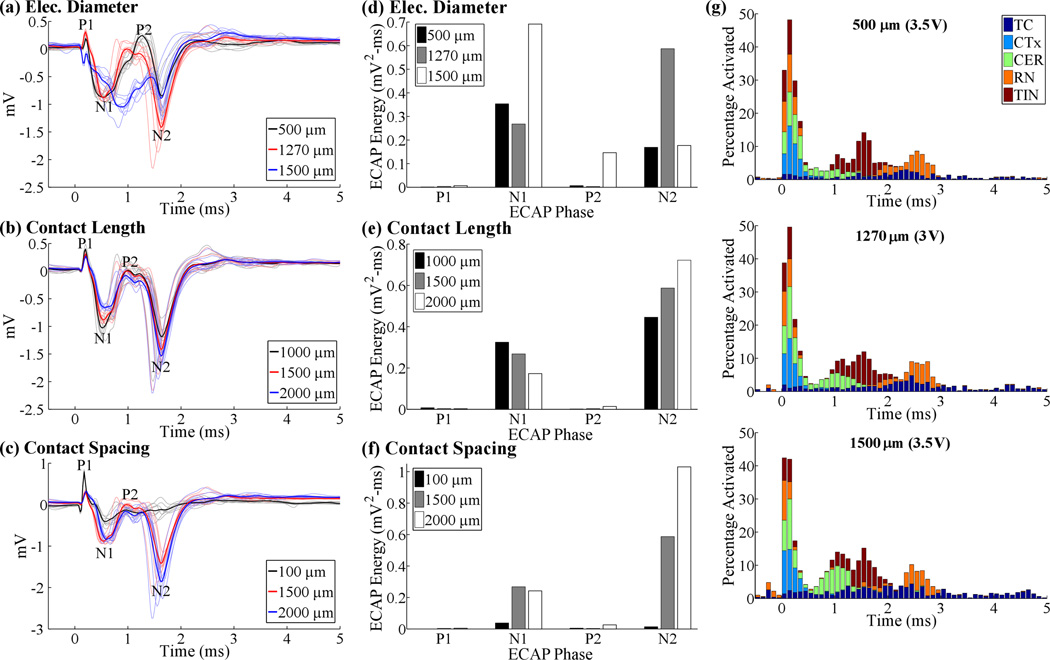
The effects of contact diameter and length on the ECAP were phase-dependent, as expected from the neural element specific effects observed in the single-unit analysis. Reducing the diameter from 1270 µm to 500 µm increased N1 and P2 phase energy by 32% and 110%, respectively, and decreased N2 phase energy by 71%, whereas increasing the diameter to 1500 µm increased the energy of the N1 phase (158%) and reduced only the N2 phase (−70%) (figures 6(a), (d)). The larger diameter electrode also distorted the typical ECAP waveform (figure 6(a)), greatly reducing the P1 and P2 peaks to below 0 mV. DBS amplitude was adjusted to maintain similar activation across the diameters tested, and there was a difference of only 8% in total neural activation within the first 0.2 ms after the DBS pulse (figure 6(g)). Nevertheless, small differences in neural activation across contact diameters remained, and this may have contributed to ECAP distortion. Reducing the contact length from 1500 µm to 1000 µm increased N1 energy by 21% but decreased N2 energy by 24%, whereas increasing the contact length to 2000 µm decreased N1 (−35%) and increased N2 (23%) phase energies (figures 6(b), (d)). Lastly, reducing inter-contact spacing from 1500 µm to 100 µm reduced the overall ECAP amplitude, particularly the N1 (−86%) and N2 (−98%) phases, whereas increasing the spacing to 2000 µm increased N2 energy by 76% (figures 6(c), (e)).
Figure 6.
ECAP responses across electrode geometries, including electrode diameters (a), recording contact lengths (b), and contact spacings (c). The initial negative and positive peaks of the ECAP with a 100 µm contact spacing in (c) corresponded to a residual stimulus artefact. DBS amplitude was 3 V for all electrode designs except with diameters of 500 or 1500 µm, for which DBS amplitude was increased to 3.5 V. (d-e) Signal energy of each phase from the corresponding ECAP responses in (a-c). (g) Neural activation for the three electrode diameters tested. Data presentation is as in figure 4(b).
The LFP amplitude, calculated as the standard deviation of the signal, was relatively stable across the geometries tested (≤10% change compared to the Medtronic 3387 design), except for a large increase (24%) when the diameter was reduced to 500 µm and decrease (−34%) when the contact spacing was reduced to 100 µm.
3.4. Effect of recording conditions
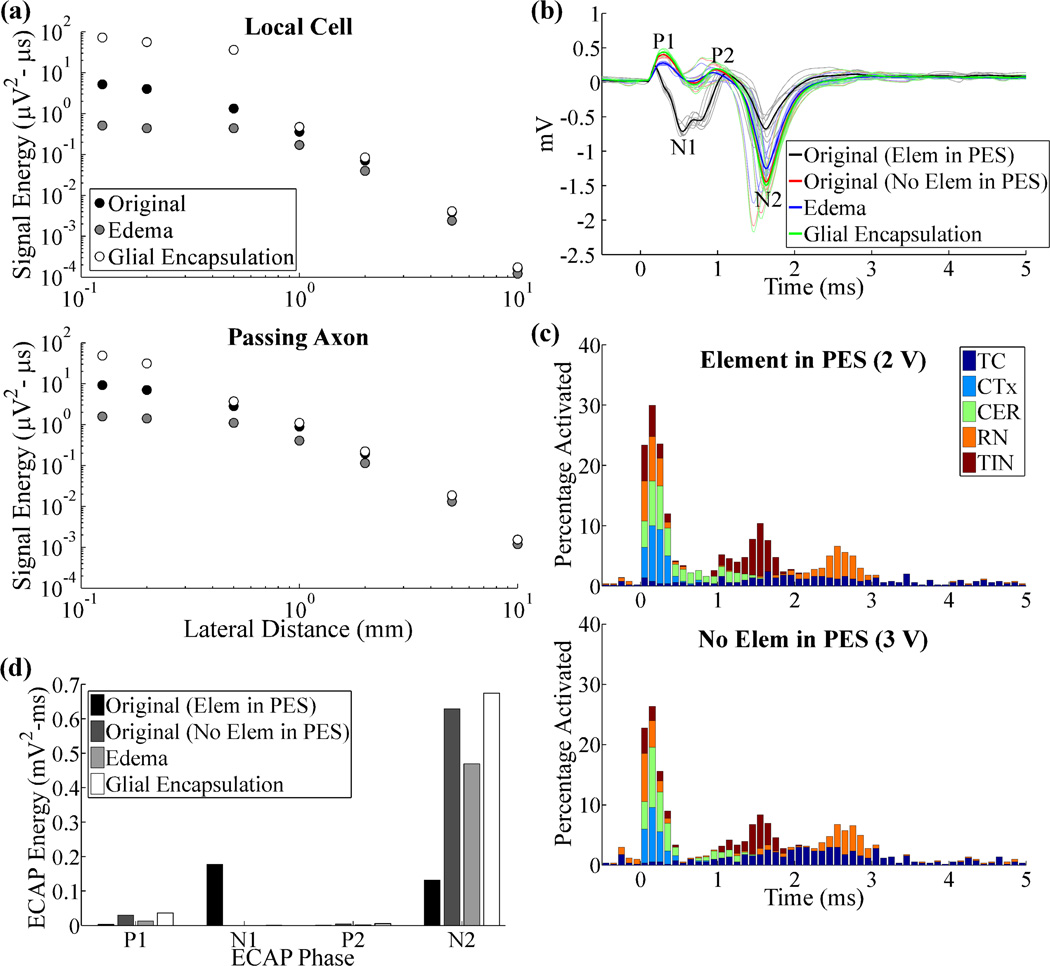
We investigated the effect of acute edema or chronic glial encapsulation on the recorded signals by introducing a 500 µm thick peri-electrode space with the appropriate conductivity. Edema or glial encapsulation decreased or increased signal energy, respectively, in recordings from a single local cell or passing axon, particularly when the element was located within the peri-electrode space, i.e. within 500 µm (figure 7(a)). We attempted to maintain a similar extent of neural activation in the population ECAP model across conditions, with or without representation of the peri-electrode space, and there was a difference of only 8% in total neural activation within the first 0.2 ms (figure 7(c)). Despite these adjustments, removing neural elements from the peri-electrode space, as would occur following edema or gliosis, alone had a large effect on the ECAP, with increases in phase energy of P1 (846%) and N2 (380%), and a reduction in that of N1 (−100%), due to changes in electrode to element distances (figures 7(b), (d)). Subsequent changes to the peri-electrode space conductivity to represent edema caused decreases in the energy of all phases (−25% to −88%), whereas glial encapsulation increased the energy of all phases (7% to 131%).
Figure 7.
Neural responses recorded in the original, acute edema, and chronic glial encapsulation models. (a) Signal energy from single neurons versus lateral distance between the electrode and the local cell or passing axon. (b) ECAP responses for the original model with and without elements in the peri-electrode space (PES), and for the edema and glial encapsulation models, with no elements in the PES. DBS amplitude was 2 V with neurons in the PES, and 3 V otherwise. (c) Neural activation for the conditions tested in (b). Data presentation is as in figure 4(b). (d) Signal energy of each phase from the ECAP responses in (b).
The composition of the peri-electrode space also had a substantial impact on the LFP. Removing neural elements from the peri-electrode space alone reduced the LFP magnitude by 31%, and acute edema led to further reductions, with a magnitude 43% smaller than that under the original conditions. Conversely, glial encapsulation generated only a 28% reduction in LFP magnitude, or a 5% increase over the condition where neural elements were removed from the peri-electrode space, but the conductivity was equal to that of the surrounding grey matter.
4. Discussion
We conducted a systematic investigation of how the presence and geometry of the DBS electrode, as well the changing conditions between acute and chronic electrode placements, affected recorded evoked (single-unit and ECAP) and intrinsic (LFP) neural signals. The highly conductive contacts had a negligible effect on the single element responses, ECAP (RMSE=7%) and LFP (5% magnitude change), in agreement with prior work [9]. Van Dijk and colleagues suggested that the effect of the contact was mitigated only if the impedance of the electrode-tissue interface (ETI) was high relative to the effective tissue impedance, although we did not include the ETI in our model. The differences in ECAPs recorded with the DBS electrode versus a point electrode indicated that spatial averaging across the larger contact surface decreased the signal magnitude, although in a phase-dependent manner (RMSE=74%). Analysis of single element responses indicated the decrease in signal magnitude with spatial averaging was only observed for lateral distances < 1 mm, with the opposite true at longer distances, perhaps as a result of the summation of otherwise dispersed transmembrane current sources. Further, there was a substantial reduction in LFP magnitude by 25% with the point electrode model, which may be explained by substantial signal contributions from distant elements in the original DBS contact model. Finally, these results differed from a previous study, which found small differences in single-unit recordings made with a microelectrode compared to those made with a point source representation [10], but this likely resulted from the already small surface area of the microelectrode (0.0004 mm2) compared to the DBS macroelectrode (5.98 mm2).
Smaller contact diameters and shorter contact lengths increased signal energy in single-unit recordings. This increase in signal strength for smaller contact surfaces confirmed previous findings [10–12, 38, 39], and can be explained by considering that recording the full potential generated by a nearby neuron requires that the contact area be small compared to the "steepest portion" of the corresponding extracellular field [40]; otherwise, potentials are reduced by spatial averaging. This is also in line with the point electrode model results for single elements within 1 mm of the electrode. Similar trends were observed between ECAP energy and electrode diameter or contact length, although with variable effects on different phases of the ECAP. Changing electrode dimensions can also alter neural activation, and we attempted to mitigate this effect by adjusting DBS amplitude accordingly. Nevertheless, distortion of the traditional ECAP waveform with a larger electrode diameter may have led to the non-monotonic relationship found between diameter and N1, P2, and N2 phase energy (figure 6(d)). In addition, we confirmed that smaller recording contacts were more sensitive to signals from nearby neurons, whereas larger contacts exhibited more uniform volumes of recording sensitivity. This observation can be used to tune the size of the recorded volume to encompass only the neuronal population that is critical to therapeutic effectiveness. Finally, we demonstrated that electrodes with diameters smaller than the Medtronic 3387 had increased recording selectivity for local cells over passing axons, whereas the opposite was true with larger electrode dimensions. Selective recording from cerebellothalamic passing axons may be desired, given that their activation during thalamic DBS for tremor appears critical to effective therapy [15, 24, 41, 42].
Reducing spacing between contacts from 1500 µm to 100 µm decreased the ECAP energy, particularly the N1 and N2 phases, whereas increasing contact spacing to 2000 µm increased the N2 phase. Similarly, shorter contact-to-contact distances reduced substantially the LFP signal magnitude. We initially expected that moving the recording contacts closer to the stimulating contact would increase ECAP signal strength by reducing the distance between activated neurons and recording contacts. However, this was more than offset by the reduced contribution from distant neurons associated with shorter distances between bipolar recording contacts [11]. Alternatively, use of a monopolar recording configuration could maximize contributions from distant neurons, but it is still unlikely that the ECAP would include contributions from all activated neurons. Recording ECAPs from single model neurons indicated that neural elements contributing to the ECAP were at lateral distances of ≤ ~1 mm, whereas the average radius of neural activation may extend to ~2.8 mm during clinical DBS, assuming a spherical volume of activation of 91 mm3 about a monopolar stimulating contact [43].
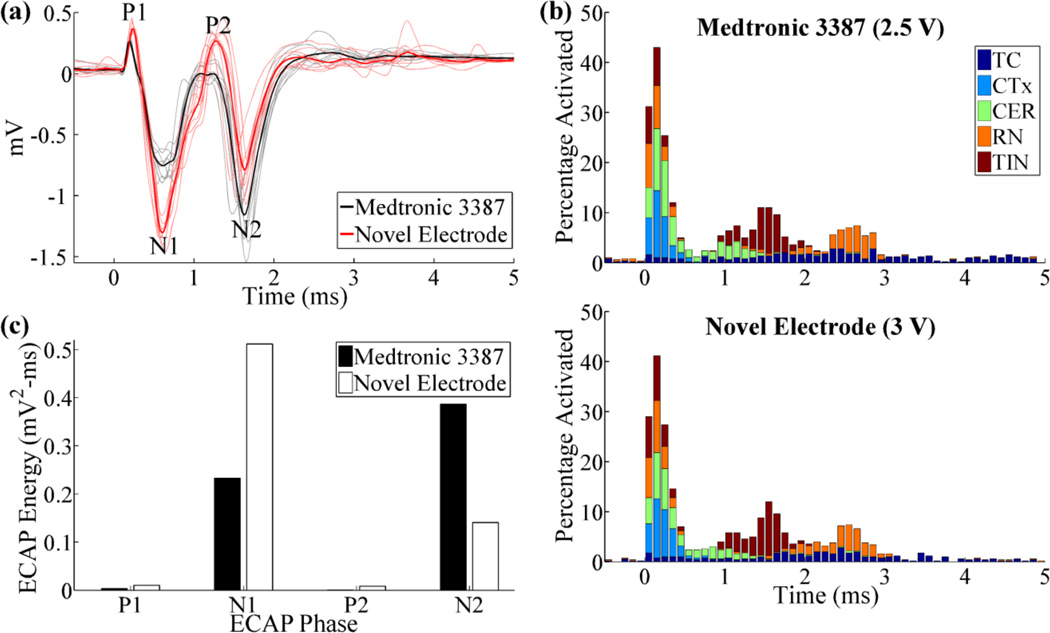
These results inform electrode design for improved ECAP recording. Reducing the recording contact length and diameter, as well as increasing contact spacing, can increase the signal magnitude, and the two former changes can also increase spatial sensitivity. We envision a novel electrode design that, compared to the Medtronic 3387 electrode, has a smaller recording contact length (1000 µm) and diameter (500 µm), as well as greater contact spacing (2000 µm). After adjusting stimulation voltage to maintain equal neural activation between the Medtronic 3387 electrode and this design (5% difference in the percentage of total neural activation in the first 0.2 ms), the ECAPs recorded with the new electrode exhibited greater energy of phases P1 (199%), N1 (119%), and P2 (2171%), although N2 was reduced (−64%) (figure 8). Moreover, the greater spacing between stimulating and recording contacts in the novel electrode are expected to reduce the artefact magnitude, as confirmed with a prior computational modeling study [26]. Potential shortcomings of this design include an increase in stimulation voltage requirements (0.5 V, 20%), due to the smaller stimulating contact diameter, and increased recording selectivity for local cells, such as thalamocortical neurons, relative to passing axons, such as cerebellothalamic afferents, even though the latter may mediate the therapeutic effectiveness of Vim-DBS. Additionally, if contacts on the new electrode are used for stimulation, there are changes in the risks for tissue damage and electrode corrosion due to increases in current and charge density. Finally, the increased contact spacing may reduce the ability to compensate for lead implant misplacement by activating adjacent contacts near the brain target.
Figure 8.
(a) ECAPs recorded with the original electrode (Medtronic 3387) and the novel electrode with smaller recording contact area and larger contact spacings. DBS amplitude was 2.5 V for the original electrode and 3 V for the novel electrode. (b) Neural activation for the electrodes tested in (a). Data presentation is as in figure 4(b). (c) Signal energy of each phase from the ECAP responses in (a).
The ECAP was affected by changes in the composition of the peri-electrode space that represented recording following acute or chronic implantation of the electrode. Neuronal cell loss in the peri-electrode space had a substantial effect on ECAP and LFP recordings, even with adjustments in stimulation amplitude to maintain similar overall levels of neural activation. Acute edema decreased the signal energy in single-unit recordings, ECAPs, and LFPs, while chronic glial encapsulation had the opposite effect. Similarly, Moffitt and McIntyre found that reductions in current density with glial encapsulation were counteracted by increases in resistivity and resulted in a net increase in recorded electric potentials, per Ohm's law, while the opposite was true for edema [10]. Changes in synaptic activity with ongoing high frequency DBS, potentially arising from neurotransmitter depletion and less reliable synaptic transmission [44] and/or synaptic plasticity could also impact the ECAP response, but accounting for these changes was beyond the scope of this study.
The computational model used in this work provided insight into how properties of the electrode and peri-electrode space affect recorded neural activity, but there were several limitations. First, geometrical approximations were made for the location of the DBS electrode and for the neural fibre trajectories, which could have affected neural activation during DBS and the resulting ECAP signal. Second, the model did not include representations of the ETI, tissue capacitance, or tissue inhomogeneity, which could have influenced both neural activation during DBS [19, 20, 45–47] as well as the recorded signals. In a modeling study of beta band LFP recordings made from a DBS electrode, the capacitance of the ETI and bulk brain tissue had no significant effect on the signal, although these effects are expected to be frequency-dependent [11]. Specifically, tissue capacitance and tissue inhomogeneities generate a low-pass filtering effect [48–50] that could impact the higher frequency components of the ECAP signal. Conversely, the ETI acts as a high-pass filter [45, 51], which can affect theta LFP recordings [21, 22], but should not substantially alter the ECAP. The electrode impedance is related to the surface area of the contacts [25], meaning that the effects of the ETI on the LFP may vary across electrode designs. Third, we did not consider the impact on signal fidelity of thermal noise (or other noise sources), which would increase with the higher ETI impedance expected for a smaller contact surface area [12, 38]. Consequently, both the signal and noise amplitudes may increase with the use of smaller electrode diameters or contact lengths, leading to a potentially ambiguous effect on the signal-to-noise ratio. Fourth, the DBS amplitude was not maintained at a constant level across the variables tested, but rather the stimulation amplitude was adjusted to maintain a nearly constant extent of neural activation. The population of active neurons served as the input (or source) that produced the ECAP output, and we sought to have equivalent input across conditions so that we could quantify the effects of alterations in the recording conditions on the output, and not have this be confounded by their effect on the input.
Acknowledgements
This work was supported by NIH F31 NS070460 and NIH R01 NS079312. Computational facilities were provided through the Duke University Shared Cluster Resource.
References
- 1.Gross RE, Lozano AM. Advances in neurostimulation for movement disorders. Neurol Res. 2000;22(3):247–258. doi: 10.1080/01616412.2000.11740667. [DOI] [PubMed] [Google Scholar]
- 2.McIntyre CC, Savasta M, Kerkerian-Le Goff L, Vitek JL. Uncovering the mechanism(s) of action of deep brain stimulation: activation, inhibition, or both. Clin Neurophysiol. 2004;115(6):1239–1248. doi: 10.1016/j.clinph.2003.12.024. [DOI] [PubMed] [Google Scholar]
- 3.Bronte-Stewart H, Barberini C, Koop MM, Hill BC, Henderson JM, Wingeier B. The STN beta-band profile in Parkinson's disease is stationary and shows prolonged attenuation after deep brain stimulation. Exp Neurol. 2009;215(1):20–28. doi: 10.1016/j.expneurol.2008.09.008. [DOI] [PubMed] [Google Scholar]
- 4.Brown P, Mazzone P, Oliviero A, Altibrandi MG, Pilato F, Tonali PA, et al. Effects of stimulation of the subthalamic area on oscillatory pallidal activity in Parkinson's disease. Exp Neurol. 2004;188(2):480–490. doi: 10.1016/j.expneurol.2004.05.009. [DOI] [PubMed] [Google Scholar]
- 5.Wingeier B, Tcheng T, Koop MM, Hill BC, Heit G, Bronte-Stewart HM. Intra-operative STN DBS attenuates the prominent beta rhythm in the STN in Parkinson's disease. Exp Neurol. 2006;197(1):244–251. doi: 10.1016/j.expneurol.2005.09.016. [DOI] [PubMed] [Google Scholar]
- 6.Priori A, Foffani G, Rossi L, Marceglia S. Adaptive deep brain stimulation (aDBS) controlled by local field potential oscillations. Exp Neurol. 2012 doi: 10.1016/j.expneurol.2012.09.013. [DOI] [PubMed] [Google Scholar]
- 7.Stanslaski S, Afshar P, Cong P, Giftakis J, Stypulkowski P, Carlson D, et al. Design and validation of a fully implantable, chronic, closed-loop neuromodulation device with concurrent sensing and stimulation. IEEE Trans Neural Syst Rehabil Eng. 2012;20(4):410–421. doi: 10.1109/TNSRE.2012.2183617. [DOI] [PubMed] [Google Scholar]
- 8.Kent AR, Grill WM. Neural origin of evoked potentials during thalamic deep brain stimulation. J Neurophysiol. 2013;110(4):826–843. doi: 10.1152/jn.00074.2013. [DOI] [PMC free article] [PubMed] [Google Scholar]
- 9.van Dijk JP, Lowery MM, Lapatki BG, Stegeman DF. Evidence of potential averaging over the finite surface of a bioelectric surface electrode. Ann Biomed Eng. 2009;37(6):1141–1151. doi: 10.1007/s10439-009-9680-7. [DOI] [PubMed] [Google Scholar]
- 10.Moffitt MA, McIntyre CC. Model-based analysis of cortical recording with silicon microelectrodes. Clin Neurophysiol. 2005;116(9):2240–2250. doi: 10.1016/j.clinph.2005.05.018. [DOI] [PubMed] [Google Scholar]
- 11.Lempka SF, McIntyre CC. Theoretical analysis of the local field potential in deep brain stimulation applications. PLoS One. 2013;8(3):e59839. doi: 10.1371/journal.pone.0059839. [DOI] [PMC free article] [PubMed] [Google Scholar]
- 12.Lempka SF, Johnson MD, Moffitt MA, Otto KJ, Kipke DR, McIntyre CC. Theoretical analysis of intracortical microelectrode recordings. J Neural Eng. 2011;8(4):1–15. doi: 10.1088/1741-2560/8/4/045006. [DOI] [PMC free article] [PubMed] [Google Scholar]
- 13.Henze DA, Borhegyi Z, Csicsvari J, Mamiya A, Harris KD, Buzsaki G. Intracellular features predicted by extracellular recordings in the hippocampus in vivo. J Neurophysiol. 2000;84(1):390–400. doi: 10.1152/jn.2000.84.1.390. [DOI] [PubMed] [Google Scholar]
- 14.Buhlmann J, Hofmann L, Tass PA, Hauptmann C. Modeling of a segmented electrode for desynchronizing deep brain stimulation. Front Neuroeng. 2011;4:15. doi: 10.3389/fneng.2011.00015. [DOI] [PMC free article] [PubMed] [Google Scholar]
- 15.Keane M, Deyo S, Abosch A, Bajwa JA, Johnson MD. Improved spatial targeting with directionally segmented deep brain stimulation leads for treating essential tremor. J Neural Eng. 2012;9(4):1–10. doi: 10.1088/1741-2560/9/4/046005. [DOI] [PMC free article] [PubMed] [Google Scholar]
- 16.Wei XF, Grill WM. Current density distributions, field distributions and impedance analysis of segmented deep brain stimulation electrodes. J Neural Eng. 2005;2(4):139–147. doi: 10.1088/1741-2560/2/4/010. [DOI] [PubMed] [Google Scholar]
- 17.Butson CR, McIntyre CC. Role of electrode design on the volume of tissue activated during deep brain stimulation. J Neural Eng. 2006;3(1):1–8. doi: 10.1088/1741-2560/3/1/001. [DOI] [PMC free article] [PubMed] [Google Scholar]
- 18.Grill WM, Wei XF. High efficiency electrodes for deep brain stimulation. Conf Proc IEEE Eng Med Biol Soc. 2009;2009:3298–3301. doi: 10.1109/IEMBS.2009.5333774. [DOI] [PMC free article] [PubMed] [Google Scholar]
- 19.Lempka SF, Johnson MD, Miocinovic S, Vitek JL, McIntyre CC. Current-controlled deep brain stimulation reduces in vivo voltage fluctuations observed during voltage-controlled stimulation. Clin Neurophysiol. 2010;121(12):2128–2133. doi: 10.1016/j.clinph.2010.04.026. [DOI] [PMC free article] [PubMed] [Google Scholar]
- 20.Yousif N, Bayford R, Liu X. The influence of reactivity of the electrode-brain interface on the crossing electric current in therapeutic deep brain stimulation. Neuroscience. 2008;156(3):597–606. doi: 10.1016/j.neuroscience.2008.07.051. [DOI] [PMC free article] [PubMed] [Google Scholar]
- 21.Yousif N, Bayford R, Wang S, Liu X. Quantifying the effects of the electrode-brain interface on the crossing electric currents in deep brain recording and stimulation. Neuroscience. 2008;152(3):683–691. doi: 10.1016/j.neuroscience.2008.01.023. [DOI] [PMC free article] [PubMed] [Google Scholar]
- 22.Rosa M, Marceglia S, Servello D, Foffani G, Rossi L, Sassi M, et al. Time dependent subthalamic local field potential changes after DBS surgery in Parkinson's disease. Exp Neurol. 2010;222(2):184–190. doi: 10.1016/j.expneurol.2009.12.013. [DOI] [PubMed] [Google Scholar]
- 23.Kent AR, Grill WM. Recording evoked potentials during deep brain stimulation: development and validation of instrumentation to suppress the stimulus artefact. J Neural Eng. 2012;9(3):036004. doi: 10.1088/1741-2560/9/3/036004. [DOI] [PMC free article] [PubMed] [Google Scholar]
- 24.Birdno MJ, Kuncel AM, Dorval AD, Turner DA, Gross RE, Grill WM. Stimulus features underlying reduced tremor suppression with temporally patterned deep brain stimulation. J Neurophysiol. 2012;107(1):364–383. doi: 10.1152/jn.00906.2010. [DOI] [PMC free article] [PubMed] [Google Scholar]
- 25.Butson CR, Maks CB, McIntyre CC. Sources and effects of electrode impedance during deep brain stimulation. Clin Neurophysiol. 2006;117(2):447–454. doi: 10.1016/j.clinph.2005.10.007. [DOI] [PMC free article] [PubMed] [Google Scholar]
- 26.Kent AR. Characterization of evoked potentials during deep brain stimulation in the thalamus. Duke University; 2013. [Google Scholar]
- 27.Hines ML, Carnevale NT. NEURON: a tool for neuroscientists. Neuroscientist. 2001;7:123–135. doi: 10.1177/107385840100700207. [DOI] [PubMed] [Google Scholar]
- 28.Destexhe A, Neubig M, Ulrich D, Huguenard J. Dendritic low-threshold calcium currents in thalamic relay cells. J Neurosci. 1998;18(10):3574–3588. doi: 10.1523/JNEUROSCI.18-10-03574.1998. [DOI] [PMC free article] [PubMed] [Google Scholar]
- 29.McIntyre CC, Grill WM, Sherman DL, Thakor NV. Cellular effects of deep brain stimulation: model-based analysis of activation and inhibition. J Neurophysiol. 2004;91(4):1457–1469. doi: 10.1152/jn.00989.2003. [DOI] [PubMed] [Google Scholar]
- 30.Volkmann J, Herzog J, Kopper F, Deuschl G. Introduction to the programming of deep brain stimulators. Mov Disord. 2002;17(Suppl 3):S181–S187. doi: 10.1002/mds.10162. [DOI] [PubMed] [Google Scholar]
- 31.Helmholtz HLF. Ueber einige gesetze der vertheilung elektrischer strome in korperlichen leitern mit anwendung auf die thierisch-electrischen versuche. Ann Physik Chemie. 1853;89:354–377. [Google Scholar]
- 32.Plonsey R. Dependence of scalar potential measurements on electrode geometry. Rev Sci Instrum. 1965;36(7):1034–1036. [Google Scholar]
- 33.Hirai T, Ohye C, Nagaseki Y, Matsumura M. Cytometric analysis of the thalamic ventralis intermedius nucleus in humans. J Neurophysiol. 1989;61(3):478–487. doi: 10.1152/jn.1989.61.3.478. [DOI] [PubMed] [Google Scholar]
- 34.Briaire JJ, Frijns JH. Unraveling the electrically evoked compound action potential. Hear Res. 2005;205(1–2):143–156. doi: 10.1016/j.heares.2005.03.020. [DOI] [PubMed] [Google Scholar]
- 35.Pedrosa DJ, Reck C, Florin E, Pauls KA, Maarouf M, Wojtecki L, et al. Essential tremor and tremor in Parkinson's disease are associated with distinct 'tremor clusters' in the ventral thalamus. Exp Neurol. 2012;237(2):435–443. doi: 10.1016/j.expneurol.2012.07.002. [DOI] [PubMed] [Google Scholar]
- 36.McIntyre CC, Richardson AG, Grill WM. Modeling the excitability of mammalian nerve fibers: influence of afterpotentials on the recovery cycle. J Neurophysiol. 2002;87(2):995–1006. doi: 10.1152/jn.00353.2001. [DOI] [PubMed] [Google Scholar]
- 37.Kane A, Hutchison WD, Hodaie M, Lozano AM, Dostrovsky JO. Enhanced synchronization of thalamic theta band local field potentials in patients with essential tremor. Exp Neurol. 2009;217(1):171–176. doi: 10.1016/j.expneurol.2009.02.005. [DOI] [PubMed] [Google Scholar]
- 38.Dimitrova NA, Dimitrov GV, Chikhman VN. Effect of electrode dimensions on motor unit potentials. Med Eng Phys. 1999;21(6–7):479–485. doi: 10.1016/s1350-4533(99)00069-7. [DOI] [PubMed] [Google Scholar]
- 39.Schoonhoven R, De Weerd JP. On the optimal choice of a recording electrode in electroneurography. Electroencephalogr Clin Neurophysiol. 1984;58(4):308–316. doi: 10.1016/0013-4694(84)90055-5. [DOI] [PubMed] [Google Scholar]
- 40.Humphrey DR, Schmidt EM. Extracellular single-unit recording methods. In: Boulton AA, Baker GB, Vanderwolf CH, editors. Neurophysiological Techniques, II: Applications to Neural Systems. Clifton, NJ: Humana Press; 1990. pp. 1–64. [Google Scholar]
- 41.Coenen VA, Madler B, Schiffbauer H, Urbach H, Allert N. Individual fiber anatomy of the subthalamic region revealed with diffusion tensor imaging: a concept to identify the deep brain stimulation target for tremor suppression. Neurosurgery. 2011;68(4):1069–1075. doi: 10.1227/NEU.0b013e31820a1a20. discussion 75-6. [DOI] [PubMed] [Google Scholar]
- 42.Sandvik U, Lars-Owe K, Anders L, Patric B. Thalamic and Subthalamic Deep Brain Stimulation for Essential Tremor: Where Is the Optimal Target? Neurosurgery. 2011;70(4):840–846. doi: 10.1227/NEU.0b013e318236a809. [DOI] [PubMed] [Google Scholar]
- 43.Frankemolle AM, Wu J, Noecker AM, Voelcker-Rehage C, Ho JC, Vitek JL, et al. Reversing cognitive-motor impairments in Parkinson's disease patients using a computational modelling approach to deep brain stimulation programming. Brain. 2010;133(Pt 3):746–761. doi: 10.1093/brain/awp315. [DOI] [PMC free article] [PubMed] [Google Scholar]
- 44.Wang LY, Kaczmarek LK. High-frequency firing helps replenish the readily releasable pool of synaptic vesicles. Nature. 1998;394(6691):384–388. doi: 10.1038/28645. [DOI] [PubMed] [Google Scholar]
- 45.Butson CR, McIntyre CC. Tissue and electrode capacitance reduce neural activation volumes during deep brain stimulation. Clin Neurophysiol. 2005;116(10):2490–2500. doi: 10.1016/j.clinph.2005.06.023. [DOI] [PMC free article] [PubMed] [Google Scholar]
- 46.Grant PF, Lowery MM. Effect of dispersive conductivity and permittivity in volume conductor models of deep brain stimulation. IEEE Trans Biomed Eng. 2010;57(10):2386–2393. doi: 10.1109/TBME.2010.2055054. [DOI] [PubMed] [Google Scholar]
- 47.Tracey B, Williams M. Computationally efficient bioelectric field modeling and effects of frequency-dependent tissue capacitance. J Neural Eng. 2011;8(3):1–7. doi: 10.1088/1741-2560/8/3/036017. [DOI] [PubMed] [Google Scholar]
- 48.Bedard C, Kroger H, Destexhe A. Modeling extracellular field potentials and the frequencyfiltering properties of extracellular space. Biophys J. 2004;86(3):1829–1842. doi: 10.1016/S0006-3495(04)74250-2. [DOI] [PMC free article] [PubMed] [Google Scholar]
- 49.Bedard C, Kroger H, Destexhe A. Model of low-pass filtering of local field potentials in brain tissue. Phys Rev E Stat Nonlin Soft Matter Phys. 2006;73(5 Pt 1):051911. doi: 10.1103/PhysRevE.73.051911. [DOI] [PubMed] [Google Scholar]
- 50.Buzsaki G, Anastassiou CA, Koch C. The origin of extracellular fields and currents--EEG, ECoG, LFP and spikes. Nat Rev Neurosci. 2012;13(6):407–420. doi: 10.1038/nrn3241. [DOI] [PMC free article] [PubMed] [Google Scholar]
- 51.Wise KD, Angell JB. A low-capacitance multielectrode probe for use in extracellular neurophysiology. IEEE Trans Biomed Eng. 1975;22(3):212–219. doi: 10.1109/tbme.1975.324562. [DOI] [PubMed] [Google Scholar]


