Abstract
Understanding the effect of graphene substrate on graphene-cell interaction is important for considering graphene as a potential candidate for biomedical applications. In this paper, biocompatibility of few layers of graphene film transferred to different substrates was evaluated using osteoblasts. The substrates were oxidized silicon wafer (SiO2/Si stack), soda lime glass and stainless steel. Chemical vapor deposition method was employed to synthesize graphene on copper substrate using methane and hydrogen as precursors. The quality and the thickness of graphene films on different substrates were estimated by Raman spectra, whereas the thickness of graphene film was confirmed by reflectance and transmittance spectroscopy. The study was also focused on cell attachment and morphology at two time points. The results show that graphene does not have any toxic effect on osteoblasts. The cell adhesion improves with graphene coated substrate than the substrate alone. It seems that graphene substrate properties plays a dominant role in cell adhesion. The result of this study suggest that a layer of graphene on bone implants will be beneficial for osteoblast attachment and proliferation.
Keywords: Graphene, Coating, Osteoblasts, Cell attachment, biocompatibility
1. Introduction
Graphene has become a promising and attractive material in different engineering fields due to its unique properties [1–3]. Graphene sheet is a single-atom thick layer of sp2 bonded carbon atoms forming a hexagonal 2D lattice [4]. The topography of single layer graphene is simple. In addition, recent achievements in chemical vapor deposition (CVD) synthesis have let the graphene coated on different material substrates after the successful synthesis on copper foil by Ruoff research group in late 2009 [5]. Another advantage of CVD synthesis of graphene is that the pure form and large flakes of graphene are reachable which is vital for biological tests. The research on biomedical applications of graphene has seen dramatic progress and yet mostly in its beginning stage [6]. Since 2008, researchers have started investigating the potential biomedical applications of graphene [7] and a lot of interesting works have been carried out to explore the use of graphene and its derivatives such as graphene oxide in biomedical applications [8]. These applications range from drug/gene delivery [9, 10], biosensors [11] and biocompatibility to antibacterial effects [12].
Cell biocompatibility is an initial requirement for the use of graphene in biological applications [13]. Although most of the papers have reported that graphene has some positive effects on cell adhesion, proliferation and differentiation [14–16], some scientists have demonstrated that certain form and derivatives of graphene would induce significant cell toxicity [17–19] which is useful for anticancer activities. Cell adhesion is a critical factor for other subsequent cell functions such as proliferation and formation of mineral deposits. Adhesion is greatly dependent on cell number, time, cell–material interface and surface topology [14].
Recently, the effects of some other parameters in graphene–cell interaction have been investigated [20–22]. It has been reported that an unusual behavior of human osteoblast was observed in the presence of graphene on SiO2/Si substrate with the initial presence/absence of fetal bovine serum (FBS) [20]. It was also demonstrated that oxygen and hydrogen treatment influenced the attached cell size. The sizes were larger on the hydrogen treated graphene synthesized by CVD [21]. Ryoo et al. [22] showed that graphene improves gene efficiency, focal adhesion and proliferation of fibroblast cells. Although some few recent papers have investigated the effect of graphene on different scaffold materials [23, 24], the effect of graphene substrate has not yet been completely discovered.
Biomaterials ranging from soft to hard, polymer to metal are available for diverse applications [25]. One of the main challenges of using biomaterials is to improve cell attachment and proliferation. A layer of graphene with its outstanding mechanical properties coated on a biomaterial as a substrate can be a promising candidate for cell adhesion and proliferation enhancement. This novel idea is appropriate in bone tissue engineering and other related fields. Next generation of bone implants with graphene coated layers would have better cell attachment properties which could drastically decrease the bone healing time.
In this research, three different substrates, namely soda lime glass, silicon wafer and stainless steel were selected to study the cell attachment and proliferation of osteoblasts. Graphene film was synthesized on copper foil by CVD method and subsequently transferred to the substrates. Cell attachment and proliferation study were done at day 2 and day 5. Our results showed that graphene substrate greatly affected the behavior of osteoblasts and improved cell attachment in selected time points.
2. Experimental Details
2.1. Synthesis and transfer of graphene films to desired substrates
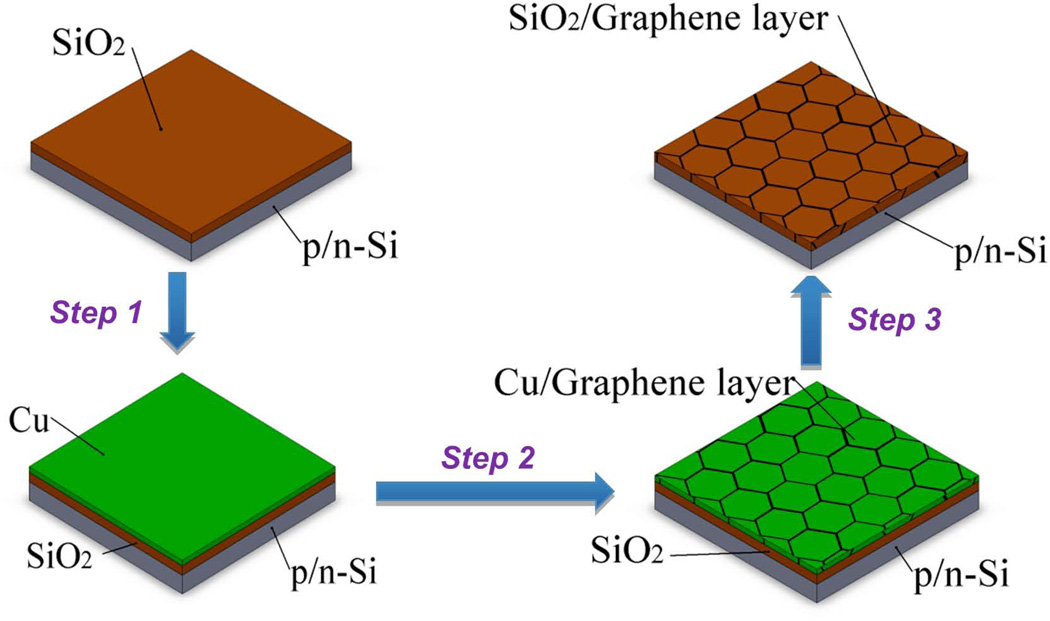
For all three substrates same graphene layer deposition procedure was applied. All the chemicals used to fabricate the graphene layer on substrates were reagent grade from Alfa Aesar and used without further purification. Methane (CH4) and Hydrogen (H2) gasses for the synthesis of graphene films on a copper foil were received from Air gas. Synthesis of graphene by CVD was carried out on a copper foil (25 µm thick, 99.9995 %, Alfa Aesar) in an alumina tube furnace system under the flow of CH4 and H2. The foil was treated with acetic acid under the ambient condition slightly above the room temperature (40°C) before it was subjected into the furnace. Copper foil was heated inside the tube furnace under 150 sccm flow rate of H2 and Argon (Ar) (10% H2, 90% Ar) mixture at 950°C for 1 h to allow the copper foil to anneal [26]. This step is necessary for the removal of any native oxide layer left on the surface after the heat treatment with acetic acid around 40°C for 10 min [27]. Graphene deposition was carried out by passing a mixture of CH4 and Ar (5% CH4, 95% Ar) for 15 min. The gas composition was changed to H2 and Ar immediately after the coating process was completed and the system was allowed to return to the room temperature with the cooling rate of 50°C/min. Transfer of graphene from copper to a desired substrate was carried out by a wet etching process. The details about the typical transfer processes employed in this work have been explained elsewhere [27]. Fig. 1 shows the schematic representation of the entire process for silicon wafer substrate.
Fig. 1.
Schematic illustration of the synthesis of graphene by CVD method. Step 1: copper film was vapor deposited on Si/SiO2 substrate by metal evaporation. Step 2: Synthesis of graphene was carried out by CVD method. Step 3: removal of Cu was carried out by wet etching of Cu.
2.2. Cell culture, proliferation and staining
Osteoblast (OB-6) murine cell vial was kindly provided by Dr. Beata Lecka-Czernik from the department of the orthopaedic surgery at the University of Toledo, Toledo, OH. Soda lime glass, silicon and stainless steel (Grade 302, ASTM A666) substrates with and without graphene coated layers were washed and sterilized under the UV light before placing in the 24-well-plate. Cells with the density of 25,000 cells per well plate were plated on substrates and incubated at 37°C in 5% CO2 in alpha minimum essential medium (α-MEM) supplemented with 10% fetal bovine serum (FBS) and 1% penicillin-streptomycin (Pen strep), all purchased from Gibco. The morphology of the adhered cells was characterized by immunofluoresent staining of live cells (Calcein-AM, Invitrogen), dead cells (Ethidium homodimer, Invitrogen) and nuclei (4’,6-diami-dino-2-phenylindole (DAPI), Invitrogen).
2.3. Instruments
The quality of the graphene films was examined by different optical methods, such as Raman spectroscopy, Scanning Electron Microscope (SEM), optical, and confocal microscopy, reflectance and transmission spectroscopy. The surface morphology was obtained using SEM (Hitachi, S-4800) operating at an accelerating voltage of 20 KV under high vacuum. High resolution images were captured using TCS SP5 multi-photon laser scanning/confocal microscope (Leica Microsystems). The Raman spectra of graphene films were obtained at room temperature with a Renishaw Invia Micro-Raman spectrometer in back scattering geometry with the laser excitation of 632.8 nm at a power level of 1.7 mV. The transmittance of the graphene films on soda lime glass was performed on a UV-VIS-NIR spectrophotometer. The fluorescence Olympus FSX-100 microscope was used to take microscopic images. For each group at each time point three samples were prepared and tested. In order to count cells, ten size-calibrated fluorescence images of Live/Dead stained cell from each substrate were obtained using microscope with a 4X lens. Captured images were analyzed and quantified by using ImageJ software. Statistical analysis was performed using one-way ANOVA and p<0.05 was considered as a significantly different data.
3. Results and discussion
3.1. Raman Spectroscopy
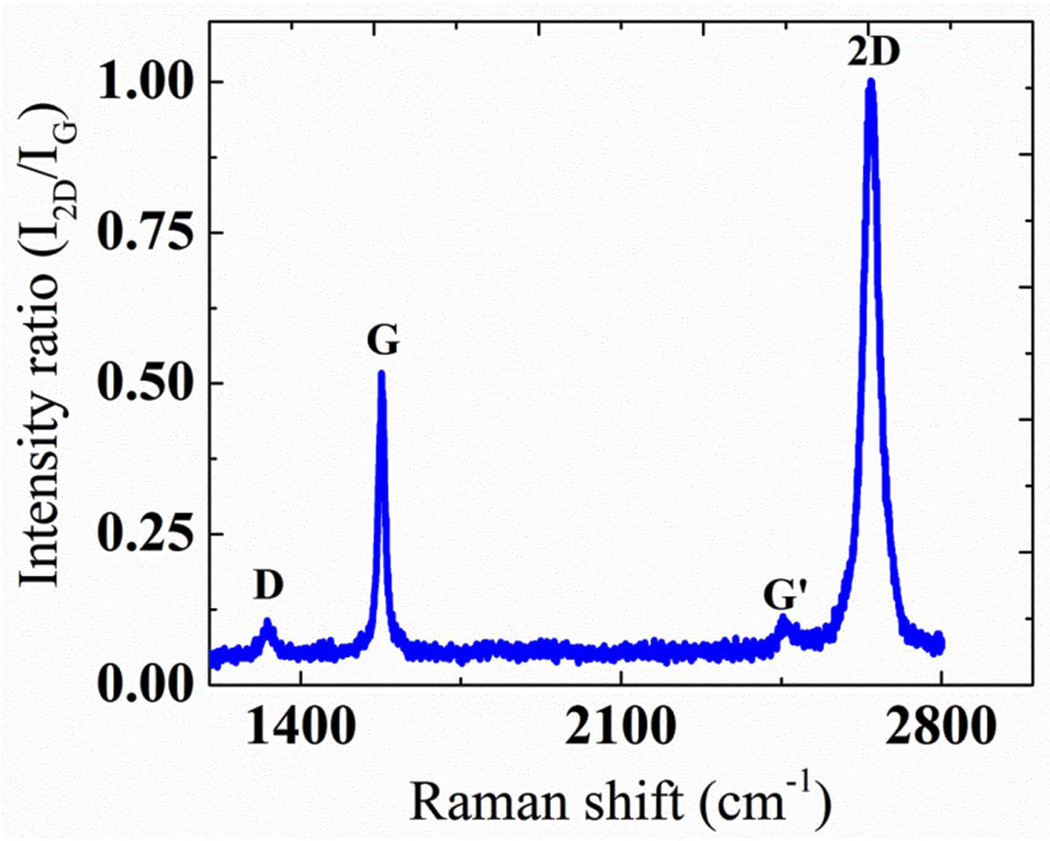
The Raman spectroscopy was used to characterize the graphene films transferred to different substrates. Fig. 2 shows typical Raman spectra of few layer graphene films synthesized in this laboratory on silicon wafer substrate. All other samples have shown approximately the same behavior. As reported by many researchers about quality graphene synthesis by CVD process, the spectra consist of Raman peaks corresponding to the D band (~1330 cm−1), G band (~1580 cm−1) and 2D band (~2660 cm−1). The D band peak indicated the presence of some defects in the crystal. To investigate the uniformity of the layer, a 2 by 2 cm2 area of graphene surface was divided into nearly 230 different grids to identify the uniformity of the surface [26]. The Full Width at Half Maximum (FWHM) mapping revealed that the 2D band was centered ~ 40 cm−1 with more than 80% of the data within 35 ± 20 cm−1, while I2D/IG ratio mapping was centered ~ 1.2 with more than 50% of the data within 1.1 ± 0.8. The mappings indicated that the film mostly consisted of few layer ranging from layers 1–5 [26]. For multilayer graphene, 2D band becomes less Raman active as compared to G band and the broadening of 2D band increases significantly [27]. The intensity of D band relative to G band (ID/IG) was found to increase with the increase in number of layers in graphene. Although the intensity ratio increased significantly (~ 0.16 to ~ 0.45), the change in FWHM was not significant (~ 30 cm−1 to ~ 35 cm−1) in going from monolayer to bi- and tri-layer graphene for D band. However, the broadening of D band increased significantly after three layers. The intensity of D band seen in the Raman spectra for monolayer graphene was either comparable or relatively less than the intensities reported in the literature [5, 28, 29]. However, its unavoidable presence suggests that the band is Raman active for the graphene synthesized on copper substrate through CVD process. These defects could be associated with the grain boundaries in the copper foils where graphene was initially made. This band also indicated the vacancies and strained hexagonal and non-hexagonal distortions in the film that may have arisen during the process of transfer.
Fig. 2.
A typical as-measured Raman spectra of few-layer graphene synthesized by CVD method. The spectra are normalized to 2D band.
3.2. Transmittance Spectroscopy
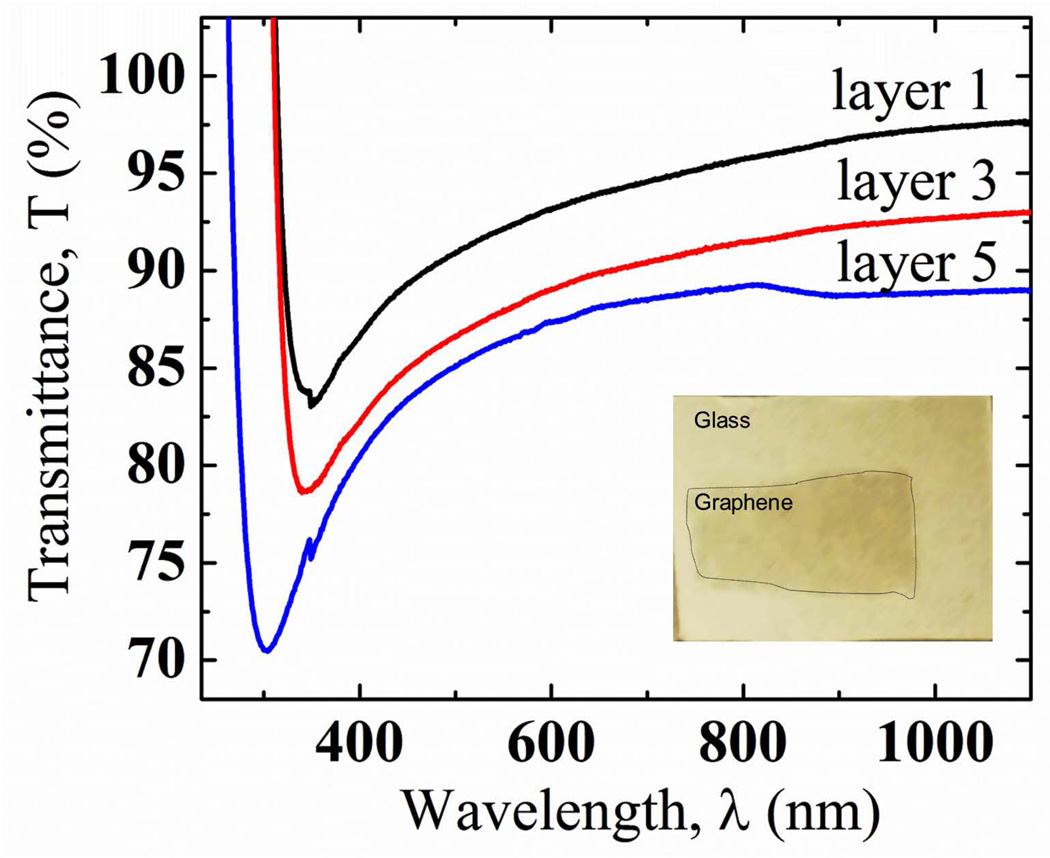
Optical analysis of thin films has always been a useful method to understand the quality of films, thickness, optical properties, and dielectric constants [27]. Fig. 3 shows the transmittance of the light in the range 200 – 1100 nm for few graphene layers. For layers 1–3, the transmittance (%) varied in between 85 – 95%. When the sample was equally divided into different grids for the transmittance measurements, the transmittance was found to vary between 78 – 97%, with more than 80% of the data lying within 80 – 90%. The slight decrease in the transmittance for monolayer graphene than theoretical value (T = (1+0.5nα)-2 ~ (1- nα) ~ 97.7%; n is a number of layers, α is a fine structure constant) [30] can be attributed to the contamination and mechanical defects produced during the transfer process. The mechanical defects in graphene due to the process of transfer from copper foil to the desired substrate can be greatly reduced by synthesizing graphene from transfer-free procedure as explained in detail elsewhere [26]. The inserted figure in Fig. 3 shows the difference in soda lime glass with and without graphene layer. The deposited graphene layer was successfully deposited on a large area of the glass substrate. Glass coated with the few layer graphene was darker and more opaque due to the absorbance of the visible light by graphene layer.
Fig. 3.
Transmittance spectra of graphene layers transferred to glass substrate. Figure in the inset is the comparison of glass substrate with graphene film (left) and without it (right).
3.3. Surface Imaging and Visual Transparency
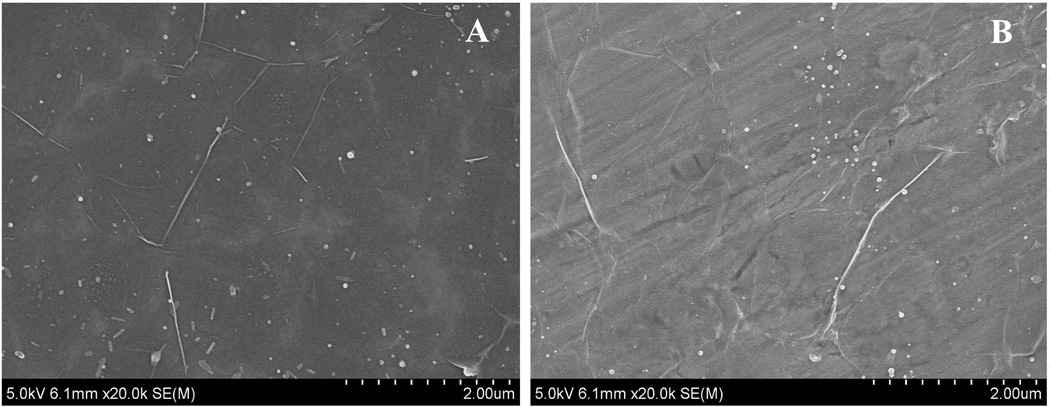
Few layer graphene films on silicon wafer and stainless steel substrates was characterized using SEM. Graphene layers completely covered a large area of the substrate. Transferred graphene layer to both substrates (Fig. 4) exhibited nanoripples with high density and a number of observable wrinkles compared to graphene on glass slide as expected [24]. Also, the surface roughness of stainless steel was higher than silicon wafer and the grinding direction was visible in Fig. 4B. For both silicon wafer and stainless steel substrates, in addition to deposition of graphene layer, non-uniform nano-sized spherical structures were also seen on the graphene surface. These particles could be associated with the process of deposition method for graphene layer employed in this work. The EDX spectra confirmed the particles as carbon atoms. Moreover, some cracks in the figure displays the defects probably produced during the transfer procedure of graphene.
Fig. 4.
(A) high magnification image of graphene layer on silicon wafer surface. (B) High magnification image of graphene on stainless steel surface.
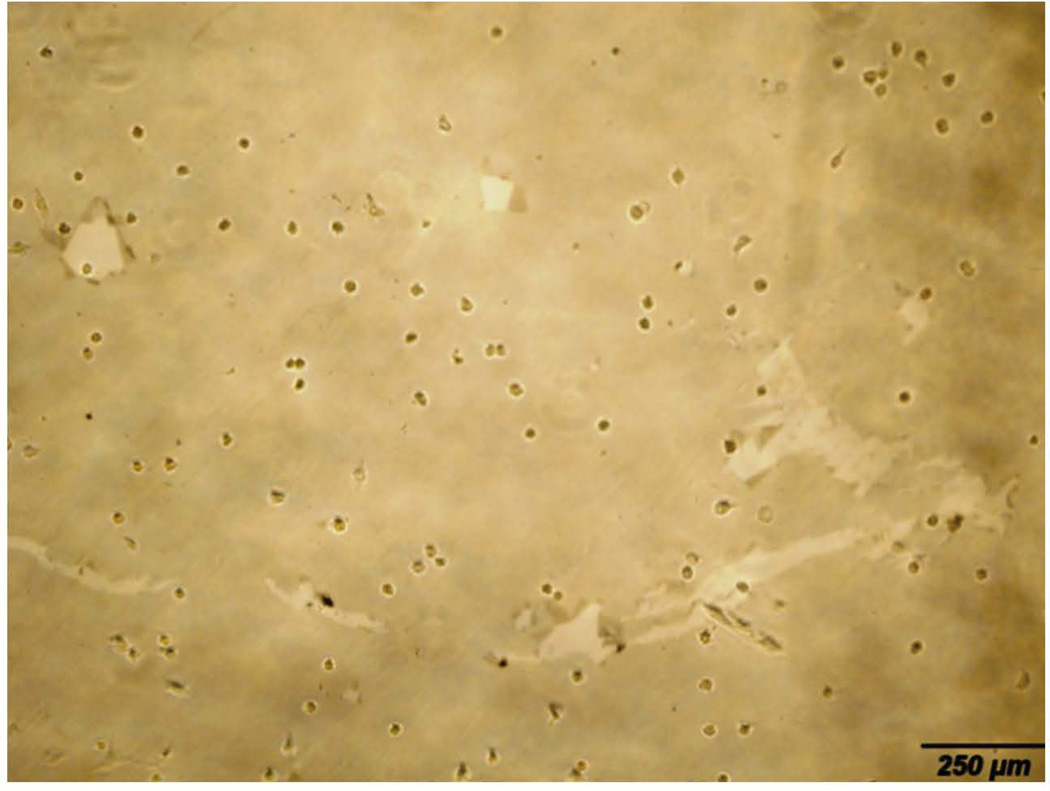
The graphene layers immobilized on a glass substrate and seeded with osteoblasts were examined by bright-field microscope after two days (Fig. 5). Graphene layer covered the entire area of soda lime glass slides except at the edges. Locally, CVD graphene layer consisted of many ripples and wrinkles in the micrometer scale [31].
Fig. 5.
Bright-field microscopy image of graphene coated layer on glass substrate with cells at day 2.
3.4. Surface-Cell interaction study
In this section, cell viability and attachment are discussed by image analysis on all three substrates with and without graphene coated layer. Few layers of graphene on plain cover soda lime glass, silicon wafer and stainless steel sheet were taken for surface-cell interaction study. Cells were cultured in osteogenic culture medium and two time points (day 2 and day 5) were selected to examine the cell viability, attachment and proliferation.
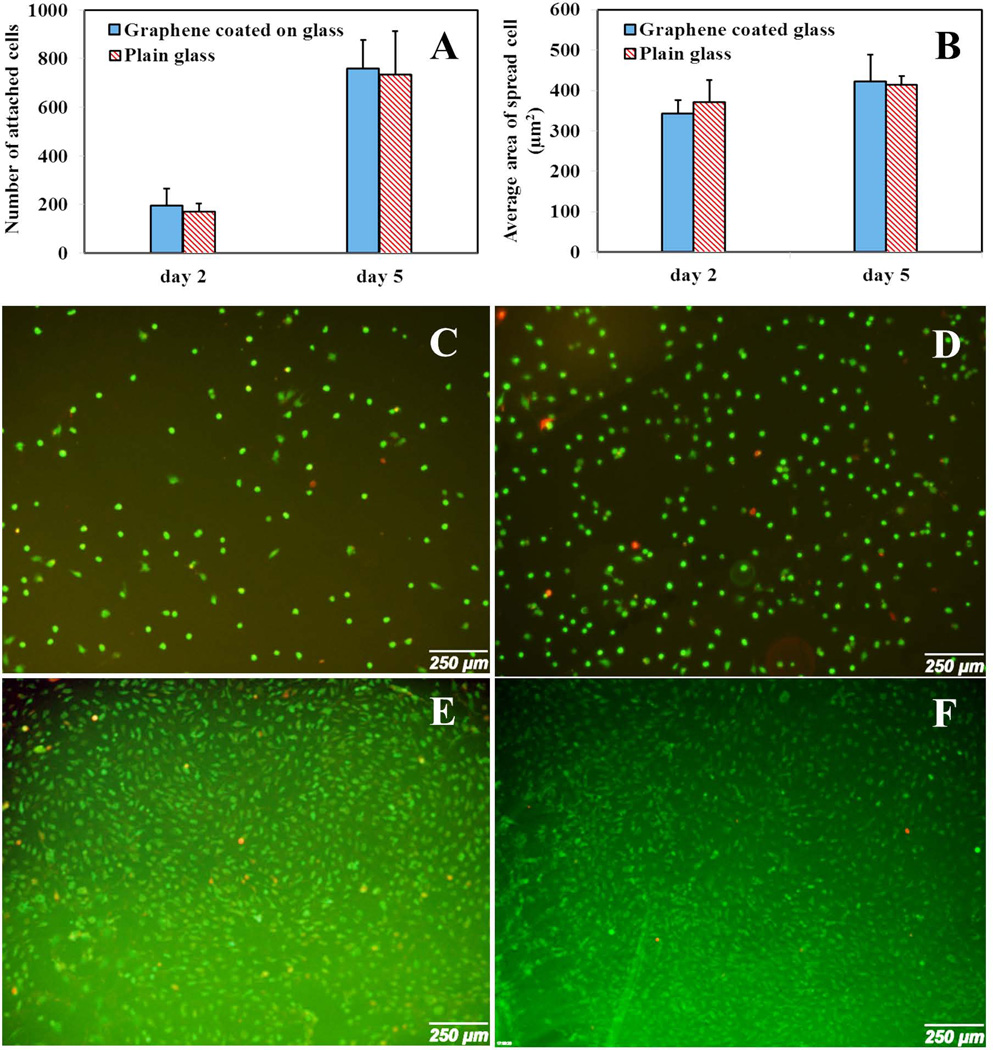
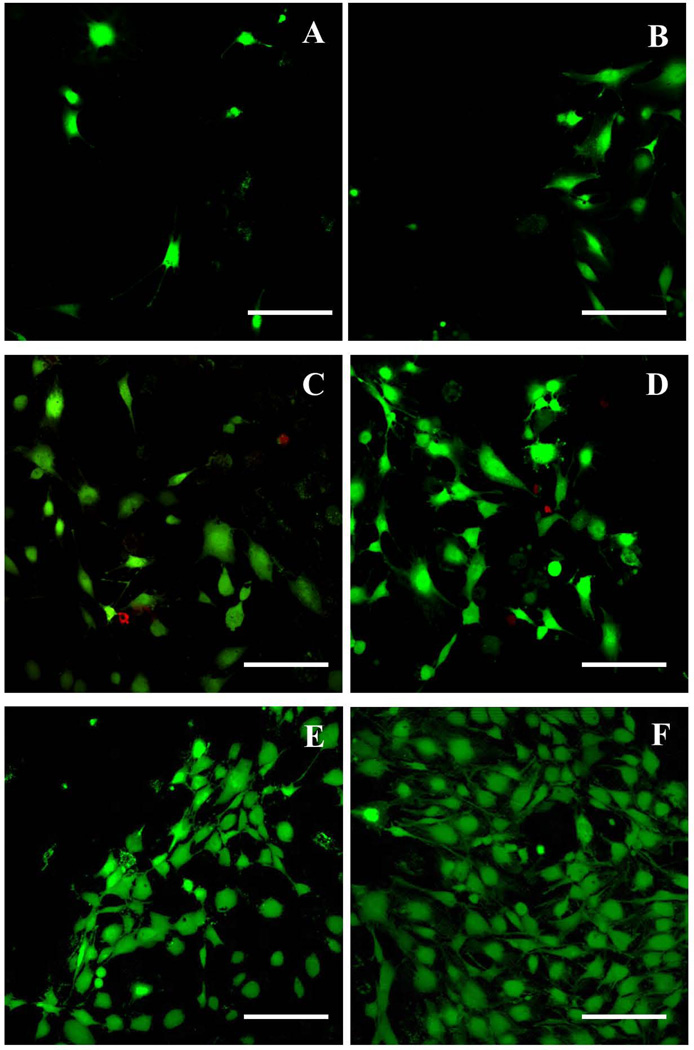
We analyzed parameters quantitatively related to cell morphology including cell morphology (size and shape) and number of attached cells. Generally, based on statistical data, the presence of graphene does not have significant effect on the shape of the cells in comparison with uncoated glass substrate. From Fig. 6A, there was no significant difference (p>0.05) in the number of attached cells between graphene coated and uncoated glass substrates demonstrating that cell growth was not affected by the presence of graphene on glass substrate at two time points. Furthermore, at day 2, the cell area was slightly bigger on the glass substrate (370±55 µm2) than on the graphene coated glass (343±33 µm2) as shown in Fig. 9A and Fig. 9B. However as shown in Fig. 6B, at higher time points, the cell area in both samples was approximately the same (413.94±21.3 µm2 and 422.74±65.3 µm2 for glass and graphene coated glass, respectively).
Fig. 6.
Cell attachment and proliferation on glass substrate with and without graphene coated layer at day 2 and day 5. (A) Number of attached cells at day 2 and day 5 for glass with and without graphene layer. (B) Average area of spread cell at day 2 and day 5 for glass with and without graphene layer. (C) Cell spreading on glass substrate at day 2. (D) Cell spreading on graphene coated glass substrate at day 2. (E) Cell spreading on glass substrate at day 5. (F) Cell spreading on graphene coated glass substrate at day 5.
Fig. 9.
High magnification images to show cell morphology on different substrates at day 2. (A) Glass substrate without graphene coated layer. (B) Graphene coated glass substrate (C) Silicon wafer substrate without graphene layer. (D) Graphene coated silicon wafer substrate. (E) Stainless steel without graphene coated layer. (F) Graphene coated Stainless steel substrate. Scale bar=200 µm.
After two days, we found that the osteoblasts homogeneously covered in both substrates and cells did not demonstrate the well elongated structure (Fig. 6C and Fig. 6D). At day 5, cells were more confluent than day 2. It can also be concluded from the images that more cells were attached on the graphene coated substrate (759.8±117.8) than on pure glass substrate (735.11±177.7) but the difference was not significant (p>0.05) (Fig. 6E and Fig. 6F). At day 5, cultured osteoblasts were homogeneously dispersed on the surfaces of graphene coated substrates and plain glass substrates on the surface and showed more distributed morphology in comparison with day 2.
As Fig. 6 shown, graphene layer exhibited low cytotoxicity. The survival rate is defined as the average ratio of live cells (Green) to dead cells (Red). Based on this definition, cell survival rate was more than 90% for graphene layer deposited on glass substrate and the prestine glass substrate. Thoeritically, the survival rate is close to 100% for healthy cells. Any remarkable difference in the osteoblasts growth and attachment between graphene coated and pristine glass samples was not observed for both time points (day 2 and day 5). This statement was in agreement with the research work reported by Park et al. [16]. However, they demonstrated graphene coated glass samples showed higher percentage of cell attachment after two and three weeks for neural cells. We did not extend the time points to two or three weeks as the purpose of this work was to test the selectivity of different substrates under given time points. This result suggests that graphene does not hamper the normal growth of osteoblast and that the incorporation of this material on glass substrate would not affect the physiological conditions of the microenvironment at the selected time points.
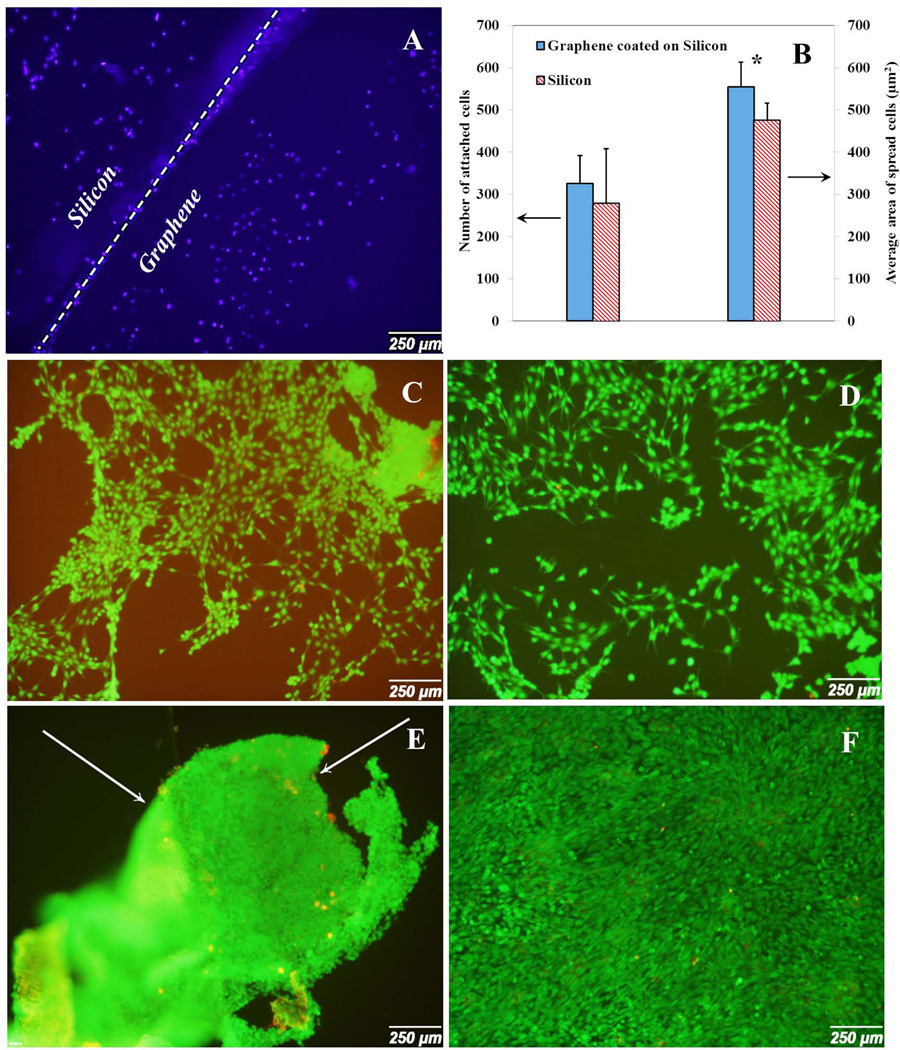
In order to evaluate the biocompatibility of CVD grown graphene films on silicon substrate, two groups of samples were examined: silicon wafer with graphene layers and without graphene layers. DAPI was used to stain cell nucleus at the boundary edge of silicon wafer and graphene coated silicon at day 2. As it is shown in Fig. 7A, higher number of cells was attached to the graphene coated layer in comparison with silicon wafer substrate. In other words, osteoblasts clearly preferred graphene coated substrate than silicon wafer. This behavior was also confirmed by counting attached cells (Fig. 7B). The number of cells for graphene coated silicon (326.11±60.7) was higher than pure silicon wafer (279.68±70.2) at day 2. Furthermore, the high maginification images (Fig. 9C and Fig. 9D) demonstrated that the average spread area of cells attached to the graphene coated substrate (475.21±69.6 µm2) was significantly larger than silicon wafer (279.68±70.2 µm2) at day 2. In addition, cells were uniformely distributed and covered the substrates (Fig. 7C and Fig. 7D). It has been proven that the cell morphology and structure described differentiation and proliferation [14]. It is worth noting that the elongated and well-distributed cell morphology on the surface showed filopodia extension and cellular propagation fronts. Cells attached to the silicon wafer had more circular and undeveloped morphology with smoother edges (Fig. 9C). However, as observed in high magnification images (Fig. 9D), cells attached to graphene coated substrate exhibited more spread nature. In the short time period, the attachment rates, was very similar to the pure silicon wafer with just a slightly higher value. This is in agreement with some previous works [22]. Although at short time points, silicon wafer samples exhibited acceptable cell attachment, there was a significant difference between the spread cell area in silicon with graphene layer and silicon wafer itself. At day 5, cells were confluent on both groups of samples, showing none of the groups had toxic effect (Fig. 7E and Fig. 7F). The cell viability indicated that the graphene layer was cell-friendly and biocompatible. In addition, the spread area was bigger on graphene coated substrates than on the silicon wafer.
Fig. 7.
Cell attachment and proliferation on silicon wafer substrate with and without graphene coated layer at day 2 and day 5. (A) DAPI stained the cell nucleus at the border of graphene and silicon at day 2. (B) Number of attached cells and average area of spread cells at day 2 for silicon wafer with and without graphene layer. (C) Cell spreading on silicon substrate at day 2. (D) Cell spreading on graphene coated silicon wafer substrate at day 2. (E) Cell spreading on silicon wafer substrate at day 5. (F) Cell spreading on graphene coated silicon wafer substrate at day 5. Arrows show the detachment of cell layer from the substrate.
It is worth noticing that the silicon might not be an ideal substrate based on poor cell attachment. However, it is clearly distinct from Fig. 7 that a good number of cells proliferated on graphene coated silicon substrate. At day 5, we could not perform the quantitative analysis for silicon samples due to the detachment of cells from the substrate. In contrast, the graphene coated samples showed better cell adhesion and spreading.
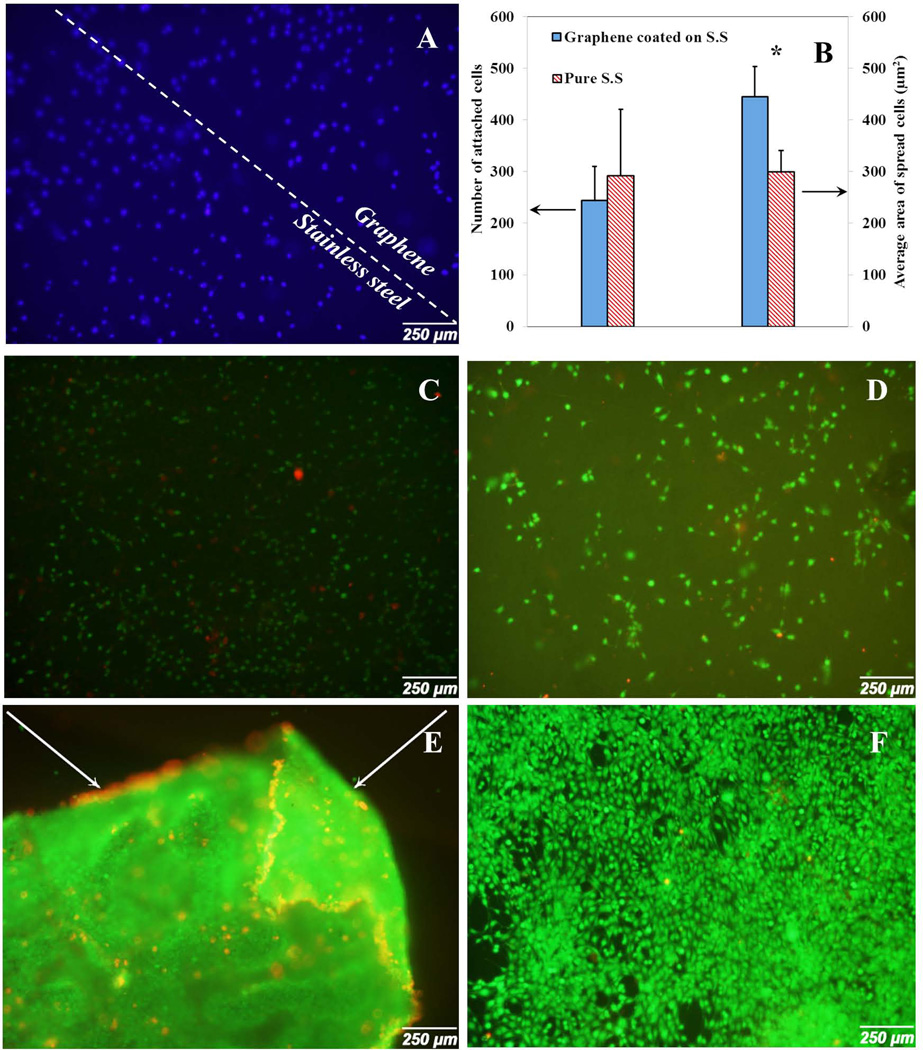
Stainless steel has been used as a biocompatible material for a long time [32]. However, there are no papers regarding the effect of graphene coated stainless steel on cell behavior. In this paper, we evaluated the effect of graphene coated stainless steel on cell attachment and proliferation. DAPI cell nucleus straining showed no remarkable difference between the numbers of attached cells on stainless steel with and without graphene layer (Fig. 8A). At day 2, pristine stainless steel substrate showed slightly higher attached cell number (292.2±128.08) in comparison with graphene coated substrate (244.11±65.9). On the other hand, the average spread cell area related to graphene coated stainless steel sample (444.85±58.63 µm2) was significantly larger than the stainless steel substrate (300.23±40.59 µm2) as shown in Fig. 8B. This result showed that graphene coated on stainless steel could also improve cell spreading in short time points. At day 2, attached cells on stainless steel substrate showed more circular morphology (Fig. 9C) in comparison with the graphene coated stainless steel (Fig. 9D). Osteoblasts uniformly covered over the graphene coated stainless steel substrate and no evidence of graphene toxicity was observed (Fig. 8C and Fig. 8D).
Fig. 8.
Cell attachment and proliferation on stainless steel substrate with and without graphene coated layer at day 2 and day 5. (A) DAPI stained the cell nucleus on stainless steel substrate at day 2. (B) Number of attached cells and average area of spread cells at day 2 for stainless steel with and without graphene layer. (C) Cell spreading on stainless steel substrate at day 2. (D) Cell spreading on graphene coated stainless steel substrate at day 2. (E) Cell spreading on stainless steel substrate at day 5. (F) Cell spreading on graphene coated stainless steel substrate at day 5. Arrows show the detachment of cell layer from the substrate.
As demonstrated in Figures 8E and 8F, at day 5, graphene coated stainless steel samples showed a high number of spread cells while the cells on stainless steel substrate detached from the surface and quantitative analysis could not be performed. The observation confirmed that although stainless steel did not have cytotoxic properties, cell adhesion was poor in comparison with the graphene coated stainless steel samples.
Considering all three samples without graphene coated layer, silicon wafer and stainless steel substrate demonstrated best cell attachment and higher number of attached cells was found in comparison with the glass substrate. This observation can be interpreted as the effect of surface stiffness and roughness. Ponsonnet et al. [33] and Deligianni et al. [34, 35] showed that surface roughness affected the cell behavior. In this study, the cell viability on each substrate was not greatly affected by surface roughness of the substrate. Although stainless steel had higher surface roughness in comparison with silicon, the number of attached cells was almost equal in both samples. The reason probably is the surface roughness of the substrates (Ra (Roughness absolute value)= 0.11. 0.32 and 2.5 nm for glass, silicon and stainless steel respectively based on manufacturer specifications) did not involve a wide value range to induce observable differences in cell attachment [22].
Investigating cell spread area of three substrates revealed a difference between silicon wafer and other two substrates. An important factor which greatly influences the cell attachment and proliferation is substrate stiffness or elastic modulus. Cells can sense lower lying layers down to several micrometers [36]. It has been demonstrated that substrate matrix elasticity can direct the stem cell lineage proliferation [37]. The specific behavior of osteoblasts on different graphene substrates has not yet been investigated. Because of the presence of few nanometer thickness graphene layers, cells could sense the stiffer underlying layers. The overall results approved that the stiffer substrate was more cell-friendly. However, no evidence was found to show that cells can sense the substrate elastic modulus more than few hundred kilopascals (kPa) [36, 38]. Another effect of graphene layers is that it can enhance vinculin protein for cell attachment [20]. Cell spread area on silicon wafer and stainless steel substrate with graphene coated layers showed significant difference in comparison with silicon wafer and stainless steel. Detaching cells from the silicon and stainless steel substrate without graphene layer is a strong evidence of strong attachment of cells in the presence of graphene layer.
The mechanism of how graphene can improve cell adhesion is still not understood. The differences in cell attachment rates may be attributed to absorption levels of various adhesion proteins such as vinculin and fibronectin on the different substrates [39]. In the presence of graphene molecules, these proteins were more effectively adsorbed on the substrate.
In addition, the ability of graphene to sustain stress could play a more important role in the context of providing just the right amount of local cytoskeleton tension. Graphene may allow for easy out-of-plane deformation leading to the formation of strong anchor points of the cytoskeleton [24].
Furthermore, the cell density is a considerable parameter in observing the attachment properties of substrate. Surface wettability may also affect the cell attachment due to the fact that the initial phase of attachment involves the chemical linkages between surface and cells [40]. Basically, more detail studies are needed to fully uncover the interaction between cells and graphene layers of different substrates. It would also be interesting to compare the graphene layers produced by other methods, such as chemical reduction, mechanical and chemical exfoliation to understand the effect of graphene and its derivatives on cell attachment and proliferation. It would also be worth researching about cell attachments on different graphene/substrate stacks as the physical and chemical properties would greatly vary with the binding energy between the substrates and the graphene layers.
4. Conclusion
In this paper, we confirmed that CVD grown graphene did not have toxic effects on osteoblasts. Furthermore, it was demonstrated that graphene substrate greatly influenced the cell attachment behavior and morphology in the presence of graphene. Silicon wafer and stainless steel substrates with graphene layers showed great cell attachment at different time points. This result can be attributed to the effect of diverse parameters such as surface roughness, wettability, and material chemistry. However, more research is needed to investigate the effect of other material properties such as substrate hardness, high range elastic modulus, wettability and number of graphene layers. Our results indicated that graphene film could be potentially used to fabricate on diverse biomedical materials to improve osteoblast attachment and proliferation. Graphene layer fabricated on bone implant components would also decrease the healing time after surgery.
Acknowledgement
We acknowledge Dr. Madhav Gautam for his assistance to prepare the grapheme films. This work was supported by NSF grants 0652024, 0925783, and NIH grant DE019508.
References
- 1.Rao CNR, Sood AK, Subrahmanyam KS, Govindaraj A. Graphene: The New Two-Dimensional Nanomaterial. Angew Chem Int Ed. 2009;48:7752–7777. doi: 10.1002/anie.200901678. [DOI] [PubMed] [Google Scholar]
- 2.Geim AK. Graphene: status and prospects. Science. 2009;324:1530–1534. doi: 10.1126/science.1158877. [DOI] [PubMed] [Google Scholar]
- 3.Zhu Y, Murali S, Cai W, Li X, Suk JW, Potts JR, et al. Graphene and graphene oxide: synthesis, properties, and applications. Adv Mater. 2010;22:3906–3924. doi: 10.1002/adma.201001068. [DOI] [PubMed] [Google Scholar]
- 4.Schedin F, Geim A, Morozov S, Hill E, Blake P, Katsnelson M, et al. Detection of individual gas molecules adsorbed on graphene. Nat Mater. 2007;6:652–655. doi: 10.1038/nmat1967. [DOI] [PubMed] [Google Scholar]
- 5.Li X, Cai W, An J, Kim S, Nah J, Yang D, et al. Large-area synthesis of high-quality and uniform graphene films on copper foils. Science. 2009;324:1312–1314. doi: 10.1126/science.1171245. [DOI] [PubMed] [Google Scholar]
- 6.Shen H, Zhang L, Liu M, Zhang Z. Biomedical applications of graphene. Theranostics. 2012;2:283. doi: 10.7150/thno.3642. [DOI] [PMC free article] [PubMed] [Google Scholar]
- 7.Mohanty N, Berry V. Graphene-based single-bacterium resolution biodevice and DNA transistor: interfacing graphene derivatives with nanoscale and microscale biocomponents. Nano Letters. 2008;8:4469–4476. doi: 10.1021/nl802412n. [DOI] [PubMed] [Google Scholar]
- 8.Feng L, Liu Z. Graphene in biomedicine: opportunities and challenges. Nanomedicine. 2011;6:317–324. doi: 10.2217/nnm.10.158. [DOI] [PubMed] [Google Scholar]
- 9.Wang Y, Li Z, Wang J, Li J, Lin Y. Graphene and graphene oxide: biofunctionalization and applications in biotechnology. Trends Biotechnol. 2011;29:205–212. doi: 10.1016/j.tibtech.2011.01.008. [DOI] [PMC free article] [PubMed] [Google Scholar]
- 10.Kim H, Namgung R, Singha K, Oh IK, Kim WJ. Graphene Oxide–Polyethylenimine Nanoconstruct as a Gene Delivery Vector and Bioimaging Tool. Bioconj Chem. 2011;22:2558–2567. doi: 10.1021/bc200397j. [DOI] [PubMed] [Google Scholar]
- 11.He S, Song B, Li D, Zhu C, Qi W, Wen Y, et al. A graphene nanoprobe for rapid, sensitive, and multicolor fluorescent DNA analysis. Adv Funct Mater. 2010;20:453–459. [Google Scholar]
- 12.Akhavan O, Ghaderi E. Toxicity of graphene and graphene oxide nanowalls against bacteria. ACS Nano. 2010;4:5731–5736. doi: 10.1021/nn101390x. [DOI] [PubMed] [Google Scholar]
- 13.Yang K, Li Y, Tan X, Peng R, Liu Z. Behavior and Toxicity of Graphene and Its Functionalized Derivatives in Biological Systems. Small. 2013;9:1492–1503. doi: 10.1002/smll.201201417. [DOI] [PubMed] [Google Scholar]
- 14.Kalbacova M, Broz A, Kong J, Kalbac M. Graphene substrates promote adherence of human osteoblasts and mesenchymal stromal cells. Carbon. 2010;48:4323–4329. [Google Scholar]
- 15.Yang M, Yao J, Duan Y. Graphene and its derivatives for cell biotechnology. Analyst. 2012;138:72–86. doi: 10.1039/c2an35744e. [DOI] [PubMed] [Google Scholar]
- 16.Park SY, Park J, Sim SH, Sung MG, Kim KS, Hong BH, et al. Enhanced differentiation of human neural stem cells into neurons on graphene. Adv Mater. 2011;23:H263–H267. doi: 10.1002/adma.201101503. [DOI] [PubMed] [Google Scholar]
- 17.Akhavan O, Ghaderi E, Emamy H, Akhavan F. Genotoxicity of graphene nanoribbons in human mesenchymal stem cells. Carbon. 2013;54:419–431. [Google Scholar]
- 18.Chang Y, Yang ST, Liu JH, Dong E, Wang Y, Cao A, et al. In vitro toxicity evaluation of graphene oxide on A549 cells. Toxicol Lett. 2011;200:201–210. doi: 10.1016/j.toxlet.2010.11.016. [DOI] [PubMed] [Google Scholar]
- 19.Wang K, Ruan J, Song H, Zhang J, Wo Y, Guo S, et al. Biocompatibility of graphene oxide. Nanoscale Res Lett. 2011;6:1–8. doi: 10.1007/s11671-010-9751-6. [DOI] [PMC free article] [PubMed] [Google Scholar]
- 20.Kalbacova M, Broz A, Kalbac M. Influence of the fetal bovine serum proteins on the growth of human osteoblast cells on graphene. J Biomed Mater Res A. 2012;100A:3001–3007. doi: 10.1002/jbm.a.34231. [DOI] [PubMed] [Google Scholar]
- 21.Verdanova M, Broz A, Kalbac M, Kalbacova M. Influence of oxygen and hydrogen treated graphene on cell adhesion in the presence or absence of fetal bovine serum. Physica Status Solidi B. 2012;249:2503–2506. [Google Scholar]
- 22.Ryoo SR, Kim YK, Kim MH, Min DH. Behaviors of NIH-3T3 fibroblasts on graphene/carbon nanotubes: proliferation, focal adhesion, and gene transfection studies. ACS Nano. 2010;4:6587–6598. doi: 10.1021/nn1018279. [DOI] [PubMed] [Google Scholar]
- 23.Lim HN, Huang NM, Lim S, Harrison I, Chia C. Fabrication and characterization of graphene hydrogel via hydrothermal approach as a scaffold for preliminary study of cell growth. Int J Nanomedicine. 2011;6:1817–1823. doi: 10.2147/IJN.S23392. [DOI] [PMC free article] [PubMed] [Google Scholar]
- 24.Nayak TR, Andersen H, Makam VS, Khaw C, Bae S, Xu X, et al. Graphene for controlled and accelerated osteogenic differentiation of human mesenchymal stem cells. ACS Nano. 2011;5:4670–4678. doi: 10.1021/nn200500h. [DOI] [PubMed] [Google Scholar]
- 25.Seif-Naraghi SB, Christman KL. Tissue Engineering and the Role of Biomaterial Scaffolds. Resident Stem Cell Regen Ther. 2012:43. [Google Scholar]
- 26.Gautam M, Jayatissa AH. Detection of organic vapors by graphene films functionalized with metallic nanoparticles. J Appl Phys. 2012;112:114326. [Google Scholar]
- 27.Gautam M, Jayatissa AH. Adsorption kinetics of ammonia sensing by graphene films decorated with platinum nanoparticles. J Appl Phys. 2012;111:094317. [Google Scholar]
- 28.Ferrari A, Meyer J, Scardaci V, Casiraghi C, Lazzeri M, Mauri F, et al. Raman spectrum of graphene and graphene layers. Physical Rev Lett. 2006;97:187401. doi: 10.1103/PhysRevLett.97.187401. [DOI] [PubMed] [Google Scholar]
- 29.Suk JW, Kitt A, Magnuson CW, Hao Y, Ahmed S, An J, et al. Transfer of CVD-grown monolayer graphene onto arbitrary substrates. ACS Nano. 2011;5:6916–6924. doi: 10.1021/nn201207c. [DOI] [PubMed] [Google Scholar]
- 30.Novoselov K, Geim AK, Morozov S, Jiang D, Grigorieva IV, Dubonos S, et al. Two-dimensional gas of massless Dirac fermions in graphene. Nature. 2005;438:197–200. doi: 10.1038/nature04233. [DOI] [PubMed] [Google Scholar]
- 31.Reina A, Jia X, Ho J, Nezich D, Son H, Bulovic V, et al. Large area, few-layer graphene films on arbitrary substrates by chemical vapor deposition. Nano Letters. 2008;9:30–35. doi: 10.1021/nl801827v. [DOI] [PubMed] [Google Scholar]
- 32.Müller R, Abke J, Schnell E, Macionczyk F, Gbureck U, Mehrl R, et al. Surface engineering of stainless steel materials by covalent collagen immobilization to improve implant biocompatibility. Biomaterials. 2005;26:6962–6972. doi: 10.1016/j.biomaterials.2005.05.013. [DOI] [PubMed] [Google Scholar]
- 33.Ponsonnet L, Reybier K, Jaffrezic N, Comte V, Lagneau C, Lissac M, et al. Relationship between surface properties (roughness, wettability) of titanium and titanium alloys and cell behaviour. Mater Sci Eng C. 2003;23:551–560. [Google Scholar]
- 34.Deligianni D, Katsala N, Ladas S, Sotiropoulou D, Amedee J, Missirlis Y. Effect of surface roughness of the titanium alloy Ti–6Al–4V on human bone marrow cell response and on protein adsorption. Biomaterials. 2001;22:1241–1251. doi: 10.1016/s0142-9612(00)00274-x. [DOI] [PubMed] [Google Scholar]
- 35.Deligianni DD, Katsala ND, Koutsoukos PG, Missirlis YF. Effect of surface roughness of hydroxyapatite on human bone marrow cell adhesion, proliferation, differentiation and detachment strength. Biomaterials. 2000;22:87–96. doi: 10.1016/s0142-9612(00)00174-5. [DOI] [PubMed] [Google Scholar]
- 36.Discher DE, Janmey P, Wang Y. Tissue cells feel and respond to the stiffness of their substrate. Science. 2005;310:1139–1143. doi: 10.1126/science.1116995. [DOI] [PubMed] [Google Scholar]
- 37.Engler AJ, Sen S, Sweeney HL, Discher DE. Matrix elasticity directs stem cell lineage specification. Cell. 2006;126:677–689. doi: 10.1016/j.cell.2006.06.044. [DOI] [PubMed] [Google Scholar]
- 38.Palchesko RN, Zhang L, Sun Y, Feinberg AW. Development of polydimethylsiloxane substrates with tunable elastic modulus to study cell mechanobiology in muscle and nerve. PloS one. 2012;7:e51499. doi: 10.1371/journal.pone.0051499. [DOI] [PMC free article] [PubMed] [Google Scholar]
- 39.Shi X, Chang H, Chen S, Lai C, Khademhosseini A, Wu H. Regulating Cellular Behavior on Few-Layer Reduced Graphene Oxide Films with Well Controlled Reduction States. Adv Funct Mater. 2012;22:751–759. [Google Scholar]
- 40.Akasaka T, Yokoyama A, Matsuoka M, Hashimoto T, Watari F. Thin films of single-walled carbon nanotubes promote human osteoblastic cells (Saos-2) proliferation in low serum concentrations. Mater Sci Eng C. 2010;30:391–399. [Google Scholar]


