Abstract
Protein condensations, such as crystallization, liquid-liquid phase separation, aggregation, and gelation, have been observed in concentrated antibody solutions under various solution conditions. While most IgG antibodies are quite soluble, a few outliers can undergo condensation under physiological conditions. Condensation of IgGs can cause serious consequences in some human diseases and in biopharmaceutical formulations. The phase transitions underlying protein condensations in concentrated IgG solutions is also of fundamental interest for the understanding of the phase behavior of non-spherical protein molecules. Due to the high solubility of generic IgGs, the phase behavior of IgG solutions has not yet been well studied. In this work, we present an experimental approach to study IgG solutions in which the phase transitions are hidden below the freezing point of the solution. Using this method, we have investigated liquid-liquid phase separation of six human myeloma IgGs and two recombinant pharmaceutical human IgGs. We have also studied the relation between crystallization and liquid-liquid phase separation of two human cryoglobulin IgGs. Our experimental results reveal several important features of the generic phase behavior of IgG solutions: (1) the shape of the coexistence curve is similar for all IgGs but quite different from that of quasi-spherical proteins; (2) all IgGs have critical points located at roughly the same protein concentration at ∼100 mg/ml while their critical temperatures vary significantly; and (3) the liquid-liquid phase separation in IgG solutions is metastable with respect to crystallization. These features of phase behavior of IgG solutions reflect the fact that all IgGs have nearly identical molecular geometry but quite diverse net inter-protein interaction energies. This work provides a foundation for further experimental and theoretical studies of the phase behavior of generic IgGs as well as outliers with large propensity to condense. The investigation of the phase diagram of IgG solutions is of great importance for the understanding of immunoglobulin deposition diseases as well as for the understanding of the colloidal stability of IgG pharmaceutical formulations.
I. INTRODUCTION
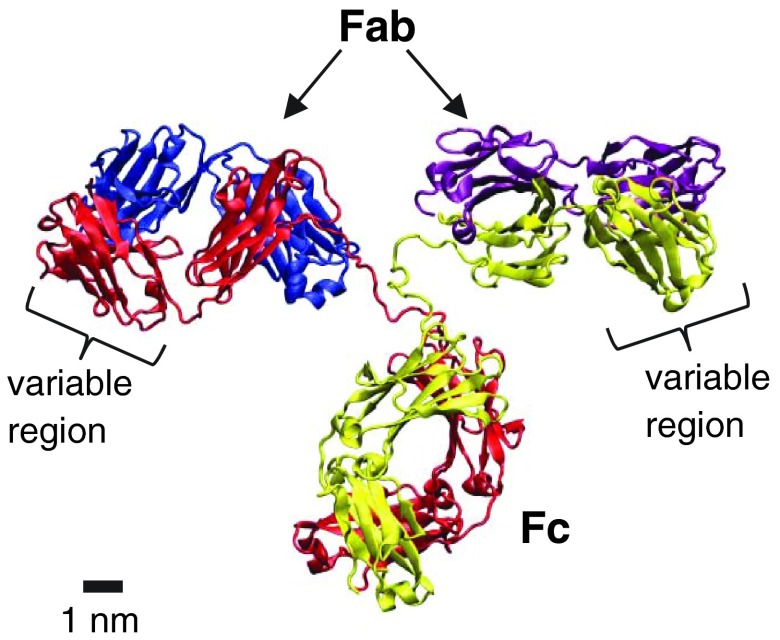
Antibodies, particularly the IgG type, are a very important class of proteins: they play a crucial physiological role in the human immune systems;1 they are increasingly used as drugs to treat many diseases including autoimmune diseases and various cancers;2 they are also ubiquitously used to label target epitopes in biological and medical research and diagnostics.3 All IgGs share a common genetic basis and have the same size and conformation as that shown in Fig. 1. On the other hand, all IgGs differ in their specific sequence of amino acids in the variable domains (i.e., the antigen-binding domains, Fab) which are randomly created through V(D)J recombination and somatic mutations. It is well known that the specific amino acid sequence in Fab of an IgG determines its key biological function, i.e., the ability to selectively bind to a particular antigen. However, there is little awareness of the fact that some amino acid sequences of Fab can produce a significant increase in the overall net attractive inter-protein interaction between IgG molecules. The net attractive inter-protein interaction causes various types of protein condensation including crystallization, liquid-liquid phase separation (LLPS), reversible aggregation, and gelation.4–6 Being a plasma protein, a typical IgG is highly soluble at physiological conditions. Nevertheless, sometimes the solubility can be lost. Indeed, observations of protein condensation in IgG solutions have been reported recently both for recombinant pharmaceutical IgGs and for monoclonal IgGs (so-called cryoglobulins) from multiple myeloma patients with cryoglobulinemia syndrome.7–15 The frequency of detectable IgG cryoglobulins implies that the likelihood of a random IgG being capable of condensation under physiological conditions is as high as 10%.16 This is a significant probability. It means that in the enormous repertoire of antibodies, everyone carries such condensable antibodies, but generally at harmless, very low concentrations just as it is in the asymptomatic monoclonal cryoglobulinemia.16,17
FIG. 1.
X-ray crystallographic structure of an IgG molecule. The graph is generated from the data (DOI: 10.2210/pdb1IGT/pdb) in the Protein Data Bank using VMD 1.9.1 and POV-Ray 3.6. In this graph, two identical heavy chains (red and yellow) and two identical light chains (blue and purple) consist of two identical “antigen-binding domains” (Fab) and one “crystallizable domain” (Fc).
At sufficiently high concentrations non-specific attractive interactions between IgG molecules can cause protein condensation in solution. In fact, IgGs can be at fairly high concentrations in-vivo. The concentration of total IgG in blood is normally within 10–25 mg/ml.18 The concentration of a particular IgG during an acute immunological response can reach several mg/ml. In the special case of multiple myeloma, the concentration of monoclonal IgG can be above 70 mg/ml.19 Furthermore, a significant increase in concentration of all plasma proteins, including antibodies, occurs in the kidneys, in the process of ultrafiltration.20 Concentrated IgG solutions are also common in pharmaceutical applications, where a large dose of antibody is needed to achieve the desired therapeutic effect. In such cases antibody drugs are stored and administered in concentrations up to 100 mg/ml.21 In concentrated IgG solutions, condensation of intact protein molecules takes place in the form of phase transitions, i.e., crystallization and LLPS, or closely related phase transformations such as colloidal aggregation and gelation.7–15 The conditions under which such protein condensation can occur are fully described using a phase diagram.22,23 Therefore, systematic studies of phase behavior and phase diagrams of IgG solutions are essential for understanding the pathological condensation of antibodies in the human body as well as the colloidal stability of antibody drug formulations.
The phenomena of crystallization, LLPS, and aggregation are common in solutions of globular proteins. In a typical phase diagram of a protein solution, there are two phase transition boundaries, i.e., the solubility line (liquidus line) for crystallization and the coexistence curve for LLPS. Phase diagrams of quasi-spherical proteins are well studied both experimentally and theoretically.22,24–34 The theoretical model of hard spheres with short-ranged aeolotopic attraction well describes the solution properties of such quasi-spherical proteins.24 In particular, it correctly predicts the metastability of LLPS relative to crystallization and aggregation and explains why the omnipresent LLPS is often preempted by either crystallization or aggregation. Still, direct observations of LLPS in globular protein solutions are abundant.35–39 The conclusions regarding the features of phase diagram of compact globular proteins may not be applicable to Y-shaped IgGs. In fact, we have found in previous work that the critical concentration for IgGs is markedly smaller than that for quasi-spherical proteins.8 On the other hand, the identical molecular geometry of IgG molecules suggests that the phase diagram of different IgGs should show some common features. A systematic body of experimental knowledge is now needed to establish the universal features of phase behavior of IgG solutions as distinct from that of quasi-spherical proteins.
Recently, for some IgGs, phase transitions have been observed at various non-physiological solution conditions, e.g., low ionic strength or high pH.9–14 In physiological solutions, phase transitions of IgGs (with rare exceptions) actually lie below the solution freezing point. Nevertheless, the phase boundaries below the freezing point can still be located by adding to the protein solution a non-ionic protein precipitant, polyethylene glycol (PEG).40–43 PEG introduces a well-defined attraction between proteins in solution via so-called depletion forces.44–46 Depletion forces originate from steric exclusion of PEG from the contact area between the protein molecules. Thus, PEG does not change the native inter-protein interaction with the rare exceptions when it binds to proteins. PEG-induced attraction increases the temperature at which the LLPS occurs and at sufficient PEG concentration “lifts” the phase separation temperatures above the solution freezing point. By measuring the phase boundaries at different PEG concentrations, the entire coexistence curve of a pure IgG solution, which is below the freezing point of solution, can then be determined by extrapolating to zero PEG concentration as has been done for quasi-spherical proteins.40–42 Using this method, we systematically investigated the LLPS of ten different human IgGs including eight myeloma IgGs and two pharmaceutical IgGs. We demonstrated experimentally that the identical geometry of IgG molecules indeed translates into a high degree of universality of the coexistence curve describing LLPS.
In the liquid phase, protein molecules can move freely and thus the averaged inter-protein interaction does not depend on the specific spatial configuration of IgG molecules in the solution. In contrast, different IgGs may have different crystal structures and the net inter-protein interaction strongly depends on the specific structure of crystal. Thus, solubility lines, which characterize crystallization of different IgGs, are expected to show more variability from one IgG to another than the coexistence curves show. Most IgGs are not easy to crystallize. However, some myeloma IgGs, the so-called cryoglobulins, overproduced in patients with cryoglobulinemia symptoms readily crystallize under physiological condition.15 The cryoglobulins have allowed us to study their whole phase diagram.
The phase diagram of IgG solutions is largely terra incognita because IgGs are generally highly soluble and the phase boundaries lie below the solution freezing point. In this work, we map out the generic phase diagram of IgG solutions and address three important questions regarding the phase behavior of IgG solutions. First, to what extent is the shape of the LLPS phase boundary universal for different IgGs and how do these universal features differ from that of spherical proteins? Second, what is the distribution of the LLPS critical temperatures of human IgGs under physiological solution conditions? Third, is the LLPS in IgG solutions metastable with respect to crystallization as it is for quasi-spherical proteins? The knowledge of these basic features of the IgG phase diagram lays the foundation for experimental studies of solution properties of IgGs of particular interest in human diseases or drug formulations. Our work also provides a basis for further experimental and theoretical studies of the generic characteristics of phase diagram of solutions of non-spherical proteins generally.
II. MATERIALS AND METHOD
A. Materials
Natural human IgGs were purified from blood samples. Blood samples of multiple myeloma patients containing high concentration of monoclonal IgGs were provided by the Dana Farber Cancer Institute (DFCI). The studies in this work were approved by the DFCI Institutional Review Board and the MIT Committee On the Use of Humans as Experimental Subjects. The patients’ informed consent were obtained and documented at DFCI. Eight natural human IgGs (M7, M8, M12, M14, M15, M16, M23, and M31) were purified using the procedures previously described by us.15 Briefly, peripheral blood was collected in green-top tubes with sodium heparin at DFCI. To avoid possible cryoprecipitation of IgGs, purification procedures were conducted at 37 °C. Blood plasmas were separated from the samples by centrifugation at 5000×g for 7 min. The total IgGs were extracted using protein G affinity chromatography. The chromatographic fractions of IgGs were collected and tested for the absence of serum albumin using sodium dodecyl sulfate polyacrylamide gel electrophoresis (SDS-PAGE).15 The IgG solutions were then dialyzed into the phosphate saline buffer (PBS: 1.7 mM KH2PO4, 5 mM Na2HPO4, 0.15 M NaCl, pH 7.4). The total IgG of each patient consists of a major fraction of the overproduced monoclonal IgG (M-protein) and all other IgGs at normal low concentration. The fraction of M-proteins in the total IgGs of our samples ranges from ∼30% to ∼80%, as estimated from the elevated blood IgG concentration above the normal average level. The M23 and M31 IgGs were obtained from multiple myeloma patients having cryoglobulinemia symptoms. These so-called “cryoglobulins” can readily crystallize in PBS. Thus, the M23 and M31 IgG cryoglobulins were further purified by recrystallization (3 times) at 4 °C. The purity of cryoglobulins in the final solution was tested by SDS-PAGE.15 The IgG concentration was determined by UV absorbance at 280 nm using an extinction coefficient of 1.4 l/g cm.47 All eight myeloma human IgGs in our study belong to the IgG1 subclass.15
Two high-purity recombinant human monoclonal antibodies (P1 and P2) were produced at Amgen Inc. Both P1 and P2 are pharmaceutical antibodies and belong to the human IgG2 subclass. The proteins were exhaustively dialyzed into PBS buffer.
Polyethylene glycol with molecular weight 3350 Da (PEG3k) in the powder form was purchased from Sigma Aldrich. The salts used to prepare PBS buffer were also purchased from Sigma Aldrich. The protein solutions with known PEG concentration were prepared by weighing. The total solution volume was calculated using the specific volumes 0.71 ml/g for proteins48 and 0.84 ml/g for PEG.49
B. Turbidity measurement
In the turbidity method, a test tube containing the sample was placed in a thermostated light-scattering stage, whose temperature was initially set to be high enough so that the solution was homogenous. A laser beam (He-Ne 4 mW, 633 nm) was passed through the sample, and the transmitted light intensity was detected by a photodiode and registered to a power meter (1936-C, Newport). The temperature of the sample was then lowered by 0.2 °C every 5 min. At a particular temperature, Tcloud, the sample became visibly cloudy and the transmitted intensity rapidly dropped. This clouding marks the onset of phase separation and is due to the formation of small droplets of protein-rich phase in dilute solution or small droplets of protein-poor phase in concentrated solution. The temperature was then raised and the sample became clear again. The temperature at which clarification occurs is denoted by Tclear. The average of Tcloud and Tclear was taken as the LLPS temperature Tph. The temperature hysteresis Tclear – Tph was taken as the error of Tph.
For the two cryoglobulins M23 and M31, the fast crystallization interferes with observation of LLPS. Thus, Tphs had to be measured within a time window before crystallization occurs. A second method of turbidity measurements was used. The samples freshly prepared at 37 °C were brought to a lower temperature. At this fixed temperature, the transmitted light intensity was monitored as a function of time. The elapsed time before transmitted intensity sharply decreases was recorded as the induction time for clouding. The induction time was measured at step-wisely decreasing temperatures at an interval of 0.5 °C. Since nucleation of protein crystals is relatively slow, crystallization is characterized by an induction time much longer than that of LLPS. Thus, the maximum temperature at which induction time sharply decreases was taken as Tph. Formation of droplets under the LLPS conditions was confirmed under light microscope. Tph of cryoglobulin IgGs were not measured at high protein concentrations, because crystallization is too fast to be distinguished from LLPS by measuring induction time.
C. Quasielastic light scattering (QLS)
All protein samples were filtered through a 0.1 μm Millipore filter and placed in a test tube. QLS experiments were performed with a light-scattering apparatus using a PD2000DLSPLUS correlator (Precision Detectors) and a Coherent He-Ne laser (35 mW, 632.8 nm; Coherent Radiation). The measurements were performed at a scattering angle of 90°. The measured correlation functions were analyzed by the Precision Deconvolve 5.5 software (Precision Detectors). The correlation functions were used to calculate the apparent diffusion coefficients, D, of proteins in solutions. The hydrodynamic radius, Rh, was calculated from D using Stokes-Einstein relation, Rh = kT/6πηD, where k is the Boltzmann constant, T is the temperature, and η is the viscosity of the solvents. All QLS experiments were conducted at 21 °C. The viscosity of the PBS was measured using glass capillary viscometer (Cannon Instrument, C277). At 21 °C, η = 1.00 cP.
III. RESULTS AND DISCUSSION
A. Observation of LLPS in human IgG solutions
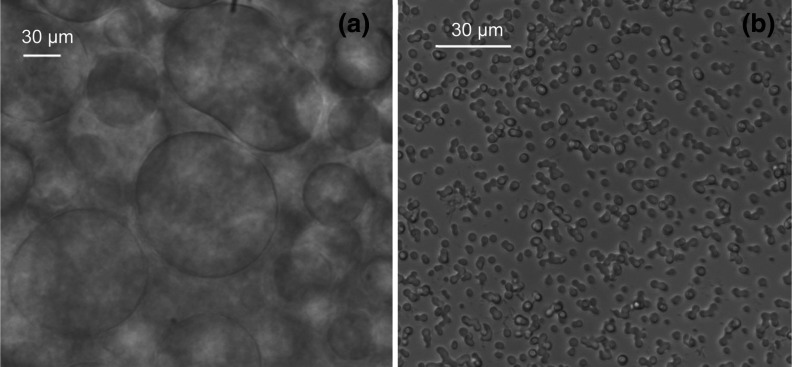
Most human IgGs are highly soluble at physiological solution conditions. Indeed, LLPS of all IgGs in our experiments (with the exception of P1) does not occur at temperatures above the freezing point (∼−7 °C) of the solutions. However, by adding sufficient amount of PEG, we were able to raise the phase separation temperatures and observe LLPS in all human IgG samples in our study. Under a light microscope, formation of liquid droplets upon phase separation was observed in both concentrated and quite dilute IgG solutions (Fig. 2). These droplets can sediment, coalesce, and eventually form a bulk concentrated solution phase. This process can be accelerated with the help of centrifugation. The newly formed protein-rich solution phase coexists with the protein-poor solution phase in thermodynamic equilibrium.
FIG. 2.
Examples of droplets of concentrated liquid phases observed with a bright field microscope upon phase separation in: (a) the solution of 98 mg/ml human myeloma IgG (M12) with 5% (w/w) PEG3k incubated at 10 °C; (b) the solution of 1 mg/ml pharmaceutical IgG (P2) with 11% (w/w) PEG3k incubated at 21 °C.
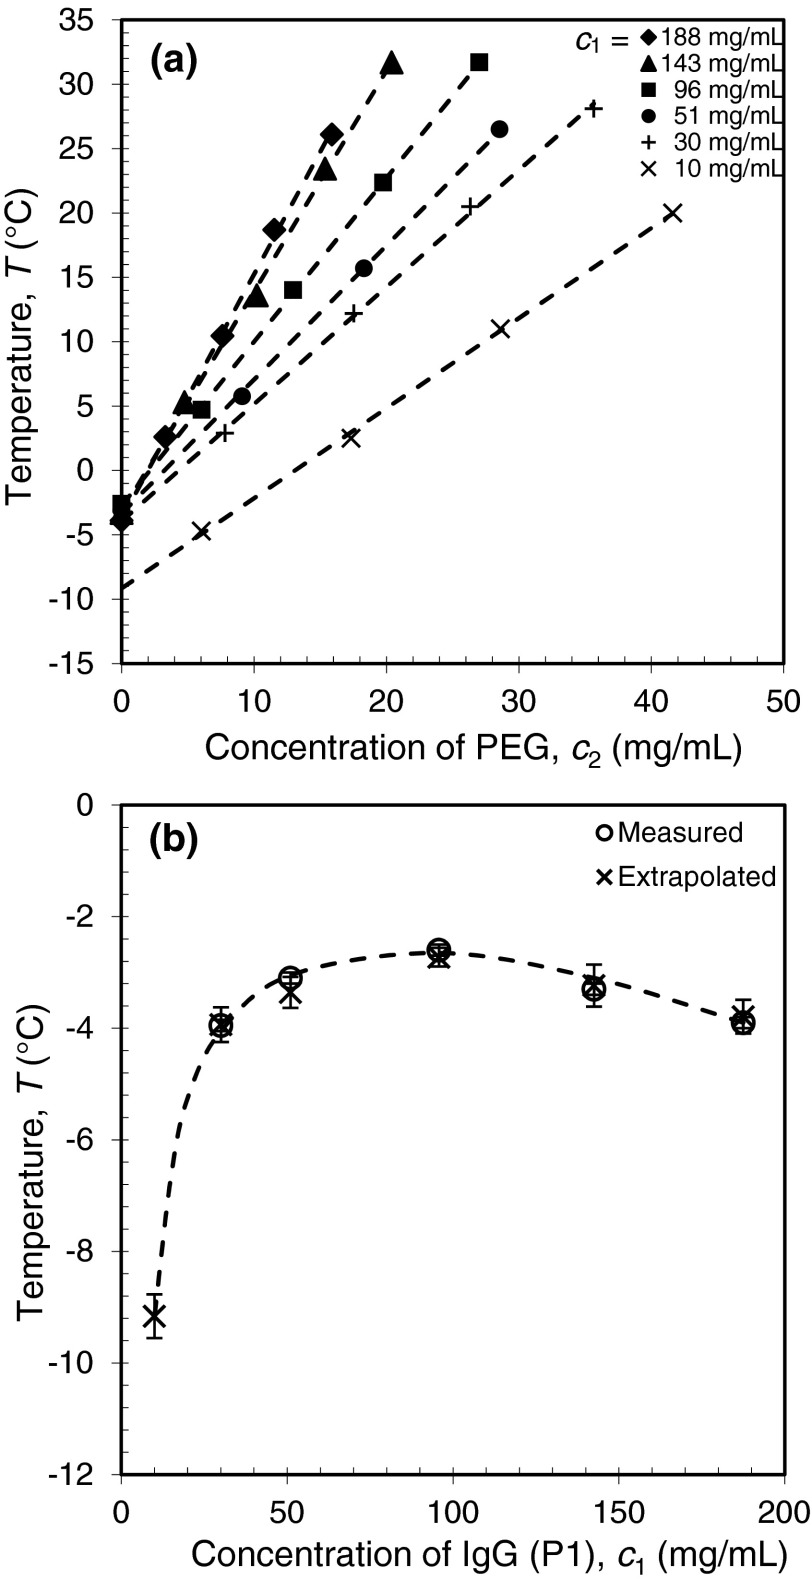
In a given IgG solution, LLPS occurs below a certain well-defined temperature which we denote as Tph. In the turbidity measurements, we have determined the Tph of IgG solutions as function of the protein concentration, c1, and the PEG concentration, c2. The results of Tph measurements for the IgG P1 are shown in Fig. 3(a). We found that the Tph increases linearly with PEG concentration c2 at fixed protein concentration. In protein solutions, the presence of PEG molecules introduces an additional attractive inter-protein interaction through the depletion effect. At relatively low PEG concentration, the PEG-PEG interaction is negligible and the linear dependency of Tph on c2 is expected.40 In most of our experiments, PEG concentration is indeed much lower than the crossover concentration ( 8% w/w)50 of the semi-dilute region. Figure 3(a) also shows that the magnitude of the slope increases as the protein concentration c1 increases. This result is consistent with the theoretical prediction that the effect of depletion interactions is more significant at higher protein concentration.40,45,46
FIG. 3.
LLPS of a pharmaceutical IgG (P1) in the presence of PEG3k. (a) LLPS temperature increases with PEG concentration at fixed IgG concentration. The dashed lines are linear fits; (b) LLPS coexistence curve determined by direct measurements as well as extrapolation to zero PEG concentration. The dashed curve is the eye guide of the coexistence curve.
P1 is an exceptional example of IgG which exhibits LLPS without PEG at temperatures above the freezing point of solution. In this case it is possible to determine Tphs both by the direct turbidity measurement without PEG and by extrapolating the Tphs in the presence of PEG to zero PEG concentration. The results are listed in Table I and the coexistence curve of P1 is plotted in Fig. 3(b). In Table I and Fig. 3(b) we show that the Tph directly measured in pure P1 solutions is consistent with the values found by linear extrapolation of the Tphs in the presence of PEG. We believe that all IgGs which have overall attractive inter-protein interactions, in principle, are able to undergo LLPS in the absence of PEG. However, the Tphs of most IgG in pure solutions at physiological pH and ionic strength are located below the freezing point. The result of Tph measurements on protein P1 confirms that, when Tph of pure IgG solutions cannot be directly measured because of solution freezing, its value can be still deduced by extrapolation of Tph in the presence of PEG.
Table I.
Liquid-liquid phase separation temperatures, Tph, of a pharmaceutical IgG (P1) and the slope of PEG concentration dependency of Tph, , as a function of the protein concentration. The deviations of directly measured Tph are calculated using Tclear – Tph indicating the hysteresis between clouding temperature and the clearing temperature. The deviations of extrapolated Tph are the errors of linear fitting of Tph versus PEG concentration c2.
| IgG concentration (mg/ml) | 10 | 30 | 51 | 96 | 143 | 188 |
|---|---|---|---|---|---|---|
| Measured Tph (°C) | … | −3.9 ± 0.2 | −3.1 ± 0.2 | −2.6 ± 0.1 | −3.3 ± 0.2 | −3.9 ± 0.2 |
| Extrapolated Tph (°C) | −9.2 ± 0.4 | −3.9 ± 0.3 | −3.4 ± 0.3 | −2.8 ± 0.2 | −3.2 ± 0.4 | −3.8 ± 0.3 |
| (°C ml/mg) | 0.70 ± 0.01 | 0.91 ± 0.01 | 1.04 ± 0.01 | 1.27 ± 0.01 | 1.72 ± 0.01 | 1.90 ± 0.04 |
B. Coexistence curves of IgGs
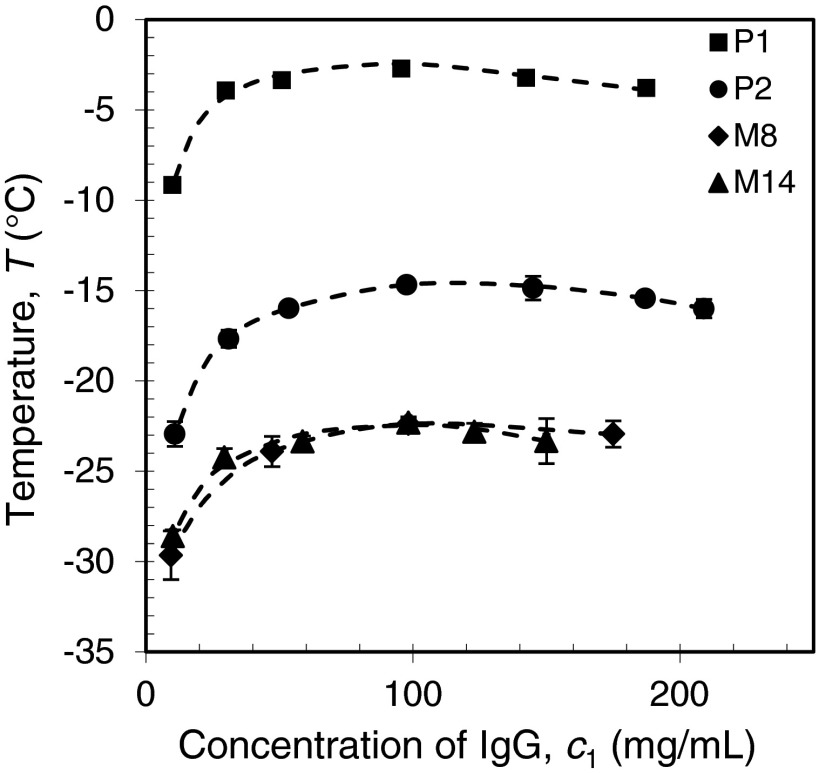
The condition of LLPS in a pure IgG solution is described by the phase boundary, Tph(c1), which is called the “coexistence curve.” We have demonstrated that Tphs of pure IgG solutions at given c1 can be deduced by extrapolating the experimental data to zero PEG concentration. In this way, we have determined the location of the coexistence curves for four IgGs (P1, P2, M8, and M14) (Fig. 4). Interestingly, the shapes of coexistence curves of different IgGs are quite similar. The curves are almost parallel to each other and are only shifted along the temperature axis. The maximum points on the coexistence curves, which are known as the critical points, are located at similar protein concentrations in the vicinity of 100 ± 10 mg/ml. This critical concentration of IgGs corresponds to a quite small critical volume fraction 0.07 ± 0.007, as calculated using the typical density of compact globular proteins (1.4 g/ml).48 This critical volume fraction is much lower than that expected for spherical particles25 which vary from 0.13 (for long range mean field interaction) to 0.27 (for short range sticky spheres). The shape of the coexistence curves is highly asymmetric. The ascending part describing the diluted phase rises sharply, while the part of the curve describing the concentrated phase is much wider.
FIG. 4.
LLPS coexistence curves of two pharmaceutical IgGs and two human myeloma IgGs. The dashed curves are the eye guides for the coexistence curves.
In our previous work on LLPS of P1, we have discussed these features of the coexistence curves of IgGs which are very different from those of quasi-spherical proteins.8 We have hypothesized that these unique features result from the extended Y-shaped geometry of the IgG molecule. The packing of non-spherical IgG molecules in the solution is expected to be quite different from that of near-spherical proteins. On the other hand, the steric packing entropy of protein molecules is the key factor determining the shape of coexistence curves. Particularly, in the mean field approximation as well as in the high temperature approximation, the free energy is completely determined by packing of protein molecules and all energetic interactions are subsumed by a single parameter that determines the location of the coexistence curve along the temperature axis.25,38,43 All IgGs have similar Y-shaped geometry, but may have different energy of net inter-protein interaction. Thus, we can hypothesize that the coexistence curves of all IgGs have similar shape, but are located at different positions along the temperature axis. The results shown in Fig. 4 are indeed consistent with this hypothesis. The location of the coexistence curve is most conveniently characterized by the critical temperature, Tc. Conversely, the experimentally determined Tc for a particular IgG is a measure of inter-protein attraction for this antibody. If the packing entropy of all IgGs is the same and the attraction between IgG molecules can be adequately represented by the single energy parameter, then Tc is proportional to this energy parameter.25
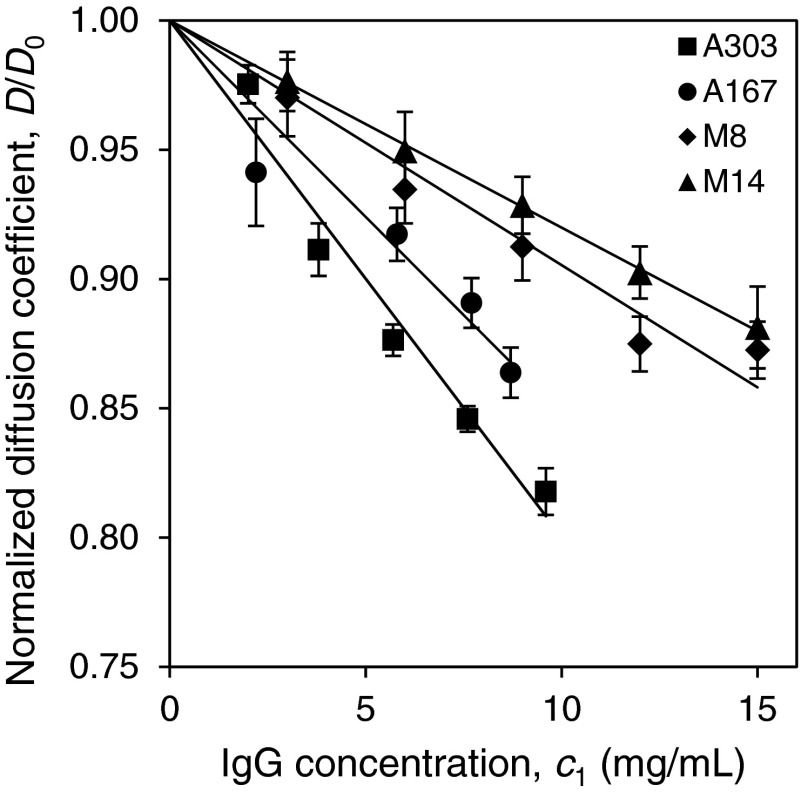
To characterize the pair-wise inter-protein interaction of the IgGs we have conducted QLS measurements in dilute IgG solutions. In QLS measurements, the diffusion coefficients, D, of IgGs were determined as a function of protein concentration. The diffusion coefficients of the IgGs in infinitely dilute solutions, D0, were obtained by extrapolating D to zero protein concentration. The hydrodynamic radii, Rh, of IgGs were calculated from D0 using the Stokes-Einstein relation. The four IgGs have the same hydrodynamic radius, Rh0 = 5.5 ± 0.1 nm. In Fig. 5, the normalized diffusion coefficients, D′ = D/D0, of four IgGs are plotted as a function of the protein concentration. The slope dD′/dc1 depends on the averaged pair-wise inter-protein interaction. The magnitude of this slope generally increases with the magnitude of inter-protein attractive interaction. In the absence of attraction between particles, dD′/dc1 is typically slightly positive as the effects of steric repulsion that accelerate diffusivity overwhelm the slow-down of diffusivity due to increased viscosity.51 Thus, the results in Fig. 5 signify that all the IgGs have attractive interactions. The magnitude of the interaction follows the order of the corresponding coexistence curves along the temperature axis. This correlation between the results of the QLS measurements and the position of the coexistence curves is consistent with the approximation that all collective net inter-protein interactions in concentrated IgG solutions are essentially averageable and can be characterized by a single effective energy parameter.
FIG. 5.
Normalized diffusion coefficients of IgGs measured by QLS as a function of the protein concentration.
The most striking feature of the coexistence curve of IgG is that the critical point occurs at volume fraction of 0.07 which is much lower than that for the spherical proteins. The reason for this low critical volume fraction may be understood by considering the packing entropy of IgG molecules. The packing entropy of protein molecules depends on the mutual exclusion volume of protein molecules. For quasi-spherical proteins, the exclusion volume for a protein molecule is approximated by that for a spherical particle having the volume of the protein molecule.24,25 However, for the extended Y-shaped IgG molecules, the exclusion volume of an IgG molecule could be much larger than the volume occupied by the molecule itself. Therefore, the observed low critical volume fraction is likely a consequence of large effective exclusion volume of IgG molecules. In addition to packing considerations, other factors such as the flexibility of IgG molecules may also affect the shape of the coexistence curve. Our experimental results can serve as a stimulus and be a basis for developing a theoretical model which accurately mimics the packing properties and the interaction energies of actual IgG molecules.
C. Propensity of IgGs to undergo LLPS
We have demonstrated that the coexistence curves of IgGs have similar shapes because of the common geometry of IgG molecules. At the same time, the diversity of the amino acid sequences of IgGs results in a variation in the magnitude of the net attractive inter-protein interaction and thereby affects the location of the coexistence curve along the temperature axis. Thus, the critical temperature Tc, the maximum of the coexistence curve, signifies the magnitude of net inter-protein interaction energy.
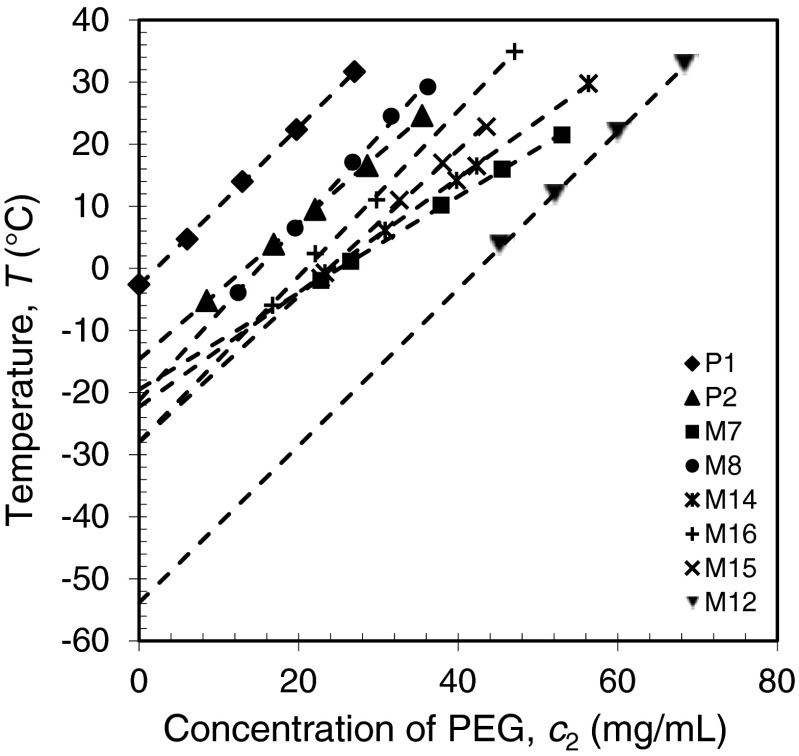
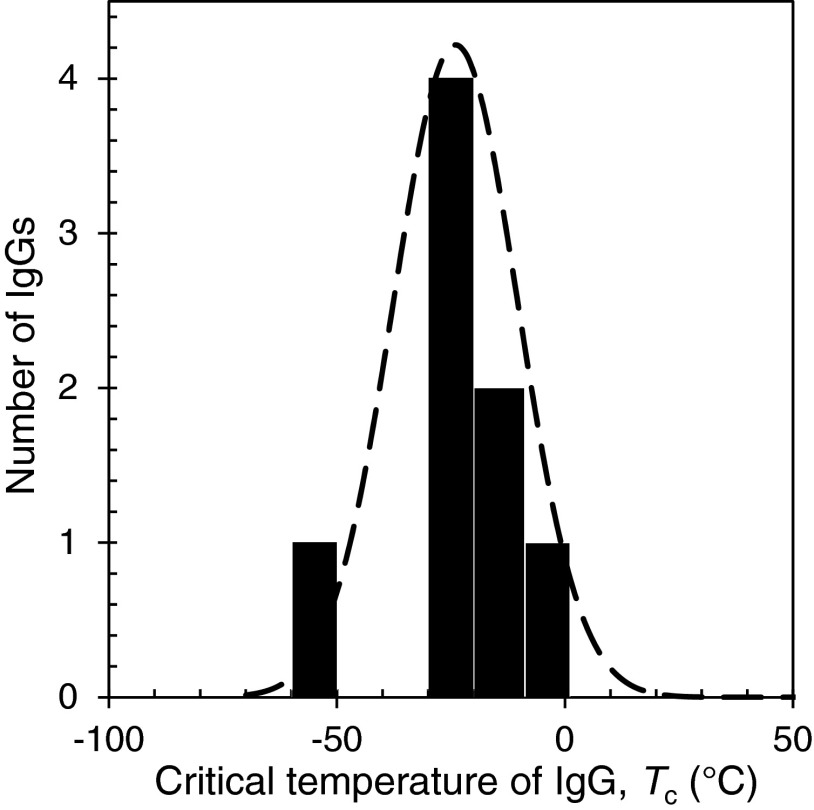
In addition to the measurements of the complete coexistence curves for the four IgGs shown in Fig. 4, we have measured the Tph for four other human IgGs (M7, M12, M15 and M16) in the vicinity of their critical points (at 98 mg/ml) (Fig. 6). In this region the coexistence curves are quite flat and the Tph so measured can be taken as the critical temperature Tc with less than 0.5 °C error. The values of measured Tc for all the eight human IgGs are listed in Table II. As we can see from this table, Tcs of the eight IgGs are distributed over a broad range of temperature from −54 °C to −3 °C. On the other hand, five out of the eight IgGs have Tcs closely located at −23 ± 5 °C. The distribution of Tcs is shown in Fig. 7. It is worth to note that in our study the P1 and P2 are specially selected pharmaceutical human IgGs which exhibits LLPS at relatively high temperatures. Most of human IgGs may have Tc around −23 °C which is well below the body temperature. The ability of IgGs to maintain their solubility is obviously critical for immunological function of IgG which often requires prolonged elevated concentration of particular IgG in blood.
FIG. 6.
LLPS temperature as a function of the PEG concentration in the vicinity of their critical points (at 98 mg/ml).
Table II.
LLPS critical temperatures, Tc, of eight human IgGs, and the slope of PEG concentration dependency of Tph, , at fixed protein concentration 98 mg/ml. The deviations of Tc and are the errors of linear fitting of Tph versus PEG concentration c2.
| IgG | P1 | P2 | M7 | M8 | M14 | M16 | M15 | M12 |
|---|---|---|---|---|---|---|---|---|
| Tc (°C) | −2.8 ± 0.2 | −14.7 ± 0.3 | −20.0 ± 0.3 | −22.4 ± 0.3 | −22.4 ± 0.3 | −28 ± 1 | −28 ± 1 | −53.9 ± 0.8 |
| (°C ml/mg) | 1.27 ± 0.01 | 1.10 ± 0.01 | 0.79 ± 0.01 | 1.48 ± 0.01 | 0.92 ± 0.01 | 1.33 ± 0.04 | 1.18 ± 0.04 | 1.26 ± 0.01 |
FIG. 7.
Distribution of critical temperature, Tc, of eight human IgGs. The dashed curve is a Gaussian distribution with the experimental average and deviation.
The shape of the distribution of Tc reflects the distribution of magnitudes of inter-protein interaction. The net inter-protein interaction in the solution phase is the averaged interactions over all the amino acids on the protein surface. Because of the large number of random variations in the amino acids sequence of the Fab domains of IgGs, we expect a relatively narrow bell-shaped distribution of Tcs. Of course, in rare cases, there might be conformational changes or unusually strong inter-protein interaction due to particular mutations. These special cases could lead to outliers in the Tc distribution of IgGs.
The Tc measurement provides a way to quantitatively evaluate the colloidal stability of IgG solutions. As we discussed previously, all IgG have the coexistence curves of same shape. Thus, we can assume that the packing entropy at given concentration is the same for different IgG. This high temperature approximation is also consistent with the PEG concentration dependence of Tph for different IgGs. In Table II, the values of the slope for all IgGs are quite similar with variations within ∼30%. is mainly determined by the overlap of depletion layers for PEG molecules in protein solutions.40,43 Since the overlap of depletion layers depends on the spatial configuration of IgG molecules in the concentrated solutions, the similar slopes signifies that the spatial configuration of IgG molecules essentially does not depend on the inter-protein interaction and is generally the same for different IgGs. In the high temperature approximation, the magnitude of the effective interaction energy is simply proportional to Tc.25,43 Of course, the effective interaction energy may have a significant entropic component by itself and therefore be temperature dependent.24,52 In any case, IgG with higher Tc should have stronger attractive interactions and therefore show higher propensity to condense.
D. Relation between LLPS and crystallization of IgGs
Besides the liquid-liquid phase transition, a protein solution can also undergo liquid-solid phase transition, i.e., crystallization. Generally, IgGs are difficult to crystallize because they are large flexible proteins. However, crystallization of IgGs under non-physiological solution conditions has been recently reported for a number of pharmaceutical IgGs.9–11 Also, in rare medical cases, natural human IgGs, so-called cryoglobulins, can crystallize in the human body causing pathological manifestations known as cryoglobulinemia. In our previous work,15 we have investigated crystallization of two cryoglobulins (M23 and M31) produced by multiple myeloma patients and measured the liquidus lines (solubility lines) in PBS solutions.
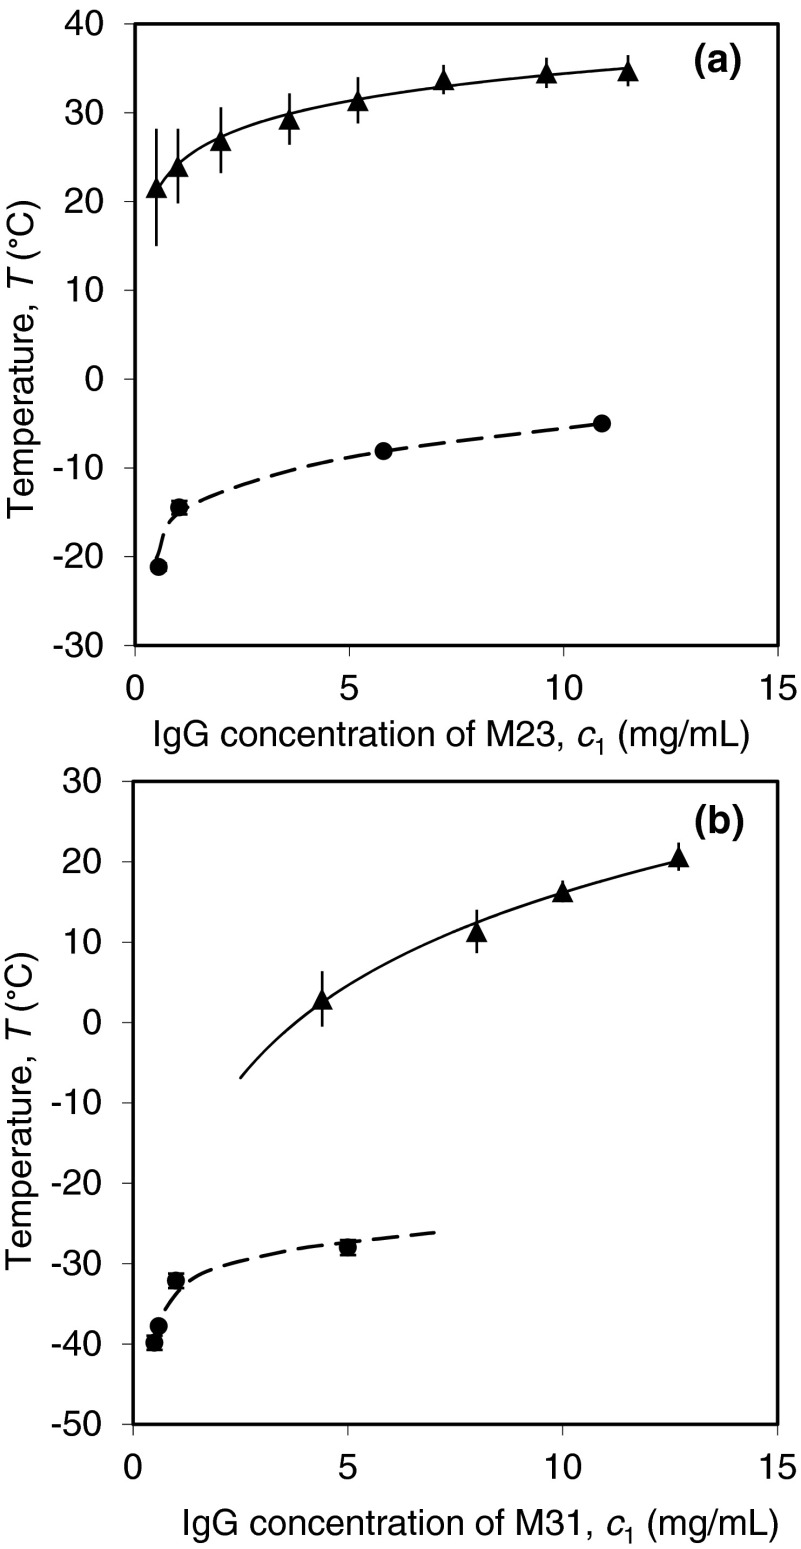
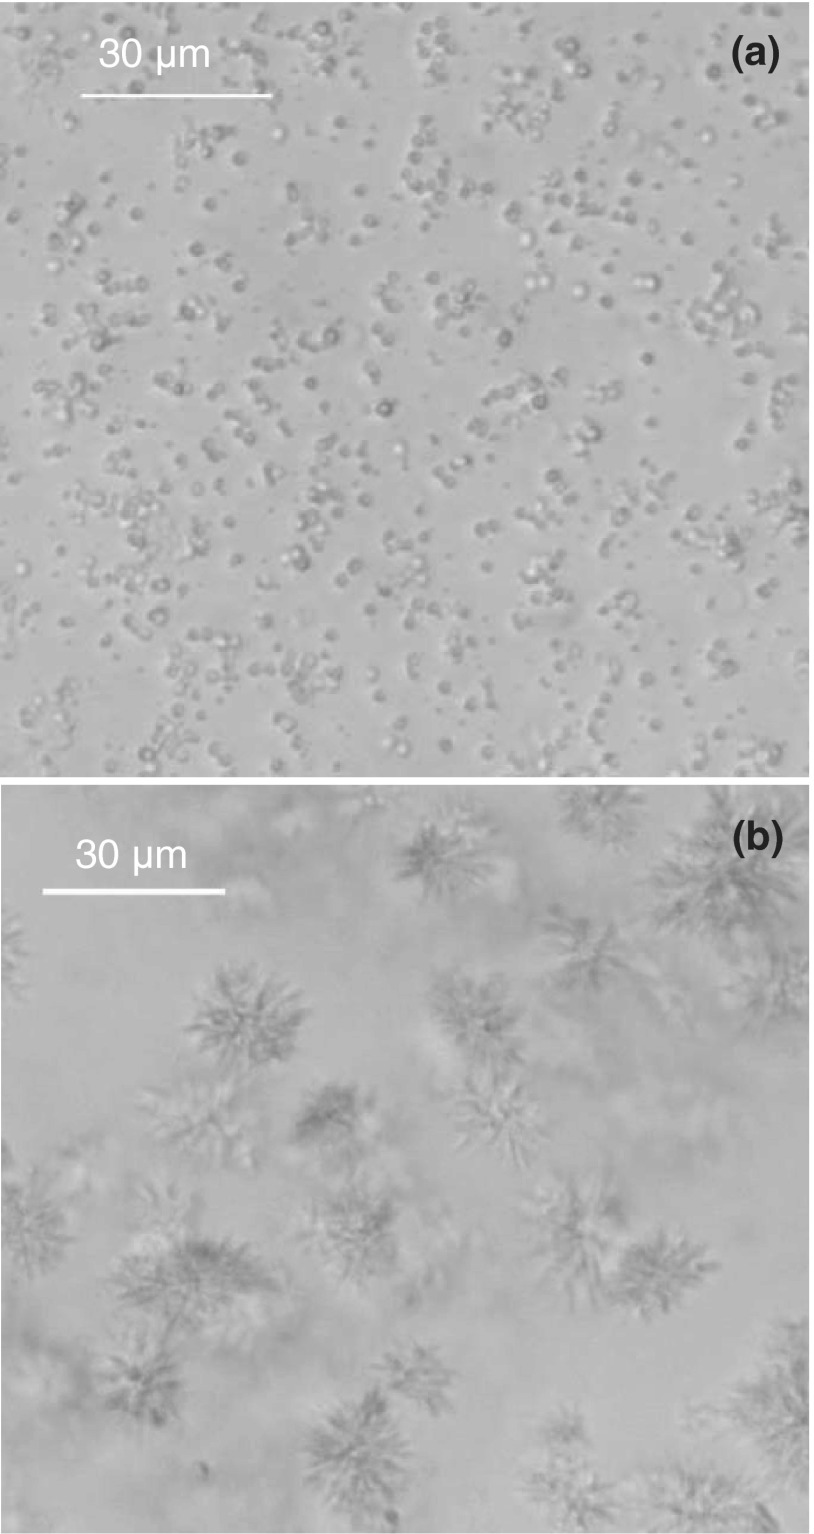
Using extrapolation of PEG-induced LLPS, we have measured the coexistence curves of these two cryoglobulins (M23 and M31). The coexistence curves and the solubility lines of these two proteins are shown in Fig. 8. We were able to determine the coexistence curves of cryoglobulins only in the low concentration region. At these low concentrations nucleation of crystals occurs sufficiently slowly to permit observation of LLPS, which occurs at lower temperatures than crystallization. At high protein concentration, the crystallization of cryoglobulins proceeds so fast that LLPS cannot be observed. The fact that the coexistence curves are located below the solubility lines is an important feature of the IgG phase diagram. It means that the LLPS in an IgG solution is thermodynamically metastable with respect to crystallization. The metastability of LLPS can also be directly observed using light microscopy. Under the microscope, we have observed formation of droplets in a M31 solution immediately after addition of sufficient amount of PEG for inducing LLPS (Fig. 9(a)). After overnight incubation at constant temperature, the droplets disappeared and clusters of needle-like crystals were observed (Fig. 9(b)). Except for the two cryoglobulins M23 and M31, we have not observed crystallization of the other IgGs in PBS solutions over a period of 6 months. However, crystallization and LLPS of P2 in solutions with low ionic strength has been previously reported.10 LLPS of P2 in the low salt solutions is also metastable with respect to crystallization.10
FIG. 8.
Phase diagrams of two IgG cryoglobulins (a) M23 and (b) M31. The solid triangles represent the solubility data points reported in Ref. 15. The vertical bars indicate the hysteresis between the temperatures of growth and dissolution of crystals. The solid curves are the exponential fittings for the liquidus line of crystallization. The solid circles represent the LLPS of the pure IgGs obtained by extrapolating the experimental results of PEG-induced LLPS. The dashed curves are eye guides for the coexistence curves.
FIG. 9.
LLPS is metastable with respect to crystallization in a human IgG cryoglobulin (M31) solution. (a) LLPS in a 0.5 mg/ml IgG solution with 10.3% (w/w) PEG3k was observed by a bright field microscope at 21 °C. (b) After 8 h incubation at 21 °C, clusters of needle-like crystals emerged in the solution while the protein-rich liquid droplets were consumed.
Metastability of LLPS is a known property for spherical colloidal particles with short-range interaction.22–24 It is a consequence of the fact that when the attraction is short-ranged the molecules are completely “caged” by their neighbors both in solid and in condensed liquid phases. That results in the loss of translational entropy being similar in both these condensed phases and gives advantage to the solid phase, where each particle has more neighbors and therefore higher binding energy. A number of experimental studies have shown that LLPS in solutions of spherical proteins is indeed metastable with respect to crystallization.27,39,53,54 However, as we have shown above, the phase behavior of IgG solutions is quite different from that of the solution of spherical proteins. Therefore, it is important to experimentally confirm the metastability of LLPS in IgG solutions. Since both crystallization and LLPS are driven by attractive inter-protein interaction, locations of the solubility line and the coexistence curve along the temperature axis are generally correlated. Observation of the metastability of LLPS in IgG solution suggests that those IgGs having relatively high Tc could undergo crystallization or colloidal aggregation at temperatures close to room temperature or even body temperature. Thus, LLPS provides a predictive tool to evaluate the propensity of IgGs to undergo colloidal condensations. From the practical point of view, evaluation of the colloidal stability of IgG solutions is important for formulation of IgG pharmaceuticals as well as understanding human diseases associated with in-vivo IgG deposition.
IV. CONCLUSION
In this work, we have conducted a systematic study of the phase behavior of human IgG solutions. We have demonstrated that all IgGs in physiological solutions have net attractive interactions and therefore exhibit liquid-liquid phase separation at sufficiently low temperatures. The experimentally determined LLPS phase boundaries (coexistence curves) of IgGs have similar shapes. All IgGs have broad and asymmetric coexistence curves and relatively low critical concentration at ∼100 mg/ml. The similarity of the coexistence curves arises from the common geometry of IgG molecules. Human IgGs, both natural and pharmaceutical, have different amino acids sequences in their Fab domains. This diversity leads to a range of net inter-protein interactions. The variability of the attractive interaction energy, in turn, produces shifts of the coexistence curves of IgGs along the temperature axis. Our experimental results show that human IgGs, with a few exceptions, have critical temperatures in the range of −20 °C to −30 °C and thus can be only observed in the presence of PEG. This low critical temperature is consistent with the high solubility of IgGs under physiological solution conditions.
Using two cryoglobulin IgGs which readily crystallize in PBS solutions, we have demonstrated that the LLPS in IgG solutions is metastable with respect to crystallization. Crystallization, as well as aggregation and LLPS of IgGs play important roles in some human diseases and also in the formulation and storage of IgG pharmaceuticals. Furthermore, crystallization of the IgG proteins or the antibody-antigen complexes allows the use of X-ray crystallography to determine the molecular structures and biological functions of IgGs.
The study of the condensation of antibodies in concentrated solutions is a newly emerging research area. The early investigations reported here show the latent phase transitions, which lie below the freezing point of the solutions for most IgGs. At the same time, there are IgG outliers capable of condensing at relatively high temperatures, which can have serious consequences both in realm of the pharmaceutical industry and in human diseases. Clearly, further studies of the phase behavior of IgGs are needed. In particular, a suitable model for Y-shaped IgG molecules capable of an adequate prediction of the thermodynamics of IgG solutions needs to be developed. Also, more complete data are needed to establish the distribution of critical temperatures for IgGs in the human body. Considering the ubiquitous presence of antibodies, the study of the physico-chemical properties of their solutions is of great importance. The experimental work presented here provides a framework for further theoretical and experimental studies of the phase behavior of IgG solutions and lays a foundation for designing rational manipulation and control of antibody condensations.
ACKNOWLEDGMENTS
We acknowledge Amgen Inc. for providing us pharmaceutical IgGs. We thank Onofrio Annunziata (Texas Christian University) and Neer Asherie (Yeshiva University) for helpful discussions. This study was supported by funds from the Alfred H. Caspary Professorship of Professor George Benedek (MIT).
REFERENCES
- 1.Kindt T. J., Goldsby R. A., Osborne B. A., and Kuby J., Kuby Immunology, 6th ed. (W.H. Freeman, New York, 2007). [Google Scholar]
- 2.Dübel S., Handbook of Therapeutic Antibodies: Technologies, Emerging Developments and Approved Therapeutics (John Wiley & Sons, 2010). [Google Scholar]
- 3.Wild D. G., The Immunoassay Handbook: Theory and Applications of Ligand Binding, ELISA and Related Techniques (Elsevier Science, 2013). [Google Scholar]
- 4.Gunton J. D., Shiryayev A., and Pagan D. L., Protein Condensation: Kinetic Pathways to Crystallization and Disease (Cambridge University Press, 2007). [Google Scholar]
- 5.Rosenbaum D. F., Kulkarni A., Ramakrishnan S., and Zukoski C. F., J. Chem. Phys. 111(21), 9882–9890 (1999). 10.1063/1.480328 [DOI] [Google Scholar]
- 6.Dumetz A. C., Chockla A. M., Kaler E. W., and Lenhoff A. M., Biophys. J. 94(2), 570–583 (2008). 10.1529/biophysj.107.116152 [DOI] [PMC free article] [PubMed] [Google Scholar]
- 7.Ahamed T., Esteban B. N., Ottens M., van Dedem G. W., van der Wielen L. A., Bisschops M. A., Lee A., Pham C., and Thommes J., Biophys. J. 93(2), 610–619 (2007). 10.1529/biophysj.106.098293 [DOI] [PMC free article] [PubMed] [Google Scholar]
- 8.Wang Y., Lomakin A., Latypov R. F., and Benedek G. B., Proc. Natl. Acad. Sci. U.S.A. 108(40), 16606–16611 (2011). 10.1073/pnas.1112241108 [DOI] [PMC free article] [PubMed] [Google Scholar]
- 9.Trilisky E., Gillespie R., Osslund T. D., and Vunnum S., Biotechnol. Prog. 27(4), 1054–1067 (2011). 10.1002/btpr.621 [DOI] [PubMed] [Google Scholar]
- 10.Mason B. D., Zhang L., Remmele R. L. Jr., and Zhang J., J. Pharm. Sci. 100(11), 4587–4596 (2011). 10.1002/jps.22650 [DOI] [PubMed] [Google Scholar]
- 11.Lewus R. A., Darcy P. A., Lenhoff A. M., and Sandler S. I., Biotechnol. Prog. 27(1), 280–289 (2011). 10.1002/btpr.536 [DOI] [PubMed] [Google Scholar]
- 12.Nishi H., Miyajima M., Nakagami H., Noda M., Uchiyama S., and Fukui K., Pharm. Res. 27(7), 1348–1360 (2010). 10.1007/s11095-010-0125-7 [DOI] [PubMed] [Google Scholar]
- 13.Mason B. D., Zhang-van Enk J., Zhang L., Remmele R. L. Jr., and Zhang J., Biophys. J. 99(11), 3792–3800 (2010). 10.1016/j.bpj.2010.10.040 [DOI] [PMC free article] [PubMed] [Google Scholar]
- 14.Chen S., Lau H., Brodsky Y., Kleemann G. R., and Latypov R. F., Protein Sci. 19(6), 1191–1204 (2010). 10.1002/pro.396 [DOI] [PMC free article] [PubMed] [Google Scholar]
- 15.Wang Y., Lomakin A., Hideshima T., Laubach J. P., Ogun O., Richardson P. G., Munshi N. C., Anderson K. C., and Benedek G. B., Proc. Natl. Acad. Sci. U.S.A. 109(33), 13359–13361 (2012). 10.1073/pnas.1211723109 [DOI] [PMC free article] [PubMed] [Google Scholar]
- 16.Dispenzieri A., Curr. Treat. Options Oncol. 1(2), 105–118 (2000). 10.1007/s11864-000-0055-4 [DOI] [PubMed] [Google Scholar]
- 17.Payet J., Livartowski J., Kavian N., Chandesris O., Dupin N., Wallet N., Karras A., Salliot C., Suarez F., Avet-Loiseau H., Alyanakian M. A., Nawakil C. A., Park S., Tamburini J., Roux C., Bouscary D., and Sparsa L., Leuk. Lymphoma 54(4), 767–777 (2013). 10.3109/10428194.2012.671481 [DOI] [PubMed] [Google Scholar]
- 18.Buckley C. E. III and Dorsey F. C., J. Immunol. 105(4), 964–972 (1970). [PubMed] [Google Scholar]
- 19.Durie B. G. and Salmon S. E., Cancer 36(3), 842–854 (1975). [DOI] [PubMed] [Google Scholar]
- 20.Edwards A., Daniels B. S., and Deen W. M., Am. J. Physiol. 276(6 Pt 2), F892–F902 (1999). [DOI] [PubMed] [Google Scholar]
- 21.Hoffmann F., Grimbacher B., Thiel J., Peter H. H., and Belohradsky B. H., Eur. J. Med. Res. 15(6), 238–245 (2010). 10.1186/2047-783X-15-6-238 [DOI] [PMC free article] [PubMed] [Google Scholar]
- 22.Lomakin A., Asherie N., and Benedek G. B., Proc. Natl. Acad. Sci. U.S.A. 100(18), 10254–10257 (2003). 10.1073/pnas.1334069100 [DOI] [PMC free article] [PubMed] [Google Scholar]
- 23.Anderson V. J. and Lekkerkerker H. N. W., Nature (London) 416(6883), 811–815 (2002). 10.1038/416811a [DOI] [PubMed] [Google Scholar]
- 24.Lomakin A., Asherie N., and Benedek G. B., Proc. Natl. Acad. Sci. U.S.A. 96(17), 9465–9468 (1999). 10.1073/pnas.96.17.9465 [DOI] [PMC free article] [PubMed] [Google Scholar]
- 25.Lomakin A., Asherie N., and Benedek G. B., J. Chem. Phys. 104(4), 1646–1656 (1996). 10.1063/1.470751 [DOI] [Google Scholar]
- 26.Pande A., Annunziata O., Asherie N., Ogun O., Benedek G. B., and Pande J., Biochemistry 44(7), 2491–2500 (2005). 10.1021/bi0479611 [DOI] [PubMed] [Google Scholar]
- 27.Pande A., Pande J., Asherie N., Lomakin A., Ogun O., King J., and Benedek G. B., Proc. Natl. Acad. Sci. U.S.A. 98(11), 6116–6120 (2001). 10.1073/pnas.101124798 [DOI] [PMC free article] [PubMed] [Google Scholar]
- 28.Dorsaz N., Thurston G. M., Stradner A., Schurtenberger P., and Foffi G., Soft Matter 7(5), 1763–1776 (2011). 10.1039/c0sm00156b [DOI] [Google Scholar]
- 29.Bloustine J., Virmani T., Thurston G. M., and Fraden S., Phys. Rev. Lett. 96(8), 087803 (2006). 10.1103/PhysRevLett.96.087803 [DOI] [PubMed] [Google Scholar]
- 30.Combe N. and Frenkel D., J. Chem. Phys. 118(19), 9015–9022 (2003). 10.1063/1.1567256 [DOI] [Google Scholar]
- 31.ten Wolde P. R. and Frenkel D., Science 277(5334), 1975–1978 (1997). 10.1126/science.277.5334.1975 [DOI] [PubMed] [Google Scholar]
- 32.Xu L., Buldyrev S. V., Stanley H. E., and Franzese G., Phys. Rev. Lett. 109(9), 095702 (2012). 10.1103/PhysRevLett.109.095702 [DOI] [PubMed] [Google Scholar]
- 33.Grouazel S., Bonnete F., Astier J. P., Ferte N., Perez J., and Veesler S., J. Phys. Chem. B 110(39), 19664–19670 (2006). 10.1021/jp0627123 [DOI] [PubMed] [Google Scholar]
- 34.Grouazel S., Perez J., Astier J. P., Bonnete F., and Veesler S., Acta Crystallogr. 58(Pt 10 Pt 1), 1560–1563 (2002). 10.1107/S0907444902012799 [DOI] [PubMed] [Google Scholar]
- 35.Galkin O., Chen K., Nagel R. L., Hirsch R. E., and Vekilov P. G., Proc. Natl. Acad. Sci. U.S.A. 99(13), 8479–8483 (2002). 10.1073/pnas.122055299 [DOI] [PMC free article] [PubMed] [Google Scholar]
- 36.Li P., Banjade S., Cheng H. C., Kim S., Chen B., Guo L., Llaguno M., Hollingsworth J. V., King D. S., Banani S. F., Russo P. S., Jiang Q. X., Nixon B. T., and Rosen M. K., Nature (London) 483(7389), 336–340 (2012). 10.1038/nature10879 [DOI] [PMC free article] [PubMed] [Google Scholar]
- 37.Taratuta V. G., Holschbach A., Thurston G. M., Blankschtein D., and Benedek G. B., J. Phys. Chem. 94(5), 2140–2144 (1990). 10.1021/j100368a074 [DOI] [Google Scholar]
- 38.Thomson J. A., Schurtenberger P., Thurston G. M., and Benedek G. B., Proc. Natl. Acad. Sci. U.S.A. 84(20), 7079–7083 (1987). 10.1073/pnas.84.20.7079 [DOI] [PMC free article] [PubMed] [Google Scholar]
- 39.Zhang F., Roosen-Runge F., Sauter A., Roth R., Skoda M. W. A., Jacobs R. M. J., Sztucki M., and Schreiber F., Faraday Discuss. 159(1), 313–325 (2012). 10.1039/c2fd20021j [DOI] [Google Scholar]
- 40.Annunziata O., Asherie N., Lomakin A., Pande J., Ogun O., and Benedek G. B., Proc. Natl. Acad. Sci. U.S.A. 99(22), 14165–14170 (2002). 10.1073/pnas.212507199 [DOI] [PMC free article] [PubMed] [Google Scholar]
- 41.Annunziata O., Ogun O., and Benedek G. B., Proc. Natl. Acad. Sci. U.S.A. 100(3), 970–974 (2003). 10.1073/pnas.242746499 [DOI] [PMC free article] [PubMed] [Google Scholar]
- 42.Annunziata O., Pande A., Pande J., Ogun O., Lubsen N. H., and Benedek G. B., Biochemistry 44(4), 1316–1328 (2005). 10.1021/bi048419f [DOI] [PubMed] [Google Scholar]
- 43.Wang Y. and Annunziata O., J. Phys. Chem. B 111(5), 1222–1230 (2007). 10.1021/jp065608u [DOI] [PubMed] [Google Scholar]
- 44.Asakura S. and Oosawa F., J. Chem. Phys. 22(7), 1255–1256 (1954). 10.1063/1.1740347 [DOI] [Google Scholar]
- 45.Asakura S. and Oosawa F., J. Polym. Sci. 33(126), 183–192 (1958). 10.1002/pol.1958.1203312618 [DOI] [Google Scholar]
- 46.Vrij A., Pure Appl. Chem. 48(4), 471–483 (1976). 10.1351/pac197648040471 [DOI] [Google Scholar]
- 47.Hay F. C., Westwood O. M. R., Nelson P. N., and Hudson L., Practical Immunology, 4th ed. (Blackwell Science, Malden, MA, 2002). [Google Scholar]
- 48.Fischer H., Polikarpov I., and Craievich A. F., Protein Sci. 13(10), 2825–2828 (2004). 10.1110/ps.04688204 [DOI] [PMC free article] [PubMed] [Google Scholar]
- 49.Bhat R. and Timasheff S. N., Protein Sci. 1(9), 1133–1143 (1992). 10.1002/pro.5560010907 [DOI] [PMC free article] [PubMed] [Google Scholar]
- 50.Zackrisson M., Andersson R., and Bergenholtz J., Langmuir 20(8), 3080–3089 (2004). 10.1021/la036132y [DOI] [PubMed] [Google Scholar]
- 51.Berne B. J. and Pecora R., Dynamic Light Scattering: With Applications to Chemistry, Biology, and Physics (Dover Publications, Mineola, NY, 2000). [Google Scholar]
- 52.McManus J. J., Lomakin A., Ogun O., Pande A., Basan M., Pande J., and Benedek G. B., Proc. Natl. Acad. Sci. U.S.A. 104(43), 16856–16861 (2007). 10.1073/pnas.0707412104 [DOI] [PMC free article] [PubMed] [Google Scholar]
- 53.Galkin O. and Vekilov P. G., Proc. Natl. Acad. Sci. U.S.A. 97(12), 6277–6281 (2000). 10.1073/pnas.110000497 [DOI] [PMC free article] [PubMed] [Google Scholar]
- 54.Muschol M. and Rosenberger F., J. Chem. Phys. 107(6), 1953–1962 (1997). 10.1063/1.474547 [DOI] [Google Scholar]


