Abstract
We explore the properties of the signal from magnetic nanoparticles. The nanoparticle signal has been used to generate images in magnetic particle imaging (MPI). MPI promises to be one of the most sensitive methods of imaging small numbers magnetic nanoparticles and therefore shows promise for molecular imaging. The nanoparticle signal is generated with a pure sinusoidal magnetic field that repeatedly saturates the nanoparticles creating harmonics in the induced magnetization that are easily isolated from the driving field. Signal from a selected position is isolated using a static magnetic field to completely saturate all of the particles outside a voxel enabling an image to be formed voxel by voxel. The signal produced by the magnetization of the nanoparticles contains only odd harmonics. However, it is demonstrated experimentally that with the addition of a static magnetic field bias even harmonics are introduced which increase the total signal significantly. Further, the distribution of signal among the harmonics depends on the static bias field so that information might be used to localize the nanoparticle distribution. Finally, the field required to completely saturate nanoparticles can be quite large and theory predicts that the field required is determined by the smallest nanoparticles in the sample.
I. INTRODUCTION
Molecular imaging has generated intense and persistent interest because of the potential for understanding basic biology as well as pathologic processes. Magnetic particle imaging (MPI)1 is one of the very few methods capable of joining PET, SPECT, and optical techniques in the molecular imaging repertoire.2
Magnetic nanoparticles have a wide range of applications in biomedicine3 and imaging their spatial distribution is important in most of those applications. For example, nanoparticles can be tagged with appropriate antibodies so they selectively congregate around malignant cells creating the potential for treatment of cancer cells without impacting normal cells. It is important to image nanoparticles to determine when sufficient numbers of nanoparticles are present in the malignancy and where else the particles might be congregating.
Magnetic particle imaging (MPI) was introduced in 20051 as a way to image very low concentrations of magnetic nanoparticles. MPI received a good deal of fanfare because it is thought to be capable of imaging concentrations of nanoparticles orders of magnitude smaller than magnetic resonance imaging (MRI) or other modalities can detect.2 This has not been proven to be the case and recent work in MRI has been pushing the detection limits.4,5 Sensitivity is critical to molecular imaging in general and to nanoparticle imaging in particular because very few nanoparticles can be attached to any single molecule or cell. Sensitivity is not so critical in other applications of nanoparticle imaging such as for magnetic fluid hyperthermia6 where large quantities of magnetic nanoparticles are injected directly into the tumor. However, high sensitivity is required for the most promising applications, such as localizing antibody tagged nanoparticles which can be used to identify metastases and tumor margins in the clinical setting and tracking individual labeled cells in the basic research setting.
MPI1 detects the nonlinearities in the magnetization induced in nanoparticles by a harmonic magnetic field, termed the driving field. The saturation of the magnetization produces signal at the odd harmonic frequencies that are relatively simple to detect because all signal at the frequency of the driving field can be eliminated with a lowpass filter. Only odd harmonics of the applied field are produced so the bandwidth of the signal can be extremely small to eliminate noise. The narrow bandwidth and high signal make the estimated detection limits quite low. The low detection limits are a significant part of the attraction of MPI because it promises to enable molecular imaging without the limitations hampering other molecular imaging methods: optical imaging7 is limited to relatively thin samples, MRI requires extremely high spatial resolution5 to achieve the necessary sensitivity, and PET requires significant effort to radiolabel the appropriate materials in a short time.8 MPI localized the signal produced by completely saturating the nanoparticles outside of a voxel so only the nanoparticles inside the voxel contribute to the signal.1 A Helmholz coil pair was used to create a “field free” region where nanoparticles contribute to the signal and high static fields completely saturate nanoparticles in the surrounding regions so they do not contribute to the signal. The field free region was then swept across the sample creating an image. In practice, the sample was moved across the field free region1 but the result is the same and because magnetic fields add, it is easy to envision a field swept version of the system presented. The sensitivity is difficult to estimate this early in the development process but good simulation results have been shown at 9 and good experimental results have been shown at in a related technique.10 For comparison with MRI, of Resovist is used and if it remains in the blood that corresponds to concentrations of around .9 But sensitivity for imaging depends on a host of factors and the achievable sensitivity will take a significant length of time to understand.
Normally the nanoparticle signal contains only odd harmonics.1 If any periodic signal is repeated identically twice within a time interval, the odd terms of the Fourier transform over that time interval will be identically zero.11 However, if the function is repeated but with alternating signs, then the even terms of the Fourier transform will be zero, e.g., the Fourier transform of a single cycle of a sin function is only nonzero for the first term. The magnetization induced by a sinusoidal magnetic field is a distorted sinusoid. The distortion is identical for the increasing and decreasing fields so the magnetization is repeated but with alternating sign creating zero even harmonics.
Several related nonmedical methods use odd harmonics produced by nonlinearities in the hysteresis curve for detection, e.g., nondestructive testing for pipeline cracks.12 The introduction of an offset magnetic field has been shown to generate even harmonics as well as the odd harmonics in several related methods for characterizing superconductivity13 and measuring magnetic fields with ferrofluids.14,15
We demonstrate experimentally that the addition of an offset magnetic field introduces even harmonics in the nanoparticle signal. Further, the even harmonics are significantly larger than the odd harmonics so the total signal produced is increased significantly. The pattern of the harmonics is a function of the size of the offset field so a spatial gradient in the offset field could be used to provide limited localization information to either reduce acquisition times or improve signal-to-noise ratio (SNR) by further averaging because the resolution is SNR limited.11
II. METHODS
The signal from nanoparticles was obtained in static magnetic fringe fields produced by a 3T Philips MRI magnet. First, we will present a relatively simple version of the physical models previously used to describe the magnetization of a suspension of magnetic particles in an applied field. Then we will describe the apparatus used to generate and detect the nanoparticle signal from a suspension of nanoparticles and how the MRI magnet was used to affect a wide range of bias magnetic fields. Finally, we will describe the two types of magnetic nanoparticles used.
II.A. Models describing the measured magnetization
The hysteresis curve determines the magnetization induced in a material by a time varying magnetic field. Even for relatively high concentrations of suspended particles such as those in magnetic fluids, the magnetization is well described by treating them as independent, isotropic spins governed by a combination of statistical thermal fluctuations and the applied magnetic field.16 Suspensions of nanoparticles should be accurately described by the same theory because they are more dispersed and are small enough to be single magnetic domain. The hysteresis curve for a group of identical nanoparticles should be well described by a Langevin function.14–16 The magnetization, , is:
| (1) |
where is the magnetization, is the bulk magnetization, is the volume of the particle, is the applied field, is the Boltzmann constant, and is the absolute temperature. In this case, the applied field consists of the sinusoidal field, , and the constant bias field, :
| (2) |
It is useful to think about the effects of temperature as an effective field which scales the applied field
| (3) |
where is the temperature equivalent field. scales the applied field in Eq. (3) so for a large , a larger applied field is required to influence the nanoparticles. is larger for smaller particles or for particles with a smaller bulk magnetization or for particles at higher temperatures. The thermal disordering of the nanoparticle magnetizations, reflected by , reduces the ability of the applied field to align the individual nanoparticle magnetizations into a macroscopic effect.
Collections of particles of different sizes are described by multiple Langevin functions16 and, although the characteristic properties of the hysteresis curve remain the same, the shape depends on the distribution of sizes and properties. The size distribution is generally log-normally distributed. The primary effect of the radius is on the volume of the nanoparticle, , but the size also strongly affects the coercive field.17 The coercive field is a measure of the phase of the magnetization relative to the applied field and does not influence the shape of the hysteresis curve, just the translation of it which can be represented as a time shift in Eq. (3). A time shift represents a phase change in the frequency domain so the signals from nanoparticles of different sizes interfere.
Estimates of the ratio can be generated from the ratio of the signals at the third and the fifth harmonic frequencies with no bias field and itself can be estimated if is also known. The ratio of the signal at the third and fifth harmonic frequencies is independent of nanoparticle concentration and decreases monotonically with increasing ratio so can be obtained uniquely from the ratio of the signals. Several methods of solving for are possible but we simply iterated on the calculated ratio of the harmonics; an arbitrary trial ratio was selected and the calculated ratio of the harmonics was found for that trial value using a Langevin function. The trial ratio was decreased if the experimental ratio of the harmonics was too small and increased if it was too large. Then the process was started again with the new trial ratio. There are two limitations to this method of estimating : first, the estimate can become unstable and second, the size distribution causes a bias in the estimate. The method’s numerical stability decreases as decreases but our current implementation provides useful solutions for larger than 0.1. Based on published values of the saturation magnetization,18,19 this is true for iron oxide nanoparticles larger than and reasonable amplitudes, above . The nanoparticle size distribution, if it is not known, would also probably impact the accuracy of the estimate. There is a significant bias in the estimate of if the nanoparticle size distribution is very wide and a single size nanoparticle was assumed. The bias in is toward larger particles. However, even with the limitations, it is a simple, effective way to characterize the nanoparticles because includes the effect of nanoparticle volume, , and the bulk magnetization, , which completely characterize the magnetic properties of monodisperse nanoparticles, so can be used to predict the signal as a function of and .
The Fourier transform of the Langevin function can be approximated by a hyperbolic cosecant and decreases rapidly with increasing frequency. The implication of this observation is that the signal drops with increasing harmonic number unless symmetry interferes.
II.B. Apparatus employed
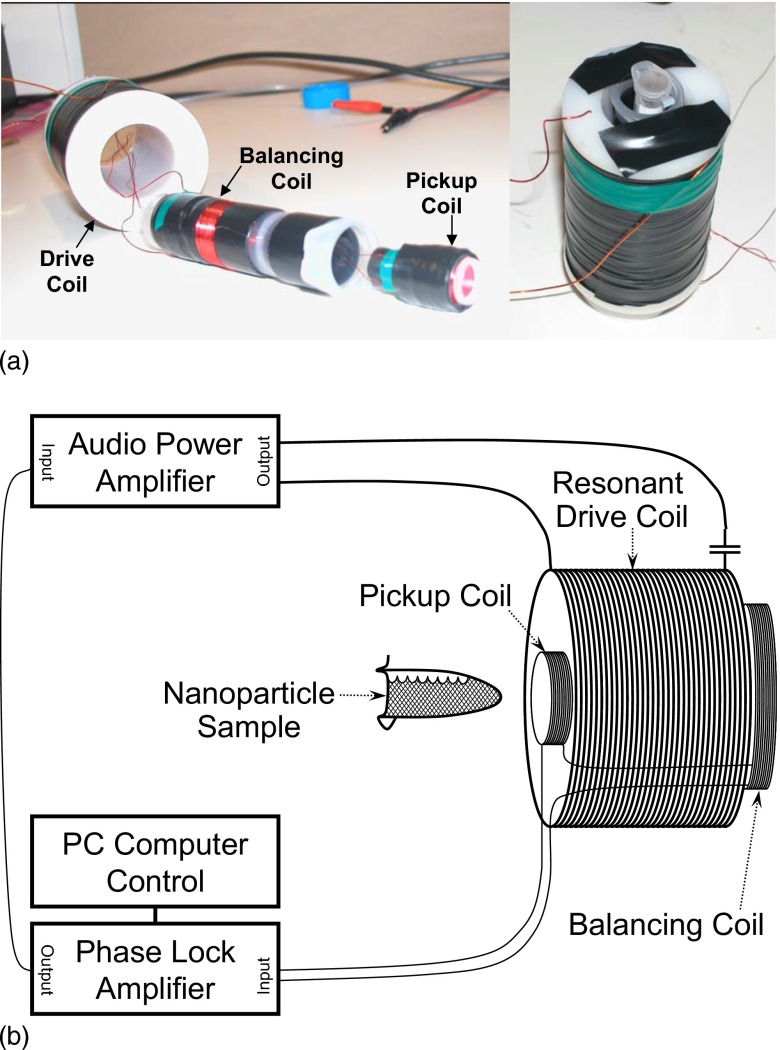
The apparatus generating the nanoparticle signal shown in Fig. 1 consisted of a harmonic drive circuit and a receive circuit but lacked the localizing field employed in MPI. The circuit producing the driving sinusoidal magnetic field consisted of a solenoid resonant drive coil with approximately 1400 turns along a cylinder with a of 37. The sinusoidal current was produced by an audio amplifier fed by a signal generator producing a sinusoidal voltage at the resonant frequency of the coil. The apparatus can generate a harmonic field of amplitude by driving through the coil. The field was measured using a Bell 5180 magnetic field meter. Frequencies up to approximately can be achieved with essentially 100% duty cycle, i.e., the current can be driven indefinitely. Higher frequencies can also be obtained at lower amplitude fields or with intermittent use to avoid overheating the coil. The applied field was at for the experiments performed. The resonant drive coil has two useful properties: first, a relatively small power amplifier is required to obtain a large field at a high frequency and, second, the resonant coil attenuates the harmonics generated by the amplifier, rated at 0.05% total harmonic distortion, and signal generator so the harmonics recorded by the pickup coil are primarily generated by the nanoparticles.
FIG. 1.
(a) Top left: Exploded view of the coils generating the MPI signal. Top right: The assembled coils with a sample in place. (b) Schematic of the apparatus used to generate and measure the signal from the magnetic nanoparticles. The output of the lock-in amplifier was used as the drive frequency for the audio amplifier. The input of the lock-in amplifier was set to each harmonic frequency in succession by the control computer to read the signal at that frequency. A time constant was used so the lock-in amplifier required at least to settle but we allowed at least for the reading to stabilize. The noise effective bandwidth of the lock-in amplifier with the time constant and filter setting used was . The pickup coil was in series with the balancing coil. The position of the balancing coil was far enough from the sample that it detected no measurable signal from the nanoparticles. The position of the balancing coil was adjusted to null the detected signal at the drive frequency and fixed in that position. The resonant drive coil damped the harmonics from the power amplifier.
The receive circuit consisted of a pickup coil inside the drive coil connected in series with a balancing coil placed at the end of the drive coil. Samples were placed inside the pickup coil. The balancing coil was used to reduce the voltage at the drive frequency, as well as harmonics from the amplifier, so the signals generated by the nanoparticles can be amplified sufficiently to be recorded. Other methods, such as a high pass filter, might be used in place of or in conjunction with the balancing coil to reduce the dynamic range of the signal but the balancing coil alone proved sufficient for our purposes. The balancing coil was placed at the end of the drive coil so it recorded the applied field but was far enough away from the sample that the nanoparticle magnetization did not generate any voltage. The position of the balancing coil was adjusted so the current induced in the balancing coil was equal and opposite to the current induced in the pickup coil. The signal at each harmonic was recorded using a phase lock amplifier set to the harmonic frequencies. The magnitude and phase of the signal from each nanoparticle sample was recorded along with the background signal when no nanoparticles were present. The complex background signal was subtracted from the complex nanoparticle signal to obtain the signal from the nanoparticles themselves. The total harmonic distortion calculated from the reference signals averaged 0.039% which was 1.1% of the largest nanoparticle signal.
The static field from a 3T Philips MRI was used as the static magnetic field. The field was measured using a Bell 5180 magnetic field meter. The static field was always aligned along the axis of the drive coil so the static bias field added to the sinusoidal applied field. The position of the apparatus was adjusted till the measured field at the position of the center of the sample was correct. The process took on the order of to achieve the desired field. The field homogeneity across the -long sample was also measured using the field meter. The maximum field deviation was smaller at low fields and larger nearer the center of the magnet at high fields. The maximum deviation was 1.3% at , 1.7% at , 2.6% at and 4.2% at .
II.C. Nanoparticles employed
Two types of nanoparticles were used: iron oxide nanoparticles and composite nanoparticles with an iron core encased in an iron oxide shell. The commercially obtained, dextran-coated, SPIO iron oxide particles, Feridex , had a size distribution ranging from 15 to . The iron core composite nanoparticles were manufactured at Dartmouth and had a size distribution ranging from 10 to . The concentration of the iron core nanoparticles, , was not diluted to keep the signal as strong as possible and the iron oxide nanoparticles were diluted to be roughly the same concentration, . The two nanoparticles were characterized and compared previously.20 All samples were kept at room temperature. The samples were approximately long.
III. RESULTS
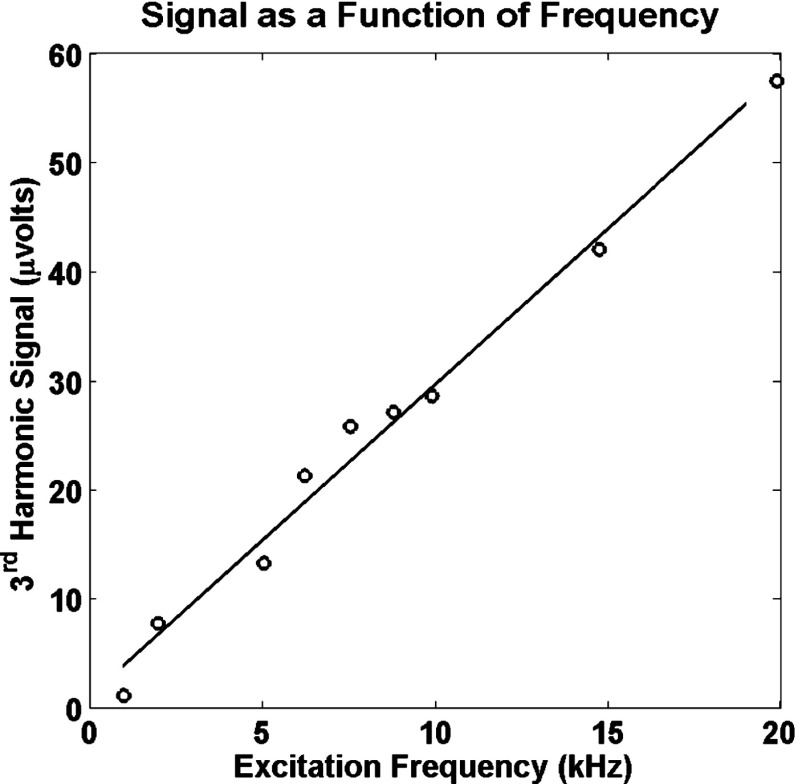
Several preliminary experiments were undertaken to examine the performance of the system. Figure 2 shows that the signal increases linearly with frequency as expected; the linear correlation coefficient was 0.993 ( value ). The signal per cycle was essentially constant ( value ) over this range of frequencies. The distortion of the magnetization producing signal at the higher harmonic frequencies is repeated every cycle of the drive field so as long as the hysteresis curve does not change, the signal per unit time should increase with drive field frequency. The hysteresis curve can be frequency dependent but the linear relationship between signal and frequency implies that there is no significant frequency dependence below with these nanoparticles at these power levels.
FIG. 2.
The signal at the 3rd harmonic as a function of the drive field frequency. The sample was a sample of iron core composite nanoparticles. The same current was used at all frequencies. The linear regression is also shown.
Noise was additive and the standard deviation of 20 repeated signal measurements was 0.60%.
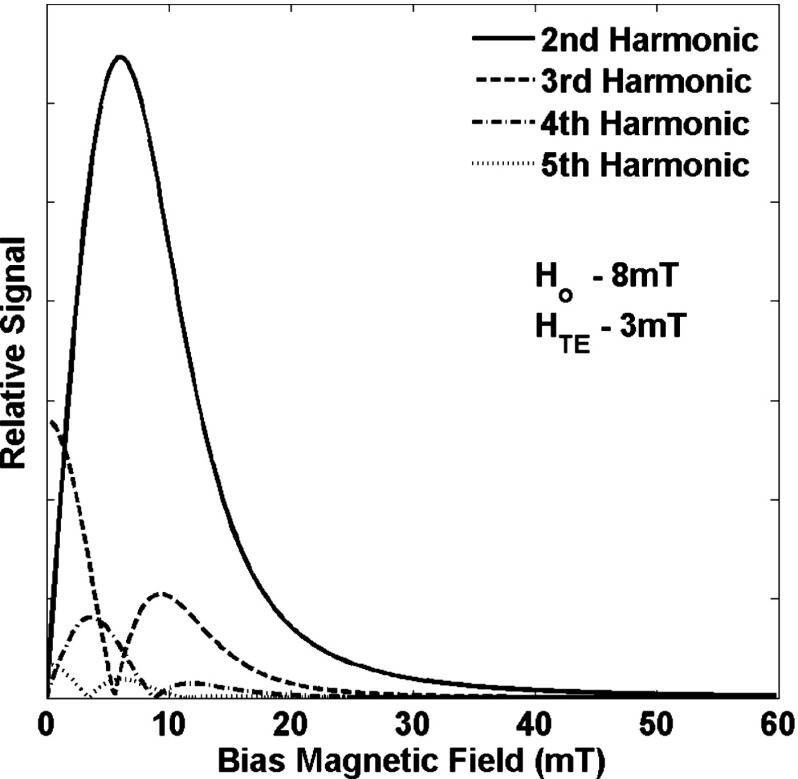
Figure 3 shows the variation of the signal at harmonics 2-5 as a function of the static bias magnetic field predicted by the superparamagnetic model using the single Langevin function in Eq. (3) to describe the signal. The curves in Fig. 3 will scale with as described above but the features remain the same. The even harmonics are zero when the bias field is zero while the odd harmonics are maximum when the bias field is zero. The second harmonic has a single peak while the third and larger harmonics have smaller local maxima at larger bias fields. The actual magnetization is a sum of Langevin functions for each size of particle weighted by the number of nanoparticles of each size. The size of the nanoparticle also changes the coercive field which changes the phase of the magnetization in the frequency domain. The coercive field changes with the sixth power of the particle radius17 so the vector sum of the magnetizations of each particle size can interfere with each other creating more complex signals than a single Langevin function would suggest.
FIG. 3.
The signals produced by a group of identical nanoparticles of the same size as predicted by the single Langevin function in Eq. (3). The curves will scale with the temperature equivalent field but the shapes of the curves do not change.
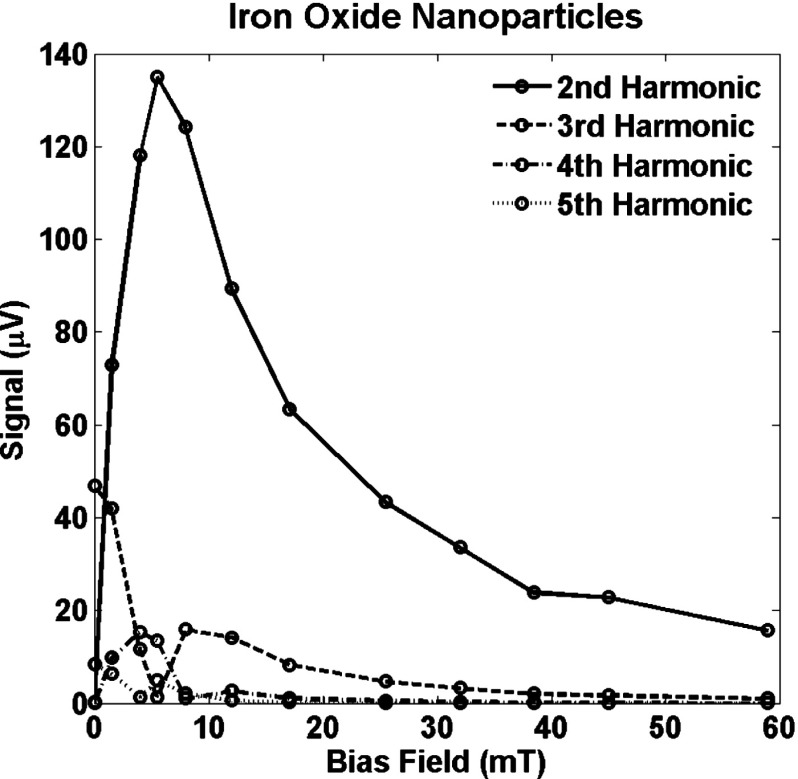
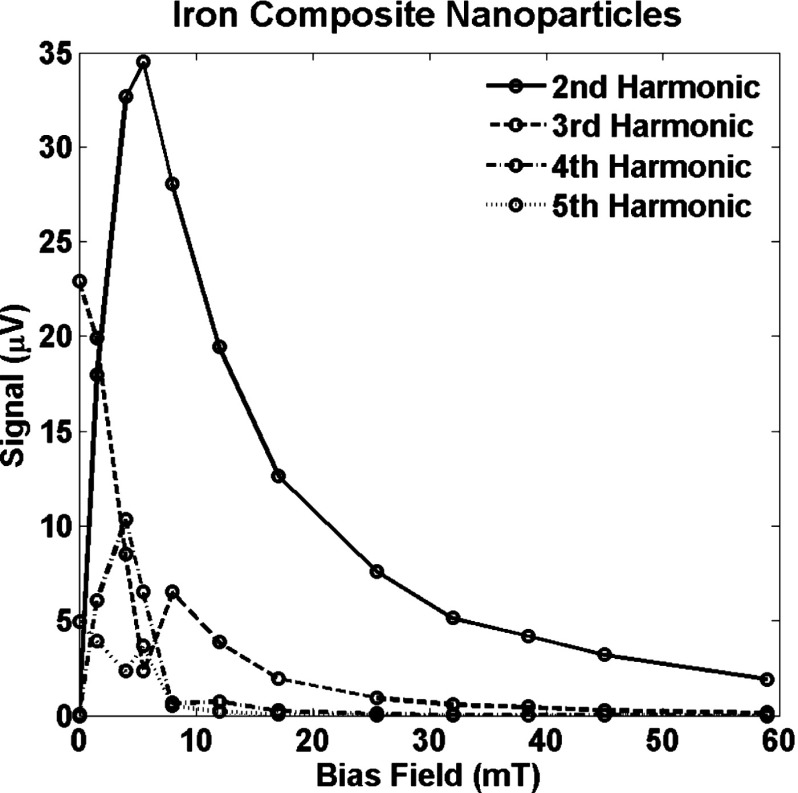
Figures 4 and 5 show the signals from two types of nanoparticles that were measured at harmonics 2–5 with bias fields ranging from zero to . Nine harmonics were measured but only five are shown. Some larger values of bias field were also used explore how large a bias field was required to completely saturate the signal. The harmonics exhibit a similar pattern to that in Fig. 3. However, the field offset required to saturate the nanoparticle signal completely is significantly higher than suggested by the signal from a single size nanoparticle.
FIG. 4.
Signal at harmonics 2–5 for a sample of iron oxide nanoparticles as a function of the bias magnetic field, .
FIG. 5.
Signal at harmonics 2–5 for a sample of iron core composite nanoparticles as a function of the bias magnetic field, .
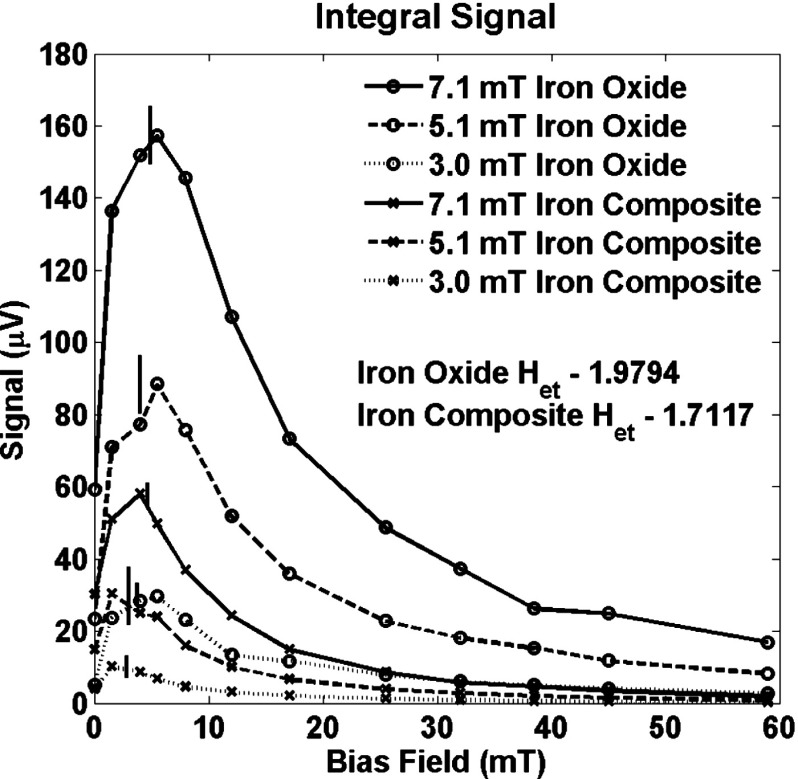
The sum of the signals at the 2nd–9th harmonic frequencies is plotted in Fig. 6 for three drive field amplitudes for both nanoparticles. The total signal is dominated by the signal at the 2nd harmonic frequency. The temperature equivalent field for both nanoparticles was calculated from the ratio of the signal at the 3rd and 5th harmonics for the largest drive amplitude. The value of was then used to calculate the bias field at which the maximum signal occurs and those fields are marked in Fig. 6. The bias field at which the maximum signal is achieved can be estimated with sufficient accuracy to help design equipment from the value of at zero field.
FIG. 6.
The total signal from all measured harmonics (2–9) for a sample of iron oxide nanoparticles and for a sample of iron core composite nanoparticles as functions of the bias field, . The total signal increases significantly with the addition of a bias field and it shows that the signal is difficult to saturate. The total signal can be estimated numerically from an estimate of obtained from the ratio of the signal at the 3rd and 5th harmonic frequencies. The predicted peaks are marked with longer vertical lines for the iron oxide nanoparticles, , and with shorter vertical lines for the iron core composite nanoparticles, .
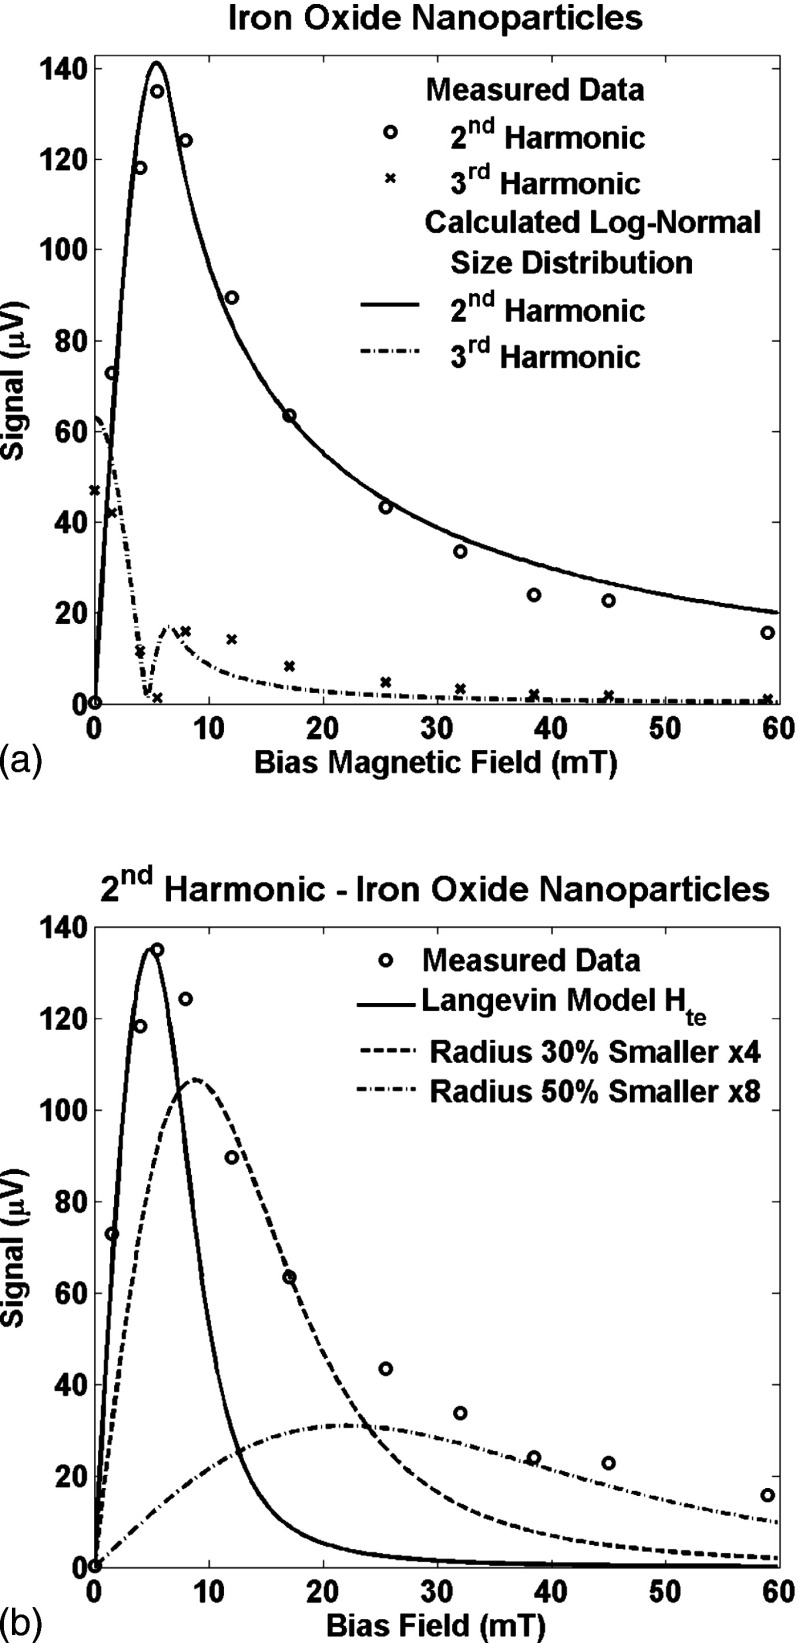
The data were fit with the sum of Langevin functions with a log-normal size distribution using least squares and the result is shown in Fig. 7(a). A log-normal distribution was used because it is the most common size distribution and is the natural one when particle formation is proportional to the surface area or volume of the nanoparticle, although it is also appropriate for a wider class of processes.21 The model used was
| (4) |
where
| (5) |
where is the scaled temperature equivalent field, is the number of nanoparticles of size , is the standard deviation of the logarithm of the scaled radius, and is an arbitrary index. The radii of the nanoparticles is . The scale of the size distribution, , cannot be separated from the temperature equivalent field; only the distribution of scaled radii forms an independent term. Two free parameters were fit to the measured data in Fig. 7(a): the scaled standard deviation of the log-normal size distribution and the multiplicative constant. The fit was relatively insensitive to the mean and standard deviation of the size distribution; the optimum values were a mean of 1.0 and a standard deviation of 0.75. The units of the size distribution were absorbed in the multiplicative constant and because they form a product, it is impossible to separate them. The optimum value of the scaled temperature equivalent field found was . The resulting fit is quite close to the measured data; the error energy was only 9% of the signal.
FIG. 7.
(a) The measured signal at the 2nd and 3rd harmonics as a function of the bias field, , for a sample of iron oxide nanoparticles. The solid line is the signal calculated from a sum of Langevin functions distributed with a log-normal size distribution. The optimum fit for the three parameters was obtained iteratively and detailed in the text. The error energy was 9%. (b) The measured signal at the 2nd harmonic as a function of the bias field as shown in Fig. 7(a). The solid line is the signal calculated from a single Langevin function with which is the value calculated from the ratio of the signals at the 3rd and 5th frequencies at zero bias field. The function is normalized so the maxima are equal to that of the measured data. It is clear that the Langevin function fits the data only for smaller bias fields. Two other Langevin functions are shown that were calculated with representing smaller nanoparticles: first with a radius which is 70% of that of the first Langevin function, , amplified by a factor of 4, and second with a radius which is 50% of that of the first Langevin function, , amplified by a factor of 8.
In the fit shown in Fig. 7(a), the larger nanoparticles dominate the signal at low bias fields and the smaller nanoparticles dominate the signal at higher bias fields. To demonstrate, Fig. 7(b) shows the signal from the iron oxide nanoparticles at the 2nd harmonic frequency with several signal Langevin functions. The first Langevin function used the estimated from the ratio of the signal at the 3rd and 5th harmonic frequencies. The signal predicted by this single Langevin function matches the measured signal at smaller bias fields but not at larger bias fields. At larger bias fields, larger values of are required to match the measured signal implying that larger numbers of smaller nanoparticles are responsible for the signal in the presence of larger bias fields.
IV. DISCUSSION
The increase in the signal at the 2nd harmonic frequency with bias field is very similar to that reported in other contexts (compare Fig. 4 to Fig. 1 in Ref. 14). The shape of the increase in the signal at the 2nd harmonic frequency with bias field is very consistent for the different nanoparticles and the different drive fields used here as predicted by the Langevin model shown in Fig. 3.
Langevin functions predict the general shape of the signal as a function of bias field but single Langevin functions do not reproduce the exact shape of the signal. For example, the signal at the 2nd harmonic increases from zero to a peak and then tails off slowly in both Fig. 3 and Fig. 4 but the length of the tail is much longer for the experimental data in Fig. 4. The comparison is more explicit for the signal at the 2nd harmonic frequency in Fig. 7. The single Langevin function model also predicts the bias field where the maximum signal will occur quite well but does not predict the field at which all of the nanoparticles are saturated well at all. The primary reason is the size distribution of nanoparticles. Figure 7 shows how multiple Langevin functions for different size nanoparticles can predict the signal shape. However, it should be noted that the coercive field is not included in the model so the model’s results might well be closer to the experimental results if the coercive field for each nanoparticle size were known.
The implications of this work for MPI are varied. The most significant is that the addition of a bias magnetic field introduces signal at the 2nd harmonic frequency which is larger than the signal at the 3rd harmonic frequency with no bias field so the sensitivity to lower concentrations of nanoparticles could be improved. The increase in sensitivity depends on the nanoparticles used but would be a factor of 3 for the iron oxide nanoparticles tested here. If the signal at the 2nd harmonic frequency is used, instead of saturating the nanoparticles outside the voxel imaged which requires large static fields, the object can be imaged by applying a bias field at the position to be interrogated and allowing the zero bias field at other positions to eliminate the signal. Another implication almost as significant is that not only must the nanoparticles have the highest saturation magnetization possible but the nanoparticle size must be tightly controlled because the presence of small nanoparticles that are very difficult to saturate contributes significantly to the signal even at relatively high bias fields. At low bias fields the largest nanoparticles in the size distribution dominate the signal but the smaller nanoparticles become dominant at higher bias fields so the size distribution should be as tight as possible if saturation is used to localize the signal. There is also a potential impact for the design of the fields saturating the nanoparticles outside the field free volume. Figure 4 shows that the signal at the 3rd harmonic frequency is effectively saturated at but reaches another peak at that is roughly a third of the signal with no bias field. Therefore, the gradient in the bias field needs to be steep enough that very few nanoparticles are in fields ranging from or because they contribute significant signal and could be far from the field free volume so the signal will represent a convolution of the nanoparticle distribution. The specific numbers will change for different nanoparticles and more importantly for different size distributions but the pattern will be similar for all nanoparticles. The difficulty in saturating all of the nanoparticles is exacerbated using the signal at the 2nd harmonic frequency because the signal is still almost 15% of the maximum signal at bias field of and is still a few percent of the maximum at .
If the concentration of nanoparticles is high enough to measure several of the higher harmonics, the distribution of signal among those harmonics could be used to help spatial localize the nanoparticles along a known field gradient. High concentrations of magnetic nanoparticles occur in applications such as magnetic fluid hyperthermia.6
V. CONCLUSIONS
Static bias magnetic fields distort the symmetry that produces only odd harmonics from nanoparticles in a harmonic driving field. The signals at the even harmonic frequencies are larger than those at the odd harmonic frequencies; e.g., the maximum signal at the 2nd harmonic frequency is a factor of 3 larger than that at the 3rd harmonic frequency at this field strength. For MPI systems based on the original design, the distribution of nanoparticle sizes probably should be limited especially reducing the number of small nanoparticles because they are difficult to saturate completely.
ACKNOWLEDGMENTS
Funding for this project was provided by the Norris Cotton Cancer Center and by the Department of Radiology, Dartmouth-Hitchcock Medical Center.
REFERENCES
- 1.Gleich B. and Weizenecker J., “Tomographic imaging using the nonlinear response of magnetic particles,” Nature (London) 10.1038/nature03808435(30), 1214–1219 (2005). [DOI] [PubMed] [Google Scholar]
- 2.Day C., “Novel medical imaging method shows promise,” Phys. Today 58(9), 21–22 (2005). [Google Scholar]
- 3.Pankhurst Q. A., Connolly J., Jones S. K., and Dobson J., “Applications of magnetic nanoparticles in biomedicine,” J. Phys. D 10.1088/0022-3727/36/13/20136, R167–R181 (2003). [DOI] [Google Scholar]
- 4.Dahnke H. and Schaeffter T., “Limits of detection of SPIO at using relaxometry,” Magn. Reson. Med. 10.1002/mrm.2043553, 1202–1206 (2005). [DOI] [PubMed] [Google Scholar]
- 5.Heyn C., Ronald J. A., Mackenzie L. T., MacDonald I. C., Chambers A. F., Rutt B. K., and Foster P. J., “In vivo magnetic resonance imaging of single cells in mouse brain with optical validation,” Magn. Reson. Med. 10.1002/mrm.2074755, 23–29 (2006). [DOI] [PubMed] [Google Scholar]
- 6.Jordan A., Scholz R., Wust P., Fahling H., and Felix R., “Magnetic fluid hyperthermia (MFH): Cancer treatment with AC magnetic field induced excitation of biocompatible superparamagnetic nanoparticles,” J. Magn. Magn. Mater. 10.1016/S0304-8853(99)00088-8201, 413–419 (1999). [DOI] [Google Scholar]
- 7.Cognet L., Tardin C., Boyer D., Choquet D., Tamarat P., and Lounis B., “Single metallic nanoparticle imaging for protein detection in cells,” Proc. Natl. Acad. Sci. U.S.A. 10.1073/pnas.1534635100100(20), 11350–11355 (2003). [DOI] [PMC free article] [PubMed] [Google Scholar]
- 8.Nutt R., Vento L. J., and Ridinger M. H. T., “In vivo molecular imaging biomarkers: Clinical pharmacology’s new ‘PET’?” Clin. Pharmacol. Ther. 81(6), 792–795 (2007). [DOI] [PubMed] [Google Scholar]
- 9.Weizenecker J., Borgert J., and Gleich B., “A simulation study on the resolution and sensitivity of magnetic particle imaging,” Phys. Med. Biol. 10.1088/0031-9155/52/21/00152, 6363–6374 (2007). [DOI] [PubMed] [Google Scholar]
- 10.Krause H. J., Wolters N., Zhang Y., Offenhausser A., Miethe P., Meyer M. H. F., Hartmann M., and Keusgen M., “Magnetic particle detection by frequency mixing for immunoassay applications,” J. Magn. Magn. Mater. 10.1016/j.jmmm.2006.10.1164311, 436–444 (2007). [DOI] [Google Scholar]
- 11.Bracewell R. N., The Fourier Transform and Its Applications (McGraw–Hill, New York, 1986), pp. 189–195 [Google Scholar]
- 12.Crouch A. E., Dean A., Torres C., and Aron J., “Development of nonlinear harmonic sensors for detection of mechanical damage,” Southwest Research Institute Technical Final Report DOE Contract No. DE-FC26-01NT41156 March, 2004
- 13.Ghatak S. K., Mitra A., and Sen D., “Magnetization and harmonic response of composites,” Phys. Rev. B 10.1103/PhysRevB.45.95145(2), 951–955 (1992). [DOI] [PubMed] [Google Scholar]
- 14.Baltag O., Costandache D., and Cotae C., “Behavior of some nonlinear devices with ferrofluids,” J. Magn. Magn. Mater. 157/158, 591–592 (1996). [Google Scholar]
- 15.Baltag O. and Costandache D., “Nonlinear behavior of the ferrofuid in orthogonal magnetic fields,” J. Magn. Magn. Mater. 10.1016/S0304-8853(99)00114-6201, 123–125 (1999). [DOI] [Google Scholar]
- 16.Kaiser R. and Miskoloczy G., “Magnetic properties of stable dispersions of subdomain magnetite particles,” J. Appl. Phys. 10.1063/1.165881241, 1064–1072 (1970). [DOI] [Google Scholar]
- 17.Herzer G., “Grain size dependence of coercivity and permeability in nanocrystalline ferromagnets,” IEEE Trans. Magn. 10.1109/20.10438926, 1397–1402 (1990). [DOI] [Google Scholar]
- 18.Goya G. F., Berquo T. S., Fonseca F. C., and Morales M. P., “Static and dynamic magnetic properties of spherical magnetite nanoparticles,” J. Appl. Phys. 10.1063/1.159995994(5), 3520–3528 (2003). [DOI] [Google Scholar]
- 19.Kellar K. E., Fujii D. K., Gunther W. H. H., Briley-Sæbø K., Bjørnerud A., Spiller M., and Koenig S. H., “NC100150 injection, a preparation of optimized iron oxide nanoparticles for positive-contrast MR angiography,” J. Magn. Reson Imaging 11, 488–494 (2000). [DOI] [PubMed] [Google Scholar]
- 20.Zeng Q., Baker I., Loudis J. A., Liao Y., Hoopes P. J., and Weaver J. B., “ oxide nanocomposite particles with large specific absorption rate for hyperthermia,” Appl. Phys. Lett. 90, 233112–1 233112–3 (2007). [Google Scholar]
- 21.Kiss L. B., Söderlund J., Niklasson G. A., and Granqvist C. G., “New approach to the origin of lognormal size distributions of nanoparticles,” Nanotechnology 10.1088/0957-4484/10/1/00610, 25–28 (1999). [DOI] [Google Scholar]


