

Abstract
Homogenate extraction technology was developed for extraction of gardenia yellow pigment from Gardenia jasminoides Ellis fruit. The operating parameters affecting the color value of gardenia yellow pigment were studied on the basis of a Box-Behnken design and response surface methodology. Results showed that the optimum extraction conditions were as follows: extraction time 41 s, ethanol concentration 50 %, ratio of liquid to material 15:1 (mL:g) and particle size 1.7 mm. Under the optimum condition, the experimental color value was 52.37 g−1, which was in keeping with the predicted one. Compared with the heat extraction method, the color value of gardenia yellow pigment of homogenate extraction was higher and the extraction time was shorter. Homogenate extraction method is an ideal means for extraction of gardenia yellow pigment from Gardenia jasminoides Ellis fruit.
Keywords: Homogenate extraction, Yellow pigment, Color value, Response surface methodology
Introduction
Gardenia jasminoides Ellis, belonging to the Rubiaceae family, is an evergreen shrub cultivated in many temperate regions. The oval shaped fruits of the plant attain a reddish yellow color when it is ripe in late autumn. Gardenia yellow pigment is one of natural colorants extracted from gardenia fruit and widely utilized, especially in East Asia, as a coloring agent for foods (Yamada et al. 1996; Lee et al. 2005). The main components of gardenia yellow pigment are crocetin and crocin which is the digentiobiosyl ester of trans-crocetin (Van Calsteren et al. 1997). Gardenia yellow pigment has good water solubility and it is non-toxic and chemically stable compared with many other natural food pigments. It has generated a growing demand and gained numerous applications in international markets. Common method for the extraction of gardenia yellow pigment is heat extraction, but it suffered from some limitations such as time and energy consuming.
Homogenate extraction is an alternative to conventional extraction methods, through which chemical compositions are extracted from material in solvent by high-speed mechanical shearing, mixing, fluid cutting action and smashing without heating and pressure. The method has been documented to be effective in extracting camptothecine and hydroxycamptothecin from Camptotheca acuminata leaves (Shi et al. 2009) and isoflavones from soybean meal (Zhu et al. 2011). However, its application on the extraction of gardenia yellow pigment from Gardenia jasminoides Ellis fruit has not been reported.
The objectives of this study were to apply homogenate extraction to gardenia yellow pigment extraction. The effects of various extraction parameters such as particle size, ethanol concentration, extraction time and ratio of liquid to material on the color value of gardenia yellow pigment were investigated by response surface methodology which is an effective tool for optimizing the process. The color value of gardenia yellow pigment obtained by homogenate extraction was compared with that of the product by traditional heat extraction.
Experimental
Materials and reagents
Gardenia jasminoides Ellis fruits were derived from Anji County, Zhejiang Province, China, and authenticated by Prof. Shui-Li Zhang. Voucher specimen (No. 0400153) was deposited in the Herbarium of the Botany Division of IBSC. The fruits were dried at 60 °C and ground. Crocin (99 % purity) was purchased from Identification of Pharmaceutical and Biological Products (China). Ethanol (AC grade) was obtained from Tianjin Chemical Reagent Factory (Tianjin, China).
Apparatus
High speed pulverizer (DFY-500) was provided by Ding Guang Machinery Equipment Co., Ltd. (Shanghai, China). Homogrnate extractor (JHBE-50A) was purchased from Golden Star Technology, Inc., Ltd. (Zhengzhou, China). Rotary evaporator (EYELA N-1100) was purchased from Ailang Co., Ltd. (Shanghai, China). UV–vis spectrophotometer (756PC) was carried out by Shanghai Spectrum Instruments Co., Ltd. (Shanghai, China). Vacuum Drying Oven (DZF) was purchased from Jing Hong Experimental Equipment Co., Ltd. (Shanghai, Chain).
Assay of gardenia yellow pigment
Gardenia yellow pigment powder (0.1 g) was transferred into a 100 mL volumetric flask and dissolved with 50 % ethanol-water solution and the final volume was adjusted to 100 mL. 50 % ethanol-water solution was used as contrast, and the absorbance of sample solution was recorded at 440 nm by UV–vis spectrophotometer. The color value of gardenia yellow pigment  (g−1) was calculated using equation:
 |
1 |
Where A is the absorbance value (440 nm) of the gardenia yellow pigment sample with 1 % mass concentration in a 1 cm width cuvette, and m is the amount of gardenia yellow pigment (g).
Homogenate extraction of gardenia yellow pigment
Gardenia fruit powder (20.0 g) and ethanol were put in the homogenate extractor for extraction in a designed extraction time, ethanol concentration, ratio of liquid to material and particle size at room temperature. After the extraction, the mixture was centrifuged at 4700 r/min for 10 min. The supernatant was collected, concentrated by evaporation in a rotary evaporator and then dried in a vacuum drying oven. The whole extraction process was carried out thrice.
Heat extraction of gardenia yellow pigment
According to the optimal conditions, gardenia fruit powder (20.0 g) was mixed with 300 mL of 50 % ethanol-water solution in a round bottom flask fitted with a condenser and stirred for 1 h at a temperature of 50 °C. The mixture was cooled and centrifuged at 4700 r/min for 10 min. The latter steps were the same as the homogenate extraction method. The whole extraction process was carried out thrice.
Experimental design
Response surface methodology was applied to identify optimum levels of three variables, regarding as the extraction time (X1), ethanol concentration (X2) and ratio of liquid to material (X3), respectively. Color value of gardenia yellow pigment (Y) was taken as the response of the design experiments. The coded independent variables used in the RSM design are listed in Table 1. The experimental design was ground on a Box-Benhnken design (BBD). A total of 17 experimental runs with different combinations of three-factors were carried out. The experimental designs with the observed responses for color value of gardenia yellow pigment were presented in Table 2. Five replicates at the centre of the design were used to allow for estimation of a pure error sum of squares. A second-order polynomial function was fitted to correlate the relationship of each independent variable to the response. The form of the second-order polynomial equation is as follows:
 |
2 |
Table 1.
Coded levels of independent variables used in the RSM design
| Factor | Levels | ||
|---|---|---|---|
| −1 | 0 | 1 | |
| Extraction time X1 (s) | 30 | 40 | 50 |
| Ethanol concentration X 2 (%) | 40 | 50 | 60 |
| Ratio of liquid to material X3 (mL:g) | 10 | 15 | 20 |
Table 2.
Experimental design and responses of the dependent variables to the extract parameters
| Numbers | X1 | X 2 | X3 | Actual color valuea (g−1) | Predicted color value (g−1) |
|---|---|---|---|---|---|
| −1 | −1 | 0 | 42.97 | 43.46 | |
| 2 | −1 | 1 | 0 | 46.92 | 46.58 |
| 3 | 1 | −1 | 0 | 48.54 | 48.88 |
| 4 | 1 | 1 | 0 | 46.51 | 46.02 |
| 5 | 0 | −1 | −1 | 46.35 | 45.98 |
| 6 | 0 | −1 | 1 | 48.14 | 47.68 |
| 7 | 0 | 1 | −1 | 46.57 | 47.03 |
| 8 | 0 | 1 | 1 | 46.51 | 46.88 |
| 9 | −1 | 0 | −1 | 40.98 | 40.86 |
| 10 | 1 | 0 | −1 | 44.49 | 44.52 |
| 11 | −1 | 0 | 1 | 42.90 | 42.87 |
| 12 | 1 | 0 | 1 | 43.93 | 44.05 |
| 13 | 0 | 0 | 0 | 51.31 | 52.07 |
| 14 | 0 | 0 | 0 | 51.97 | 52.07 |
| 15 | 0 | 0 | 0 | 52.84 | 52.07 |
| 16 | 0 | 0 | 0 | 51.96 | 52.07 |
| 17 | 0 | 0 | 0 | 52.27 | 52.07 |
a All data are given as mean of 3 replicate experiments
Where Y is the response variable, βo, βj, βjj and βij are the intercept coefficient, the linear coefficient, quadratic coefficient and interaction coefficient, respectively. Xi and Xj are independent coded variables. The variables were coded according to the equation:
 |
3 |
Where xi is the dimensionless coded value of the variable Xi, X0 is the value of Xi at the centre point, and ΔX is the step change.
Results and discussion
Single factor experiment
Effect of extraction time on the color value of gardenia yellow pigment
As shown in Fig. 1a, the color value of gardenia yellow pigment increased with extraction time from 10 to 40 s. Results demonstrated that color value of gardenia yellow pigment reached 35.1 g−1 at the special time point of 40 s. After this point, it remained relatively stable with time increasing. 30–50 s was chosen as the extraction time in the Box-Benhnken design process.
Fig. 1.
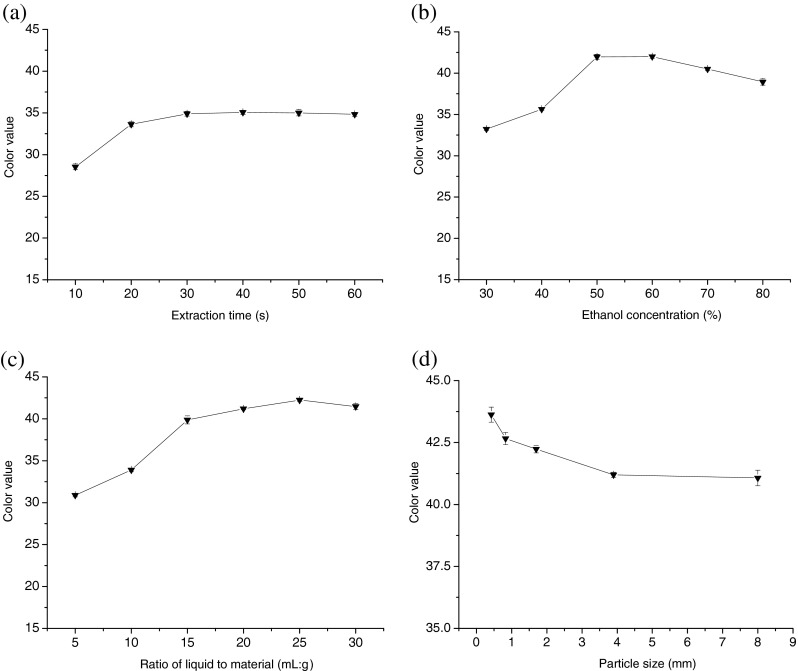
The effect of extraction time (a), ethanol concentration (b), ratio of material to liquid (c) and particle size (d) on the color value of gardenia yellow pigment (n = 3)
Effect of ethanol concentration on the color value of gardenia yellow pigment
In this study, ethanol was selected to be the experimental solvent. Figure 1b showed that the color value of gardenia yellow pigment increased with the ethanol concentration between 30 and 50 %, and decreased in the range of 50–80 %. It reached the highest value of 45.2 g−1 at ethanol concentration of 50 %. With ethanol concentration increased, the liquid solubility of gardenia yellow pigment increased. Too high ethanol concentration leads to lower pigments solubilization, resulting in the decreasement of the color value. Therefore, in the Box-Benhnken design process, 40–60 % ethanol-water solution was chosen as the test solvent.
Effect of ratio of liquid to material on the color value of garden yellow pigment
As shown in Fig. 1c, the color value of gardenia yellow pigment increased with the increase of ratio of liquid to material. When the ratio of liquid to material was 15:1 (mL:g), the color value reached 39.8 g−1, then it increased unobviously. Higher ratio of liquid to material may need to be coordinated with more cost. So, according to Box-Benhnken design principle, the range of ratio of liquid to material was chosen between 10:1 and 20:1 (mL:g).
Effect of particle size on the color value of gardenia yellow pigment
The gardenia fruits were ground to pass through a sieve of 2, 5, 10, 20 and 40 mesh and the particle sizes of gardenia fruits were D90 ≥ 8, 3.9, 1.7, 0.83 and 0.42 mm, respectively. Figure 1d showed that the particle size of gardenia fruit powder had no significant influence on color value. Therefore, it need not be taken into account in the Box-Benhnken design process and particle size was chosen 1.7 mm.
Result analysis
The objective of the present study was to optimize the operating conditions of homogenate extraction of gardenia yellow pigment. Data were analyzed using Design Expert 7.1.6 software for statistical analysis of variance (ANOVA), regression coefficients and regression equation. The mathematical model generated from the experimental data is expressed by the following quadratic equation:
 |
4 |
Where Y is the color value of gardenia yellow pigment, X1, X2 and X3 are the actual values of the variables for extraction time, ethanol concentration and ratio of liquid to material, respectively.
As shown in Table 3, the experimental data fitted well to the quadratic model by ANOVA. The second-order polynomial regression model was in good agreement with the experimental results, with R2 of 0.9798. At the same time, the lack-of-fit statistics, which was used to test the adequacy of the model, indicated that the P-value (0.132) for color value was not significant. No abnormality was obtained from the diagnoses pf residuals. Thus, it can be concluded that the model was statistically sound. The model F-value of 37.69 (P < 0.0001), which implied that the quadratic response surface model was highly significant. The P-value denoting the significance of the coefficients was important to understand the pattern of the mutual interactions between the variables, whose value below 0.05 indicated that the test parameter was significant at the 5 % level of significance. It can be seen that the variable with significant effect was the linear term of homogenate extraction time (P = 0.002). The quadratic terms of homogenate extraction time (P < 0.0001) and ratio of liquid to material (P < 0.0001) as well as the two-level interaction between extraction time and ethanol concentration had higher effects on the color value of gardenia yellow pigment, followed by the quadratic term of ethanol concentration (P = 0.0211).
Table 3.
Results of the variance analysis of regression model
| Source | df | Sum of Squares | Mean Square | F-value | Prob > F |
|---|---|---|---|---|---|
| Model | 9 | 224.44 | 24.94 | 37.69 | < 0.0001** |
| X1 | 1 | 15.18 | 15.18 | 22.94 | 0.002** |
| X 2 | 1 | 0.45 | 0.45 | 0.68 | 0.4361 |
| X3 | 1 | 1.25 | 1.25 | 1.89 | 0.212 |
| X1X2 | 1 | 13.48 | 13..58 | 20.52 | 0.0027** |
| X1X3 | 1 | 1.63 | 1.63 | 2.46 | 0.161 |
| X2X3 | 1 | 0.86 | 0.86 | 1.29 | 0.2929 |
| X21 | 1 | 101.41 | 101.41 | 157.4 | < 0.0001** |
| X22 | 1 | 5.8 | 5.8 | 8.76 | 0.0211* |
| X23 | 1 | 66.3 | 66.3 | 100.21 | < 0.0001** |
| Residual | 7 | 4.63 | 0.66 | ||
| Lack of Fit | 3 | 3.34 | 1.11 | 3.44 | 0.132 |
| Pure Error | 4 | 1.29 | 0.32 | ||
| Cor Total | 16 | 229.07 | R2 = 0.9798 |
*p < 0.05 significant, **p < 0.01 highly significant, df, degree of freedom
To determine optimal levels of the test variables for the color value of gardenia yellow pigment, the 3D response surface described by the regression model is presented in Fig. 2a, b, c. To depict the interactive effects of operational variables on responses, one variable was kept constant while the other two variables varied in defined ranges. The shapes of response surfaces and contour plots indicate the nature and extent of the interaction between different variables. Figure 2a showed the effect of ethanol concentration and extraction time on the color value of gardenia yellow pigment. The color value increased with ethanol concentration and extraction time, respectively. When the extraction time reached a certain value, the color value decreased. Figure 2b showed the effect of extraction time and ratio of liquid to material on the color value of gardenia yellow pigment. When extraction time and ratio of liquid to material increased, the color value rose to the climax then fall down, respectively. The effect of ethanol concentration and ratio of liquid to material on the color value of gardenia yellow pigment was shown in Fig. 2c. Higher color value of gardenia yellow pigment was generally obtained with increasing ethanol concentration. There were rather sharp dropoffs in the color value as the ratio of liquid to material approached either 10:1 (mL:g) or 20:1 (mL:g).
Fig. 2.
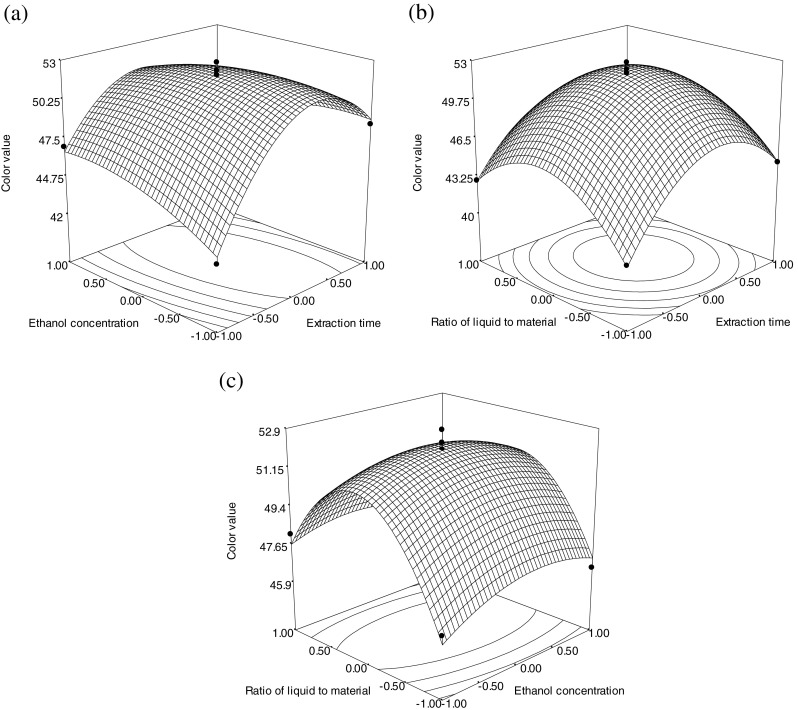
Response surface plots (a, b, c) showing the effect of extraction time, ethanol concentration and ratio of liquid to material on the color value of gardenia yellow pigment
In order to corroborate the optimal value, Eq. (4) was gained as follows: the optimal values were X1 = 0.14, X2 = −0.01, X3 = 0.04, three experiments were performed to show that when the optimum extraction parameters were extraction time 41.4 s, ethanol concentration 49.9 %, ratio of liquid to material 15.2:1 (mL:g). For convenience, the following process parameters were used: extraction time 41 s, ethanol concentration 50 %, ratio of liquid to material 15:1 (mL:g).
Triplicate experiments were performed under the determined conditions and the color value of gardenia yellow pigment (52.37 g−1) in agreement with the predicted value (52.16 g−1) was obtained. This indicated that the model was adequate for the extraction process. The HPLC chromatogram of the extract under optimized conditions and crocin standards was shown in Fig. 3. Crocin standards (a) and gardenia yellow pigment extracted from Gardenia jasminoides Ellis fruit (b) have a typical HPLC peak in the retention time 9.7 min.
Fig. 3.

The HPLC profile of crocin standards (a) and gardenia yellow pigment (b). The samples were quantified by Waters HPLC system with a Eclipse XDB-C18 column (4.6 mm×150 mm, 5μm, Waters, USA) at 25 ºC. The mobile phase was acetonitrile and water (15:85, v/v) with a flow rate of 1.0 mL/min
Comparison of different extraction method
Homogenate extraction and heat extraction methods were compared for their color value at the optimized conditions. Results were listed in Table 4. The color value of gardenia yellow pigment (52.37 g−1) with homogenate extraction was 16.57 % higher than heat extraction (43.69 g−1), and the extraction time was shortened. What’s more, the homogenate extraction was performed at room temperature, which could avoid the damage of thermosensitive components and save more energy.
Table 4.
Comparison of results of homogenate and heat extraction methods
| Extraction methods | Extraction time (s) | Ethanol concentration (%) | Ratio of liquid to material (mL:g) | Color valuea (g−1) |
|---|---|---|---|---|
| Homogenate extraction | 41 | 50 | 15:1 | 52.37 |
| Heat extraction | 3600 | 50 | 15:1 | 43.69 |
a All data are given as mean of 3 replicate experiments
Conclusion
In this paper, homogenate extraction technology was used to extract gardenia yellow pigment from Gardenia jasminoides Ellis fruit. The optimal processing parameters determined by response surface methodology were as follows: extraction time 41 s, ethanol concentration 50 %, ratio of liquid to material 15:1 (mL:g), particle size of material 1.7 mm. Under these conditions, the experimental color value was 52.37 g−1, agreed well with the predicted color value of 52.16 g−1. Moreover, compared with the heat extraction, homogenate extraction technology has advantages on saving time, extracting in room temperature and getting production with higher color value. It is proved to be an efficient method for extraction of gardenia yellow pigment from Gardenia jasminoides Ellis fruit.
Acknowledgement
We are grateful to the Natural Science Foundation of China (No. 21006097, 21076191 and 21176222) and Program of International S&T Cooperation (No. 2008DFR40280) for financial help.
References
- Lee IA, Lee JH, Baek NI, Kim DH. Antihyperlipidemic effect of crocin isolated from the fructus of Gardenia jasminoides and its metabolite crocetin. Bio Pharm Bull. 2005;28:2106–2110. doi: 10.1248/bpb.28.2106. [DOI] [PubMed] [Google Scholar]
- Shi WG, Zu YG, Zhao CJ, Lei Y. Homogenate extraction technology of camptothecine and hydroxycamptothecin from Camptotheca acuminata leaves. J For Res. 2009;20:168–170. doi: 10.1007/s11676-009-0030-2. [DOI] [Google Scholar]
- Van Calsteren MR, Bissonnette MC, Cormier F, Dufresne C, Ichi T, Yves Le Blanc JC, Perreault D, Roewer I. Spectroscopic characterization of crocetin derivatives from Crocus sativus and Gardenia jasminoides. J Agric Food Chem. 1997;45:1055–1061. doi: 10.1021/jf9603487. [DOI] [Google Scholar]
- Yamada S, Oshima H, Saito I, Hayakawa J. Adoption of crocetin as an indicator compound for detection of gardenia yellow in food products (Analysis of natural coloring matters in food V) J Food Hyg Soc Jap. 1996;37:372–377. doi: 10.3358/shokueishi.37.6_372. [DOI] [Google Scholar]
- Zhu XY, Lin HM, Xie J, Chen SS, Wang P. Homogenate extraction of isoflavones from soybean meal by orthogonal design. J Sci Ind Res. 2011;70:455–460. [Google Scholar]