Abstract
We present a multicrystal Johann-type hard x-ray spectrometer (∼5–18 keV) recently developed, installed, and operated at the Stanford Synchrotron Radiation Lightsource. The instrument is set at the wiggler beamline 6-2 equipped with two liquid nitrogen cooled monochromators – Si(111) and Si(311) – as well as collimating and focusing optics. The spectrometer consists of seven spherically bent crystal analyzers placed on intersecting vertical Rowland circles of 1 m of diameter. The spectrometer is scanned vertically capturing an extended backscattering Bragg angular range (88°–74°) while maintaining all crystals on the Rowland circle trace. The instrument operates in atmospheric pressure by means of a helium bag and when all the seven crystals are used (100 mm of projected diameter each), has a solid angle of about 0.45% of 4π sr. The typical resolving power is in the order of . The spectrometer's high detection efficiency combined with the beamline 6-2 characteristics permits routine studies of x-ray emission, high energy resolution fluorescence detected x-ray absorption and resonant inelastic x-ray scattering of very diluted samples as well as implementation of demanding in situ environments.
I. INTRODUCTION
During the last decade, the availability of high brilliance synchrotron radiation facilities boosted the development and the applicability of high-resolution x-ray spectroscopic techniques. X-ray emission (XES), resonant inelastic x-ray scattering (RIXS), and high energy resolution fluorescence detected x-ray absorption (HERFD-XAS) have been well-established as advanced characterization tools. Their element-specificity provides insights into the electronic structure and local chemical environment1–4 of many materials. In the soft x-ray regime (<2 keV), and through grazing incidence angle grating spectrometers arranged on Rowland-based geometries,5,6 XES and RIXS have provided unique insights in relevance to the energetics, momentum, and spin of superconductors and transition metal oxides, as well as surface chemistry of adsorbates.1,7–10 On the other hand, hard x-rays provide some advantages related to the implementation of demanding sample environments and thus expand the applicability of these techniques to a broader field of scientific applications.2,3 For example, electrochemical studies under in situ conditions, measurements on enzymes, proteins, catalytic systems under ambient conditions, or transition metal complexes have been studied routinely in the past few years.11–20 Further on, XES has also been used to study the dynamics of time dependent systems with a temporal resolution of few picoseconds,21,22 as limited by the storage ring technology. The recent availability of femtosecond hard x-ray sources, such as the Linear Coherent Light Source, provides some unique opportunities for the study of ultra-fast electronic structure dynamics in various phenomena,24 such as electron transfer processes, transient molecular states, molecular dissociation, etc.
Typically, hard x-rays are resolved with high-energy-resolution by employing Bragg type perfect-crystal x-ray optics. The efficient collection of x-rays emitted from a divergent x-ray point source can be achieved with high-energy-resolution when single or multiple bent crystals are arranged in the so-called Johann,25 Johansson,26 or Von Hamos27 geometries. These geometries can be separated by the way a spectrum is collected, i.e., point-to-point focusing where the collection of different energy points requires scanning elements, or energy dispersive geometries, where the full spectrum is collected simultaneously without the need of any moving parts.
In the Von Hamos geometry, a cylindrically bent crystal disperses the radiation along its flat surface's plane and focuses it along its axis of curvature onto a line like feature. The spatially distributed signal is recorded with a position sensitive detector at the crystal's focusing axis providing the overall spectrum. Alternative wavelength dispersive concepts have been proposed and implemented based on Johansson geometry having the source positioned inside the Rowland circle.28 Various setups based on these aforementioned conceptual principles have been built up to the present moment.23,28–33 Dispersive setups have certain important practical advantages since they do not incorporate movable parts and record the overall spectrum simultaneously. The latter point becomes especially relevant for X-ray Free Electron Laser (XFEL) type of experiments; a multicrystal Von Hamos spectrometer was recently build for this purpose.23 On the other hand, the two main disadvantages of the dispersive setups are: (1) the much larger exposed detector area, which unavoidably increases the background to signal ratio and (2) the fact that the effective solid angle depends on the exact spectral range which might vary depending on the study. This is particularly limiting for HERFD-XAS studies where often a very narrow spectral range is required, which in turn results in a very small solid angle.
Point-to-point scanning instruments in Rowland circle geometries can provide orders of magnitude higher signal to background ratio and often a larger solid angle. A prototype single element Johann spectrometer was built in early 1990s at NSLS.37 Since then, multi-crystal spectrometers based on intersecting Rowland circles have been developed, enhancing the solid angle and therefore sensitivity as well as collection efficiency. The first of these multi-crystal instruments was developed by Wang et al.;38 an updated design based on an 8-crystal analyzer spectrometer using a simpler scanning procedure was built by Bergmann and Cramer.39 Currently, various multi-crystal instruments are in operation at several synchrotron radiation facilities;34–42,45–48 until recently a 14-crystal spectrometer operated with a simplified energy scanning scheme at the Stanford Synchrotron Radiation Lightsource (SSRL).3
Here, we present the design and discuss the performance of a new dedicated 7-crystal Johann-type hard x-ray spectrometer developed at SSRL. The instrument is used for hard x-ray emission and resonant inelastic x-ray scattering, as well as high energy resolved fluorescence detection x-ray absorption and extended x-ray absorption fine structure applications. Some examples demonstrating the performance of this now operational end-station will be discussed.
II. TECHNICAL DESCRIPTION
The x-ray spectrometer is stationed at the 57-pole 0.9T wiggler beamline 6-2 at SSRL. Beamline 6-2 is equipped with two liquid nitrogen cooled double crystal monochromators, a Si(111) (ϕ = 0) and a Si(311) (ϕ = 0) device that can be alternately operated depending on the required energy resolution. A collimating and a focusing Rh-coated mirrors are positioned before and after the monochromator, respectively. The beamline delivers monochromatic x-rays over an energy range of 4–18 keV. Under the current SPEAR3 storage ring operational conditions (electron energy of 3 GeV, current 500 mA in top-off mode) and through the Si(311) (Si(111)) monochromator, an incident beam flux of ∼4 × 10¹² photons/s (2 × 10¹³ photons/s) at 6.5 keV with an energy resolution of about 180 meV (850 meV) and a beam size of about 140 × 400 μm2 (v×h) is delivered at the sample position (∼28 m from the source).
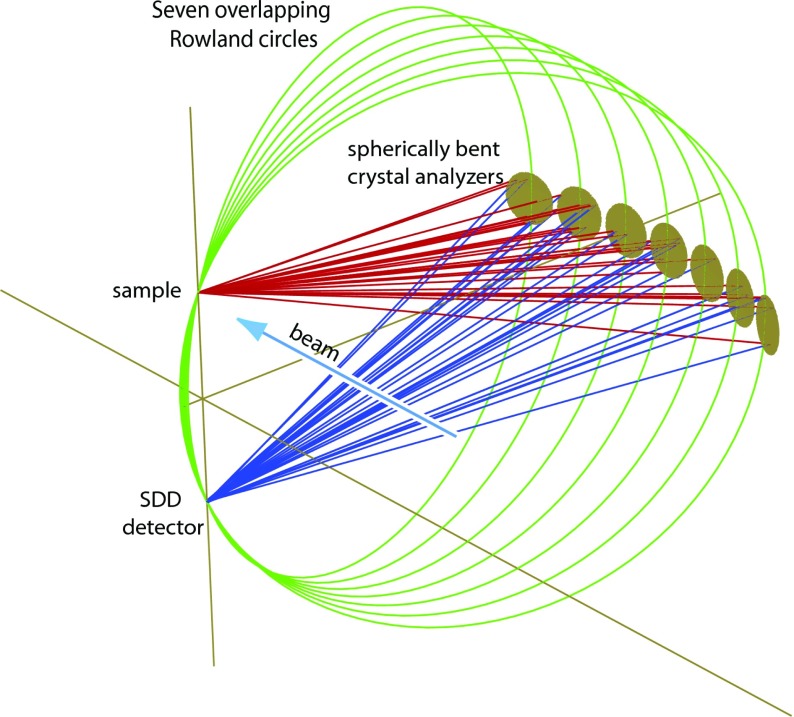
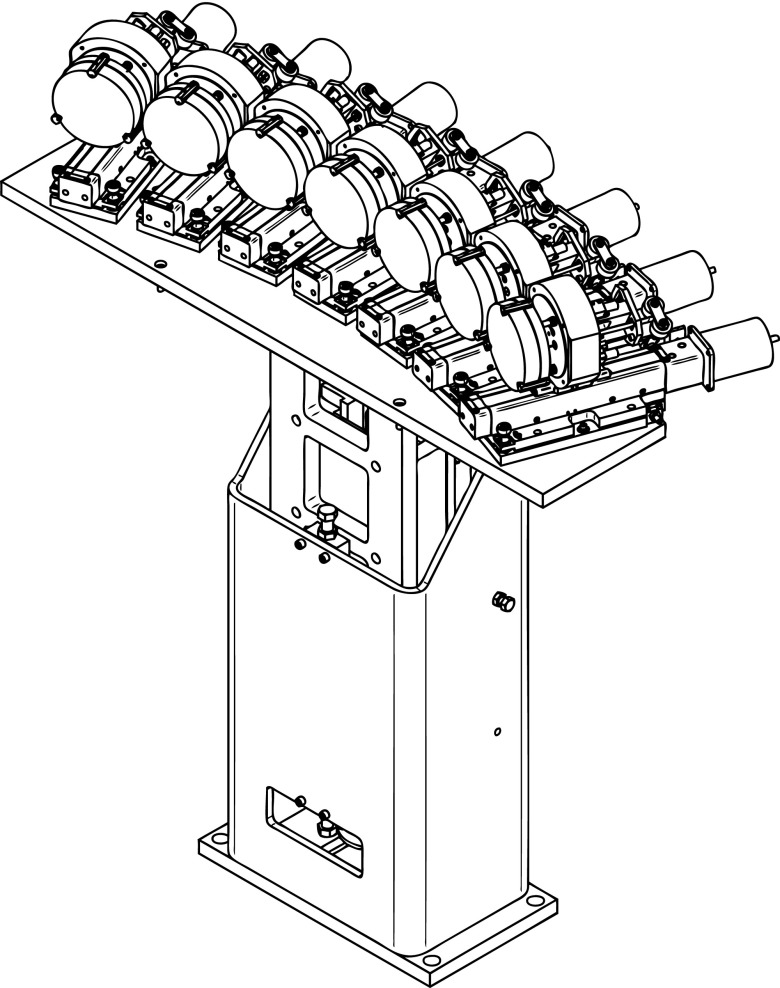
The seven analyzer crystals are placed on intersecting Rowland circles of 1 m of diameter (Fig. 1). Following the Johann geometry, the analyzer crystals, with a projected diameter of 100 mm, are spherically bent to a radius of 1 m. The Rowland circle is set on the vertical plane since the vertical beam size is smaller than the horizontal one and thus the contribution of the geometric effects within the energy resolution is minimized.39 In order to minimize unwanted x-ray scattering the seven crystals are placed around ∼90° with respect to the incident beam direction along the horizontal plane, covering an angular range of ∼75°–120°. The solid angle of the instrument, when all seven crystals are used, is 0.45% of 4π sr. All crystal modules are positioned on a common rigid hosting plate that moves vertically with a stepper motor (Fig. 2). Each crystal module can move along its normal direction through its respective linear translation stage; this motion allows the crystals to follow the exact Rowland circle as the spectrometer is scanned. The analyzed signal from all crystals is recorded simultaneously with a detector placed on a vertical motorized stage. The detector's overall range of motion allows the spectrometer to capture Bragg angles between 74° and 88° (Bragg angles even closer to backscattering, >88°, can be reached when the sample environment permits it). The detector routinely used is a silicon drift detector (energy resolution full width at half maximum (FWHM) of about 150 eV at 5.9 keV). Such an energy resolving detector further separates the wanted analyzed signal from the unwanted diffuse scattering or other fluorescence radiation that may reach the detector. This can improve the signal to background ratio significantly and is of particular importance when one needs to analyze very weak signals (e.g., valence electron transitions in diluted samples). For high-count rate applications, or ∼ps time-resolved studies, the detector can be replaced with an avalanche photodiode. Since the overall experimental station operates in atmospheric pressure, a polypropylene bag filled with helium is used to minimize both the attenuation and the diffuse scattering of the x-rays as they propagate from the sample to the analyzers and then toward the detector.
FIG. 1.
Schematic representation of the overlapping Rowland circles concept. Seven spherically bent crystal analyzers are aligned on the same sample-detector axis.
FIG. 2.
Spectrometer's mechanical drawing.
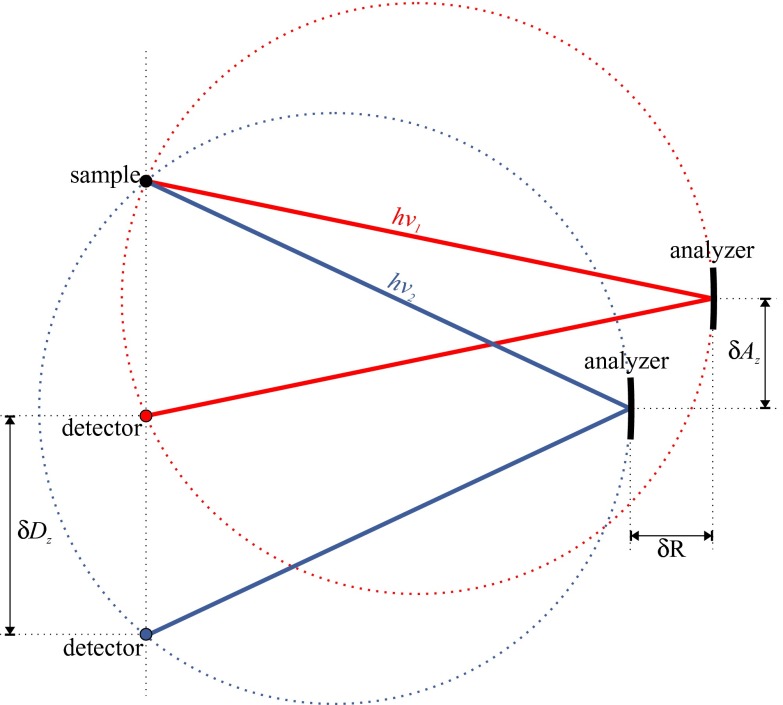
The spectrometer's energy scanning scheme is based on the Bragg angle equation and trigonometric expressions that represent the Rowland circle geometric conditions (Fig. 3). In this way, the positions for all spectrometer's motors for a given analyzed photon energy hν (in eV) are calculated through the following expressions.
| (1) |
| (2) |
| (3) |
| (4) |
where θ is the Bragg angle, dhkl the d-spacing for the given crystal orientation/type used, R the distance of the crystals from the sample-detector axis, Az the distance of the crystal from the sample/incident x-ray beam plane, and Dz the detector's distance from the incident x-ray beam plane (all distances in mm). The actual positions of all motors (R, Dz, Az) have been measured with an accuracy of less than 1 mm, whereas the relative motions of the motorized stages have been calibrated within <0.5%.
FIG. 3.
Schematic representation of the relative translations (δR, δAZ, δDz) of motors R, Az, Dz for two different photon energies hν1 and hν2; the analyzer is maintained on the exact Rowland circle (shown with dotted lines).
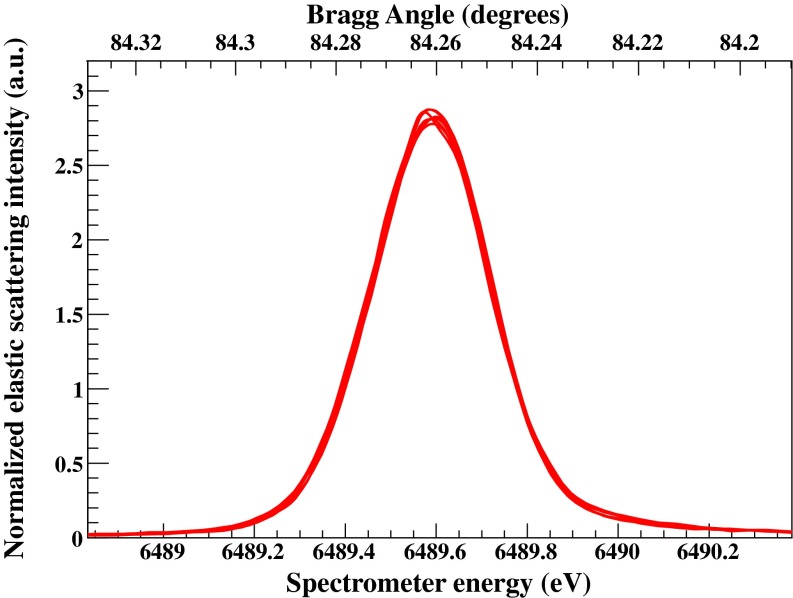
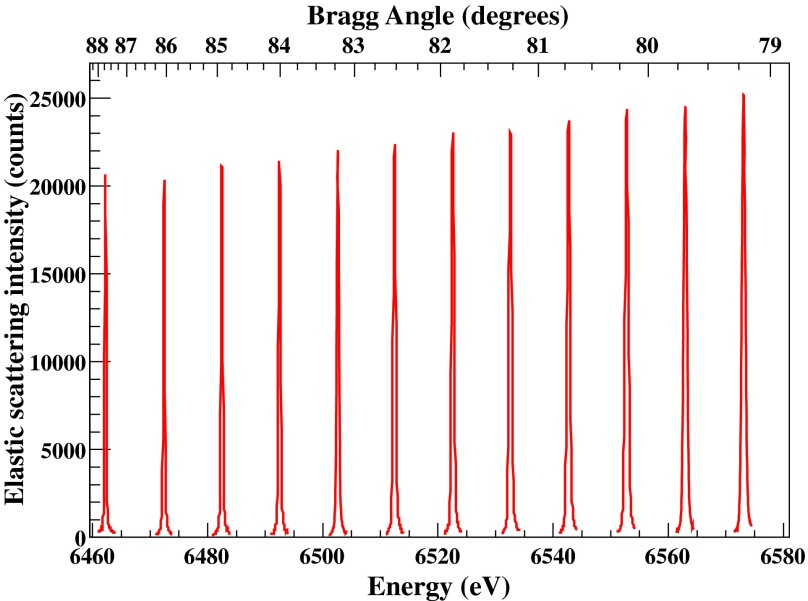
Each analyzer crystal is installed on a motorized module providing the yaw and pitch angular motions required for its alignment. The adopted modules have been described in details elsewhere.42 For a given set of crystals these angular positions are initially aligned by using a laser source and thus according to their optical surface. The fine alignment of their angular positions and the correction for slight miscuts (if the Bragg plane is not parallel to the crystal surface) is accomplished with x-rays (most frequently with elastic scattering scans). Iterative scripts have been developed in order to facilitate and optimize the overall x-ray based alignment procedure of the spectrometer. Figure 4 shows seven elastic scattering peaks for each of the seven spectrometer's crystal positions using a Si(440) diced-and-bent crystal cut analyzer42,76 and the Si(311) monochromator. All elastic peaks have been normalized to their integrated area for comparison purposes; the response is identical. In order to calibrate the spectrometer's nominal energy values (calculated solely through the measured distances) with respect to the monochromator, the elastic peaks are measured along the overall energy range required for a given study. For instance, Fig. 5 shows elastic scattering peaks along an energy range of 6462–6572 eV.
FIG. 4.
Seven elastic scattering scans at 6489.58 eV (Bragg angle ∼84.26°) for each of spectrometer's crystal positions. The response is identical. (Note: to compensate the polarization of the incident radiation and thus the strong angular dependence of the scattering intensity, the elastic scans for the various spectrometer positions have been normalized to their integrated area for comparison purposes.)
FIG. 5.
Elastic peaks along an extended energy range of the spectrometer covered using diced-and-bent Si(440) cut.
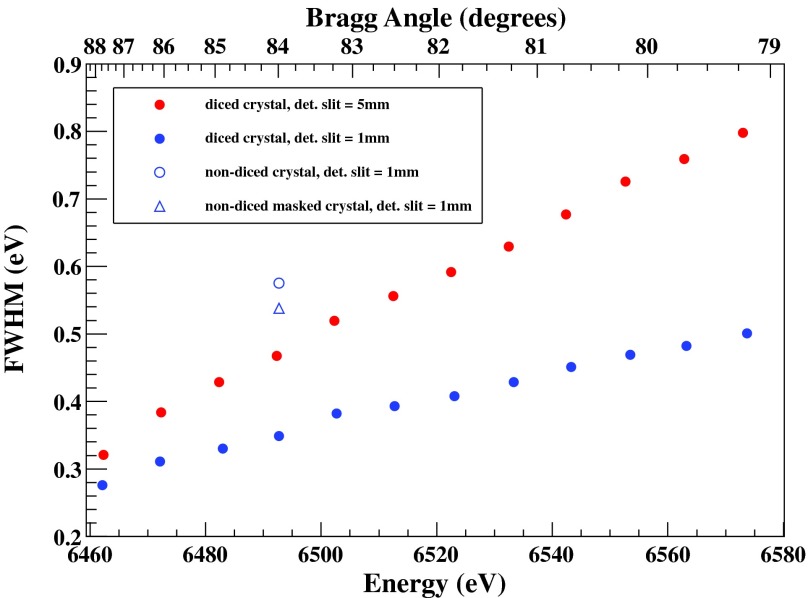
As the Bragg angle moves away from the 90° backscattering geometry, the energy resolution of the spectrometer is expected to gradually degrade. This is due to geometrical effects inherent to the Johann geometry () and has been extensively reported in previous works.39 Figure 6 shows the evolution of the FWHM along the whole range of the recorded scattering peaks presented in Fig. 5 (note that the FWHM corresponds to the cumulative contribution of the Si(311) monochromator employed here and that of Si(440) crystal analyzers). We compare the evolution of the FWHM when using two sets of vertical slits of different size, 5 mm (practically uncollimated) and 1 mm, in front of the detector. A dramatic improvement of the energy resolution is achieved when using the tighter set of slits, especially as the diffraction angle moves away from the backscattering, i.e., where the geometry effects have more prominent contribution (for the present case when moving from 5 mm detector slit size to 1 mm, the overall intensity is reduced by about a factor of 2). In the same Fig. 6, some representative FWHM values are given for conventional (non-diced) spherical Si(440) analyzers of 100 mm of diameter with and without masking the crystal along its dispersive direction (in both cases a 1 mm vertical detector slit is used). It is worth noting that under identical conditions, the maxima of the elastic peak for the conventional analyzer found to be 10% higher compare to the diced-and-bent one (we should keep in mind that the diced-and-bent crystal has effectively 20% smaller active area due to the cuts42).
FIG. 6.
Experimental full width at half maximum (FWHM) of the elastic scattering peaks with the diced-and-bent Si(440). Data for 5 mm and 1 mm slits in front of the SDD detector are shown. Also, a representative value for a conventional bent analyzer (non-diced) of 100 mm diameter is given with and without masking its outermost 25 mm along the dispersive direction.
For capturing as many fluorescence lines as possible within the 5–18 keV energy range, and for the available spectrometer's angular scanning range (74°–88°), we are gradually obtaining an extended collection of crystal analyzers. Up to the present moment, the available crystal cuts are the followings: Si(110) (diced-and-bent and conventional), Si(111), Si(211), Si(620), Si(551), Si(1020), Si(553), Ge(110), Ge(111), Ge(211), and Ge(620). In Fig. 7, the energy ranges captured with the available crystals (accounting their various allowed high order reflections) are displayed with horizontal bars; some exemplary x-ray emission lines and absorption edges are also shown. The energy resolution for these conventional spherically bent crystals is typically in the order of (for diced-and-bent ones this factor can be increased by a factor of ∼2). As shown in Fig. 6, masking the crystals’ outermost areas can result in improvements on the energy resolution up to 20%; however, the magnitude depends also on the quality of the analyzers.
FIG. 7.
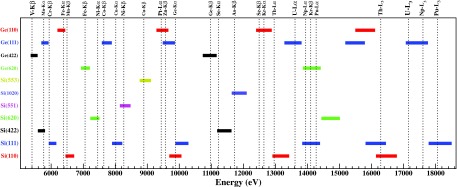
Energy ranges for the current SSRL's crystal collection ( Si(110), Si(111), Si(211), Si(620), Si(551), Si(1020), Si(553), Ge(110), Ge(111), Ge(211), and Ge(620)) accounting their various high order allowed reflections. These energies can be analyzed within the 74°–88° scanning angular range of the spectrometer. Some exemplary emission lines and absorption edges are also indicated.
III. EXAMPLES
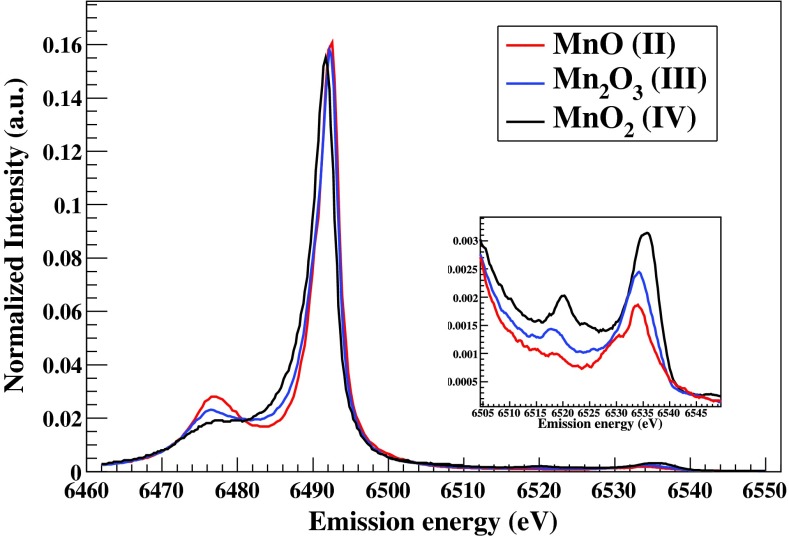
In Fig. 8 we present non-resonant Kβ x-ray emission spectra from three polycrystalline manganese compounds (MnO, Mn2O3, MnO2). These measurements were collected using the conventional Si(440) crystal analyzers while the spectrometer was scanned within the Bragg angular range of 88°–80°; the incident energy was set at 7000 eV. The spectrometer's high throughput typically provides the peak intensity of the 3d metals’ Kα1 fluorescence line to be of about several 106 photons per second per crystal analyzer when ∼1013 incident photons per second are tuned right above the absorption edge and when thick pure samples are used. In the same way, for the peak intensity of the Kβ lines the spectrometer provides from several 105 to about 106 counts per second per analyzer crystal. Kβ non-resonant x-ray emission spectroscopy on 3d metals is a routine analytical methodology and its chemical sensitivity has been discussed in the literature.2 In such spectra two regions of interest can be distinguished. The prominent Kβ main line features are at the lower energies, and the significantly weaker K-valence features lie at the higher energies close to the absorption edge (expanded within the inset figure of Fig. 8). For both cases the obtained spectra are broadened due to the lifetime of the initial and final states involved (normally the initial state (1s) has the dominant contribution, about 1–2 eV for the 3d metals43), as well as to the spectrometer's response function. Since the experimental energy resolution is smaller than the lifetime of the involved states (), the instrument's contribution to the total energy broadening is negligible. In non-resonant emission experiments, the incident beam energy resolution does not have any influence neither. However, it should be noted that as the incident photon energy gets gradually above the ionization threshold, multi-electron shake-off/ups processes are slowing opening and this may result on satellite spectral fingerprints within the emission spectrum.44
FIG. 8.
Kβ x-ray emission from various polycrystalline manganese compounds (MnO, Mn2O3, MnO2). The inset figure shows the K-valence emission pattern. Spectra have been normalized to the integrated area of the Kβ main lines.
The Kβ main lines (Kβ1,3 and Kβ’) correspond to the 3p → 1s core electron transitions; the chemical sensitivity comes indirectly from the electron-electron interactions and core screening effect of the valence electrons. For 3d transition metals such as Mn, the Kβ1,3 and Kβ’ splitting is mostly due to the 3p-3d exchange interaction consisting a fingerprint for the metal's spin and oxidation state (and indirectly to the local geometrical structure). Various data analysis schemes have been proposed and adopted for Kβ main lines depending on the application, e.g., the maxima position, the first moment position or the integrated absolute difference with respect to a reference spectrum.2,49–57 However, the complete theoretical reconstruction of Kβ main lines for molecular and condensed matter systems through ab initio approaches remains yet unresolved and theoretical efforts beyond atomic multiplet theory are undergoing. This is a topic of paramount interest for spectroscopists since it would provide a thorough understanding of the emission pattern and potentially enhance the electronic structure insights that Kβ-based x-ray emission spectroscopy provides.
On the other hand, the valence to core transitions, although exhibiting about two orders of magnitude weaker transition probabilities, have a direct sensitivity on the local chemical environment/structure through the occupied valence orbitals (for the valence electrons involved in the symmetry allowed electronic transitions). It has been shown that for various systems simple one electron transition calculations, based on ground state wavefunctions, could address all the spectral fingerprints within the K valence x-ray emission spectra.13,58–63 In this way, Density Functional Theory (DFT) approaches provide a direct intuitive insight about the spectral patterns and the electronic structure changes due to the ligand environment modifications. Most notably, the so-called crossover K valence fingerprint has been shown to sensitively discriminate ligands with similar atomic number (e.g., C, N, O) within metal's first coordination shell, overcoming in this way a limitation of EXAFS.13,14,62–65 The weak nature of those transition stimulates instrument developments such as the one presented here.
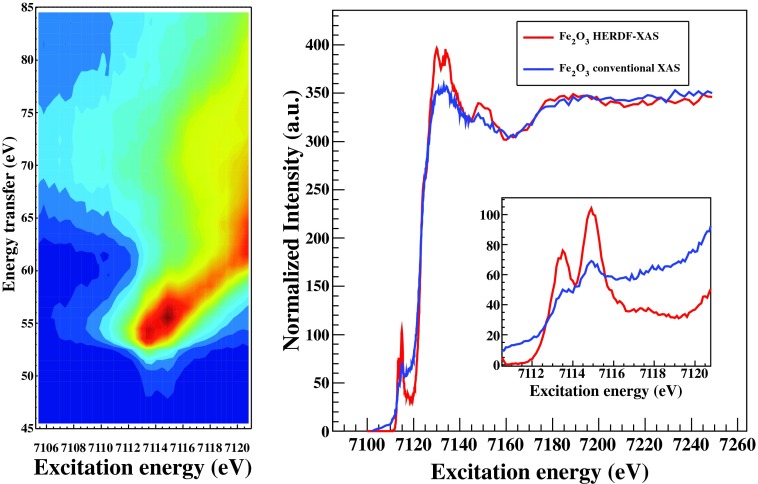
Recording of x-ray emission while tuning the incident radiation along the absorption edge allows resonant x-ray emission (RXES) studies, referred also as RIXS. In Fig. 9, we present a resonant study on a polycrystalline Fe2O3 measured with Ge(620) analyzers and using a Si(311) monochromator (the combined monochromator and analyzers energy resolution was 0.7 eV). A RIXS contour map is shown in the left, and a HERFD-XAS on the right (compared with a conventional XAS spectrum obtained using the Fe-Kα fluorescence discriminated by a solid state silicon detector). Several reports in the literature discuss about both RIXS spectroscopy and HERFD-XAS characteristics as well as the relevant emerging applications.2,3,66–68 The HERFD-XAS is practically a diagonal cut along the RIXS contour map (when plotted as incident energy versus energy transfer), i.e., when the x-ray emission energy is fixed while scanning the incident radiation energy. The main advantages of HERFD-XAS are two-fold; the signal-to-background is significantly improved since crystal analyzers resolve any overlapping fluorescence peaks and/or scattering radiation within the detection channel, while it sharpen the XAS spectral features (this becomes evident for instance for the t2g and eg pre-edge peaks shown within the inset of Fig. 9). However, the interpretation of HERFD-XAS through conventional XAS calculations (i.e., the recorded spectrum to represent the linear absorption coefficient) should be handled with care since this can be reliably attempted only when final-state effects are absent. For instance, for 5d metals it has been demonstrated that this assumption stands very well and XAS calculations can be used for interpretation purposes.17,69,70,73 On other hand, for the 3d transition metals final state effects may be prominent and the full RIXS map would then be required for identifying them. For the exemplary case presented in Fig. 9 it is shown that HERFD-XAS along the contour's diagonal represents a reliable approximation of the XAS.
FIG. 9.
A RIXS contour map of Fe2O3 along the pre-edge of Fe (left). Comparison of a HERFD-XAS and conventional fluorescence XAS spectrum using a solid state detector integrating the Fe-Kα line (right).
Since the contribution of the core hole broadening in resonant spectroscopies is not as prominent as in the non-resonant experiments, the energy resolution of the spectrometer/incident beam may not have a negligible influence anymore. Thus in certain case studies having an 1s lifetime comparable energy resolution may become a limitation. For such type of applications diced crystals can be incorporated enhancing the energy resolution of this spectrometer to few hundreds of meV (in the present case further improvement of the energy resolution would not improve the overall performance due to the Si(311) monochromator energy resolution limitation). The implementation of four bounces monochromators with high order cuts combined with diced analyzers and positions sensitive detectors has be shown to exhibit significant improvement on the energy resolution (),35,71,72 however that comes at the expense of the throughput.
IV. CONCLUSION
Described here is a multicrystal Johann-type hard x-ray spectrometer recently developed, installed and now operating at SSRL. The setup consists of 7 analyzer crystals arranged on overlapping vertical Rowland circles. The spectrometer can be scanned vertically, within the Bragg angular range of 74°–88°, maintaining the exact Rowland circle condition for all the analyzers. Using SSRL's wide collection of Si and Ge crystal cuts the spectrometer can efficiently analyze x-ray energies within the energy range of about 5–18 keV. The large solid angle acceptance of the instrument combined with point-to-point focusing geometry and the energy dispersive silicon drift detector, minimizes the background signal and ensure an optimized detection sensitivity for weak signals and/or dilute samples.
X-ray emission, high-energy resolution x-ray absorption spectroscopy and resonant inelastic x-ray scattering techniques exhibit a growing interest within the scientific community. The emerging applicability of these powerful spectroscopic techniques on cross-disciplinary scientific fields requires advanced instruments coupled to high-brilliance x-ray sources in order to achieve the required throughput and energy-resolution as well as the flexibility to accommodate demanding sample environments. In situ catalysis on surfaces, matter under extreme condition, radiation sensitive metalloproteins and protein samples includes only some examples of cases that need to be routinely addressed on synchrotron radiation facilities worldwide. Up to the present moment a wide scientific research program is supported with the presented advanced instrumentation at SSRL.17,23,24,74,75 The projected new SSRL's undulator beamline which will be dedicated to high-resolution x-ray spectroscopy purposes, is expected to boost even further the capabilities of the instrument towards a wider range of applications, especially related to the more efficient implementation of high pressure studies (e.g., diamond anvil cells), as well as the laser-pump x-ray probe scheme for ∼ps time-resolved applications.
ACKNOWLEDGMENTS
Support from SLAC staff is thankfully acknowledged. The spectrometer was funded by the America Recovers and Reinvests Act Project No. 2005045. The Stanford Synchrotron Radiation Lightsource is a National User Facility operated by Stanford University on behalf of the U.S. Department of Energy, Office of Basic Energy Sciences.
REFERENCES
- 1.Kotani A. and Shin S., Rev. Mod. Phys. 73, 203 (2001). 10.1103/RevModPhys.73.203 [DOI] [Google Scholar]
- 2.Glatzel P. and Bergmann U., Coord. Chem. Rev. 249(1–2), 65–95 (2005). 10.1016/j.ccr.2004.04.011 [DOI] [Google Scholar]
- 3.Bergmann U. and Glatzel P., Photosynth. Res. 102(2–3), 255–266 (2009). 10.1007/s11120-009-9483-6 [DOI] [PubMed] [Google Scholar]
- 4.de Groot F. M. F. and Kotani A., Core Level Spectroscopy of Solids (Taylor and Francis, New York, 2008). [Google Scholar]
- 5.Nordgren J., Bray G., Cramm S., Nyholm R., Rubensson J. E., and Wassdahl N., Rev. Sci. Instrum. 60(7), 1690–1696 (1989). 10.1063/1.1140929 [DOI] [Google Scholar]
- 6.Ghiringhelli G., Piazzalunga A., Dallera C., Trezzi G., Braicovich L., Schmitt T., Strocov V. N., Betemps R., Patthey L., Wang X., and Grioni M., Rev. Sci. Instrum. 77, 113108 (2006). 10.1063/1.2372731 [DOI] [Google Scholar]
- 7.Ament L. J. P., van Veenendaal M., Devereaux T. P., Hill J. P., and van den Brink J., Rev. Mod. Phys. 83(2), 705–767 (2011). 10.1103/RevModPhys.83.705 [DOI] [Google Scholar]
- 8.Nilsson A. and Pettersson L. G. M., Surf. Sci. Rep. 55(2–5), 49–167 (2004). 10.1016/j.surfrep.2004.06.002 [DOI] [Google Scholar]
- 9.Schiros T., Haq S., Ogasawara H., Takahashi O., Öström H., Andersson K., Pettersson L.G.M., Hodgson A., and Nilsson A., Chem. Phys. Lett. 429(4–6), 415–419 (2006). 10.1016/j.cplett.2006.08.048 [DOI] [Google Scholar]
- 10.Miller D. J., Öberg H., Kaya S., Sanchez Casalongue H., Friebel D., Anniyev T., Ogasawara H., Bluhm H., Pettersson L. G. M., and Nilsson A., Phys. Rev. Lett. 107, 195502 (2011). 10.1103/PhysRevLett.107.195502 [DOI] [PubMed] [Google Scholar]
- 11.Bergmann U., Glatzel P., and Cramer S. P., Microchem. J. 71(2–3), 221–230 (2002). 10.1016/S0026-265X(02)00014-0 [DOI] [Google Scholar]
- 12.Bergmann U., Glatzel P., deGroot F., and Cramer S. P., J. Am. Chem. Soc. 121, 4926–4927 (1999). 10.1021/ja984454w [DOI] [Google Scholar]
- 13.Bergmann U., Horne C. R., Collins T. J., Workman J. M., and Cramer S. P., Chem. Phys. Lett. 302(1–2), 119–124 (1999). 10.1016/S0009-2614(99)00095-0 [DOI] [Google Scholar]
- 14.Lancaster K. M., Roemelt M., Ettenhuber P., Hu Y. L., Ribbe M. W., Neese F., Bergmann U., and DeBeer S., Science 334(6058), 974–977 (2011). 10.1126/science.1206445 [DOI] [PMC free article] [PubMed] [Google Scholar]
- 15.Alonso Mori R., Paris E., Giuli G., Eeckhout S. G., Kavcic M., Zitnik M., Bucar K., Pettersson L. G. M., and Glatzel P., Inorg. Chem. 49(14), 6468–6473 (2010). 10.1021/ic100304z [DOI] [PubMed] [Google Scholar]
- 16.Alonso Mori R., Paris E., Giuli G., Eeckhout S. G., Kavcic M., Zitnik M., Bucar K., Pettersson L. G. M., and Glatzel P., Anal. Chem. 81(15), 6516–6525 (2009). 10.1021/ac900970z [DOI] [PubMed] [Google Scholar]
- 17.Merte L. R., Behafarid F., Miller D. J., Friebel D., Cho S., Mbuga F., Sokaras D., Alonso-Mori R., Weng T.-C., Nordlund D., Nilsson A., and Cuenya B. R., ACS Catal. 2(11), 2371 (2012). 10.1021/cs300494f [DOI] [Google Scholar]
- 18.Pushkar Y., Long X., Glatzel P., Brudvig G. W., Dismukes G. C., Collins T. J., Yachandra V. K., Yano J., and Bergmann U., Angew. Chem., Int. Ed. 49(4), 800–803 (2010). 10.1002/anie.200905366 [DOI] [PMC free article] [PubMed] [Google Scholar]
- 19.Glatzel P., Singh J., Kvashnina K. O., and van Bokhoven J. A., J. Am. Chem. Soc. 132(8), 2555 (2010). 10.1021/ja907760p [DOI] [PubMed] [Google Scholar]
- 20.Smolentsev G., Soldatov A. V., Messinger J., Merz K., Weyhermuller T., Bergmann U., Pushkar Y., Yano J., Yachandra V. K., and Glatzel P., J. Am. Chem. Soc. 131(36), 13161–13167 (2009). 10.1021/ja808526m [DOI] [PMC free article] [PubMed] [Google Scholar]
- 21.Vanko G., Glatzel P., Pham V. T., Abela R., Grolimund D., Borca C. N., Johnson S. L., Milne C. J., and Bressler C., Angew. Chem., Int. Ed. 49(34), 5910–5912 (2010). 10.1002/anie.201000844 [DOI] [PubMed] [Google Scholar]
- 22.Haldrup K., Vankó G., Gawelda W., Galler A., Doumy G., March A. M., Kanter E. P., Bordage A., Dohn A., van Driel T. B., Kjaer K. S., Lemke H. T., Canton S. E., Uhlig J., Sundström V., Young L., Southworth S. H., Nielsen M. M., and Bressler C., J. Phys. Chem. A 116(40), 9878 (2012). 10.1021/jp306917x [DOI] [PubMed] [Google Scholar]
- 23.Alonso-Mori R., Kern J., Sokaras D., Weng T.-C., Nordlund D., Tran R., Montanez P., Delor J., Yachandra V. K., Yano J., and Bergmann U., Rev. Sci. Instrum. 83, 073114 (2012). 10.1063/1.4737630 [DOI] [PMC free article] [PubMed] [Google Scholar]
- 24.Alonso-Mori R., Kern J., Gildea R. J., Sokaras D., Weng T.-C., Lassalle-Kaiser B., Tran R., Hattne J., Laksmono H., Hellmich J., Glöckner C., Echols N., Sierra R. G., Schafer D. W., Sellberg J., Kenney C., Herbst R., Pines J., Hart P., Herrmann S., Grosse-Kunstleve R. W., Latimer M. J., Fry A. R., Messerschmidt M. M., Miahnahri A., Seibert M. M., Zwart P. H., White W. E., Adams P. D., Bogan M. J., Boutet S., Williams G. J., Zouni A., Messinger J., Glatzel P., Sauter N. K., Yachandra V. K., Yano J., and Bergmann U., Proc. Natl. Acad. Sci. U.S.A. 109(47), 19103 (2012). 10.1073/pnas.1211384109 [DOI] [PMC free article] [PubMed] [Google Scholar]
- 25.Johann H. H., Z. Phys. 69, 185 (1931). 10.1007/BF01798121 [DOI] [Google Scholar]
- 26.Johansson T., Z. Phys. 82, 507 (1933). 10.1007/BF01342254 [DOI] [Google Scholar]
- 27.Hamos L. v., Naturwiss. 20, 705–706 (1932). 10.1007/BF01494468 [DOI] [Google Scholar]
- 28.Kavčič M., Budnar M., Mühleisen A., Gasser F., Žitnik M., Bučar K., and Bohinc R., Rev. Sci. Instrum. 83, 033113 (2012). 10.1063/1.3697862 [DOI] [PubMed] [Google Scholar]
- 29.Hoszowska J. and Dousse J. C., J. Electron Spectrosc. Relat. Phenom. 137–140, 687–690 (2004). 10.1016/j.elspec.2004.02.005 [DOI] [Google Scholar]
- 30.Hayashi H., Kawata M., Takeda R., Udagawa Y., Watanabe Y., Takano T., Nanao S., and Kawamura N., J. Electron Spectrosc. Relat. Phenom. 136(1–2), 191–197 (2004). 10.1016/j.elspec.2004.02.148 [DOI] [Google Scholar]
- 31.Dickinson B., Seidler G. T., Webb Z. W., Bradley J. A., Nagle K. P., Heald S. M., Gordon R. A., and Chou I. M., Rev. Sci. Instrum. 79(12), 123112 (2008). 10.1063/1.3048544 [DOI] [PubMed] [Google Scholar]
- 32.Mattern B. A., Seidler G. T., Haave M., Pacold J. I., Gordon R. A., Planillo J., Quintana J., and Rusthoven B., Rev. Sci. Instrum. 83, 023901 (2012). 10.1063/1.3680598 [DOI] [PubMed] [Google Scholar]
- 33.Szlachetko J., Nachtegaal M., de Boni E., Willimann M., Safonova O., Sa J., Smolentsev G., Szlachetko M., van Bokhoven J. A., Dousse J.-Cl., Hoszowska J., Kayser Y., Jagodzinski P., Bergamaschi A., Schmitt B., David C., and Lücke A., Rev. Sci. Instrum. 83, 103105 (2012). 10.1063/1.4756691 [DOI] [PubMed] [Google Scholar]
- 34.Kao C. C., Hamalainen K., Krisch M., Siddons D. P., and Oversluizen T., Rev. Sci. Instrum. 66, 1699 (1995). 10.1063/1.1146467 [DOI] [Google Scholar]
- 35.Gog T., Seidler G. T., Casa D. M., Upton M. H., Kim J., Stoupin S., Nagle K. P., Balasubramanian M., Gordon R. A., Fister T. T., Heald S. M., Toellner T., Hill J. P., Coburn D. S., Kim Young-June, Said A. H., Alp E. E., Sturhahn W., Yavas H., Burns C. A., and Sinn H., Synchrotron Radiat. News 22, 12 (2009). 10.1080/08940880903397009 [DOI] [Google Scholar]
- 36.Hill J. P., Coburn D. S., Kim Y.-J., Gog T., Casa D. M., Kodituwakku C. N., and Sinn H., J. Synchrotron Radiat. 14, 361 (2007). 10.1107/S0909049507018006 [DOI] [PubMed] [Google Scholar]
- 37.Stojanoff V., Hamalainen K., Siddons D. P., Hastings J. B., Berman L. E., Cramer S., and Smith G., Rev. Sci. Instrum. 63(1), 1125–1127 (1992). 10.1063/1.1143112 [DOI] [PubMed] [Google Scholar]
- 38.Wang X., Grush M. M., Froeschner A. G., and Cramer S. P., J. Synchrotron Radiat. 4, 236–242 (1997). 10.1107/S0909049596015440 [DOI] [PubMed] [Google Scholar]
- 39.Bergmann U. and Cramer S. P., Proc. SPIE 3448, 198–209 (1998). 10.1117/12.332507 [DOI] [Google Scholar]
- 40.Glatzel P., de Groot F. M. F., and Bergmann U., Synchrotron Radiat. News 22(2), 12–16 (2009). 10.1080/08940880902813725 [DOI] [Google Scholar]
- 41.Llorens I., Lahera E., Delnet W., Proux O., Braillard A., Hazemann J. L., Prat A., Testemale D., Gelebart F., Morand M., Shukla A., Bardou N., Ulrich O., Arnaud S., Berar J. F., Boudet N., Caillot B., Chaurand P., Rose J., Doelsch E., Martin P., and Solari P. L., Rev. Sci. Instrum. 83, 063104 (2012). 10.1063/1.4728414 [DOI] [PubMed] [Google Scholar]
- 42.Sokaras D., Nordlund D., Weng T. C., Alonso-Mori R., Velikov P., Wagner D., Garachtchenko A., George M., Borzenets V., Johnson B., Rabedeau T., and Bergmann U., Rev. Sci. Instrum. 83, 043112 (2012). 10.1063/1.4704458 [DOI] [PMC free article] [PubMed] [Google Scholar]
- 43.Krause M. O. and Oliver J. H., J. Phys. Chem. Ref. Data 8, 329 (1979). 10.1063/1.555595 [DOI] [Google Scholar]
- 44.Kavčič M., Žitnik M., Bučar K., Mihelič A., Štuhec M., Szlachetko J., Cao W., Alonso Mori R., and Glatzel P., Phys. Rev. Lett. 102, 143001 (2009). 10.1103/PhysRevLett.102.143001 [DOI] [PubMed] [Google Scholar]
- 45.Kleymenov E., van Bokhoven J. A., David C., Glatzel P., Janousch M., Alonso-Mori R., Studer M., Willimann M., Bergamaschi A., Henrich B., and Nachtegaal M., Rev. Sci. Instrum. 82, 065107 (2011). 10.1063/1.3600452 [DOI] [PubMed] [Google Scholar]
- 46.Qian Q., Tyson T. A., Caliebe W. A., and Kao C. C., J. Phys. Chem. Solids 66, 2295–2298 (2005). 10.1016/j.jpcs.2005.09.069 [DOI] [Google Scholar]
- 47.Verbeni R., Kocsis M., Huotari S., Krisch M., Monaco G., Sette F., and Vanko G., J. Phys. Chem. Solids 66, 2299–2305 (2005). 10.1016/j.jpcs.2005.09.079 [DOI] [Google Scholar]
- 48.Journel L., El Khoury L., Marin T., Guillemin R., Carniato S., Avila A., Delaunay R., Hague C. F., and Simon M., Rev. Sci. Instrum. 80, 093105 (2009). 10.1063/1.3212582 [DOI] [PubMed] [Google Scholar]
- 49.Bergmann U., Grush M. M., Horne C. R., DeMarois P., Penner-Hahn J. E., Yocum C. F., Wright D. W., Dube C. E., Armstrong W. H., Christou G., Eppley H. J., and Cramer S. P., J. Phys. Chem. B 102, 8350 (1998). 10.1021/jp982038s [DOI] [Google Scholar]
- 50.Visser H., Anxolabehere-Mallart E., Bergmann U., Glatzel P., Robblee J. H., Cramer S. P., Girerd J.-J., Sauer K., Klein M. P., and Yachandra V. K., J. Am. Chem. Soc. 123, 7031 (2001). 10.1021/ja004306h [DOI] [PMC free article] [PubMed] [Google Scholar]
- 51.Pizarro S. A., Glatzel P., Visser H., Robblee J. H., Christou G., Bergmann U., Yachandra V. K., Phys. Chem. Chem. Phys. 6, 4864–4870 (2004). 10.1039/b407513g [DOI] [PMC free article] [PubMed] [Google Scholar]
- 52.Bargar J. R., Tebo B. M., Bergmann U., Webb S. M., Glatzel P., Chiu V. Q., and Villalobos M., Am. Mineral 90, 143–154 (2005). 10.2138/am.2005.1557 [DOI] [Google Scholar]
- 53.Doonan C. J., Zhang L., Young C. G., George S. J., Deb A., Bergmann U., George G. N., and Cramer S. P., Inorg. Chem. 44, 2579 (2005). 10.1021/ic050129f [DOI] [PubMed] [Google Scholar]
- 54.Gretarsson H., Lupascu A., Kim J., Casa D., Gog T., Wu W., Julian S. R., Xu Z. J., Wen J. S., Gu G. D., Yuan R. H., Chen Z. G., Wang N.-L., Khim S., Kim K. H., Ishikado M., Jarrige I., Shamoto S., Chu J.-H., Fisher I. R., and Kim Y.-J., Phys. Rev. B 84, 100509(R) (2011). 10.1103/PhysRevB.84.100509 [DOI] [Google Scholar]
- 55.Chen J. M., Haw S. C., Lee J. M., Chou T. L., Chen S. A., Lu K. T., Liang Y. C., Lee Y. C., Hiraoka N., Ishii H., Tsuei K. D., Huang E., and Yang T. J., Phys. Rev. B 84, 125117 (2011). 10.1103/PhysRevB.84.125117 [DOI] [Google Scholar]
- 56.Simonelli L., Saini N. L., Moretti Sala M., Mizuguchi Y., Takano Y., Takeya H., Mizokawa T., and Monaco G., Phys. Rev. B 85, 224510 (2012). 10.1103/PhysRevB.85.224510 [DOI] [Google Scholar]
- 57.Messinger J., Robblee J. H., Bergmann U., Fernandez C., Glatzel P., Visser H., Cinco R. M., McFarlane K. L., Bellacchio E., Pizarro S. A., Cramer S. P., Sauer K., Klein M. P., and Yachandra V. K., J. Am. Chem. Soc. 123(32), 7804 (2001). 10.1021/ja004307+ [DOI] [PMC free article] [PubMed] [Google Scholar]
- 58.Perera R. C. C. and LaVilla R. E., J. Chem. Phys. 81, 3375 (1984). 10.1063/1.448087 [DOI] [Google Scholar]
- 59.Miyano K. E., Arp U., Southworth S. H., Meehan T. E., Walsh T. R., and Larkins F. P., Phys. Rev. A 57, 2430 (1998). 10.1103/PhysRevA.57.2430 [DOI] [Google Scholar]
- 60.Bergmann U., Bendix J., Glatzel P., Gray H. B., and Cramer S. P., J. Chem. Phys. 116, 2011 (2002). 10.1063/1.1419062 [DOI] [Google Scholar]
- 61.Delgado-Jaime M. U., Dible B. R., Chiang K. P., Brennessel W. W., Bergmann U., Holland P. L., and DeBeer S., Inorg. Chem. 50(21), 10709 (2011). 10.1021/ic201173j [DOI] [PMC free article] [PubMed] [Google Scholar]
- 62.Lee N., Petrenko T., Bergmann U., Neese F., and DeBeer S., J. Am. Chem. Soc. 132(28), 9715 (2010). 10.1021/ja101281e [DOI] [PubMed] [Google Scholar]
- 63.Safonov V. A., Vykhodtseva L. N., Polukarov Y. M., Safonova O. V., Smolentsev G., Sikora M., Eeckhout S. G., and Glatzel P., J. Phys. Chem. B 110(46), 23192 (2006). 10.1021/jp064569j [DOI] [PubMed] [Google Scholar]
- 64.Beckwith M. A., Roemelt M., Collomb M.-N., DuBoc C., Weng T.-C., Bergmann U., Glatzel P., Neese F., and DeBeer S., Inorg. Chem. 50, 8397 (2011). 10.1021/ic200970t [DOI] [PubMed] [Google Scholar]
- 65.Lancaster K. M., Hu Y., Bergmann U., Ribbe M. W., and DeBeer S., J. Am. Chem. Soc. 135, 610 (2013). 10.1021/ja309254g [DOI] [PMC free article] [PubMed] [Google Scholar]
- 66.Heijboer W. M., Glatzel P., Sawant K. R., Lobo R. F., Bergmann U., Barrea R. A., Koningsberger D. C., Weckhuysen B. M., and de Groot F. M. F., J. Phys. Chem. B 108, 10002 (2004). 10.1021/jp048368w [DOI] [Google Scholar]
- 67.Glatzel P., Weng T.-C., Kvashnina K., Swarbrick J., Sikora M., Gallo E., Smolentsev N., and Alonso Mori R., “Reflections on hard X-ray photon-in/photon-out spectroscopy for electronic structure studies,” J. Electron Spectrosc. Relat. Phenom. (in press). 10.1016/j.elspec.2012.09.004 [DOI]
- 68.Glatzel P., Sikora M., Smolentsev G., and Fernández-García M., Catal. Today 145, 294 (2009). 10.1016/j.cattod.2008.10.049 [DOI] [Google Scholar]
- 69.Safonova O. V., Tromp M., van Bokhoven J. A., de Groot F. M. F., Evans J., and Glatzel P., J. Phys. Chem. B 110(33), 16162 (2006). 10.1021/jp063416t [DOI] [PubMed] [Google Scholar]
- 70.de Groot F. M. F., Krisch M. H., and Vogel J., Phys. Rev. B 66, 195112 (2002). 10.1103/PhysRevB.66.195112 [DOI] [Google Scholar]
- 71.Huotari S., Albergamo F., Vanko G., Verbeni R., and Monaco G., Rev. Sci. Instrum. 77, 053102 (2006). 10.1063/1.2198805 [DOI] [Google Scholar]
- 72.Gog T., Casa D. M., Said A. H., Upton M. H., Kim J., Kuzmenko I., Huang X., and Khachatryan R., J. Synchrotron Radiat. 20, 74 (2013). 10.1107/S0909049512043154 [DOI] [PMC free article] [PubMed] [Google Scholar]
- 73.Friebel D., Miller D. J., Nordlund D., Ogasawara H., and Nilsson A., Angew. Chem., Int. Ed. 123(43), 10372 (2011). 10.1002/ange.201101620 [DOI] [PubMed] [Google Scholar]
- 74.Booth C. H., Jiang Y., Wang D. L., Mitchell J. N., Tobash P. H., Bauer E. D., Wall M. A., Allen P. G., Sokaras D., Weng T.-C., Nordlund D., Torrez M. A., and Sarra J., Proc. Natl. Acad. Sci. U.S.A. 109(26), 10205 (2012). 10.1073/pnas.1200725109 [DOI] [PMC free article] [PubMed] [Google Scholar]
- 75.Lin F., Nordlund D., Weng T.-C., Sokaras D., Jones K. M., Reed R. B., Gillaspie D. T., Weir D. G. J., Moore R. G., Dillon A. C., Richards R. M., and Engtrakul C., “Origin of Electrochromism in High-Performing Nanocomposite Nickel Oxide,” ACS Appl. Mater. Interfaces (in press). 10.1021/am400105y [DOI] [PubMed]
- 76. We use the “diced-and-bent” crystal notation here in order to emphasize that every single dice of the crystal analyzer is spherically bent, in contrary to the diced and flat analyzers where each dice is flat lying along a spherically bent substrate.


