

Abstract
Hedgehog signaling drives oncogenesis in several cancers and strategies targeting this pathway have been developed, most notably through inhibition of Smoothened. However, resistance to Smoothened inhibitors occurs via genetic changes of Smoothened or other downstream Hedgehog components. Here, we overcome these resistance mechanisms by modulating GLI transcription via inhibition of BET bromodomain proteins. We show the BET bromodomain protein, BRD4, regulates GLI transcription downstream of SMO and SUFU and chromatin immunoprecipitation studies reveal BRD4 directly occupies GLI1 and GLI2 promoters, with a substantial decrease in engagement of these sites upon treatment with JQ1, a small molecule inhibitor targeting BRD4. Globally, genes associated with medulloblastoma-specific GLI1 binding sites are downregulated in response to JQ1 treatment, supporting direct regulation of GLI activity by BRD4. Notably, patient- and GEMM-derived Hedgehog-driven tumors (basal cell carcinoma, medulloblastoma and atypical teratoid/rhabdoid tumor) respond to JQ1 even when harboring genetic lesions rendering them resistant to Smoothened antagonists.
Keywords: Hedgehog, SHH, medulloblastoma, basal cell carcinoma, ATRT, BRD4, BET bromodomain, GLI1, GLI2, epigenetics, JQ1
Introduction
The Hedgehog (Hh) pathway is an evolutionarily conserved signaling axis that directs embryonic patterning through strict temporal and spatial regulation of cell proliferation and differentiation1. Developmental aberrations in Hh signaling result in dysmorphology, such as cyclopism, holoprosencephaly and limb deformity when its output is absent or decreased2, and cancer predisposition as is seen in Nevoid basal cell carcinoma syndrome (Gorlin syndrome)3 when its output is increased or unchecked1,4.
In canonical Hh signaling, several morphogens (SHH, IHH, DHH)5,6 have been identified that bind to the multi-pass cell surface receptor Patched (PTCH1)1. When not bound by Hh ligand, PTCH1 inhibits the G protein-coupled receptor, Smoothened (SMO)7. Once bound by ligand, however, PTCH1 no longer inhibits SMO, allowing SMO to positively regulate mobilization of the otherwise latent zinc-finger transcription factor GLI2, residing in the cilia, to the nucleus where GLI2 transactivates the GLI1 promoter8-10. GLI1 and GLI2 directly transactivate transcription of Hh target genes, several of which are involved in proliferation, such as MYCN and CCND111. GLI1 also serves to amplify the output of Hh signaling in a positive feedback loop by activating transcription of GLI2, albeit indirectly12. Ultimately, the transcriptional programs mediated by Hh signaling orchestrate an array of events based on cellular, temporal and spatial context, with perhaps the most phenotypically consequential being an increase in cell proliferation.
Inappropriate activation of Hh signaling results in tumor formation in several tissue lineages, including skin, brain, muscle, breast and pancreas13-15. The tumors most commonly associated with aberrant Hh signaling are basal cell carcinoma (BCC) and medulloblastoma, given their prevalence in individuals with germline mutations in PTCH1 (Gorlin syndrome)3,4. However, the overwhelming majority of Hh-driven BCCs and medulloblastomas activate Hh signaling through sporadic somatic mutations in PTCH1 or others components of the Hh pathway14,16,17. These include activating mutations in SMO or inactivating mutations in SUPPRESSOR OF FUSED (SUFU), which negatively regulates Hh output downstream of SMO17,18. Genomic amplification of GLI2, and more rarely GLI1, has also been reported and is associated with a more aggressive clinical course16,19-21. In addition, non-canonical activation of the Hh pathway can occur through loss of SMARCB1, a component of the SWI/SNF chromatin remodeling complex, which results in de-repression of transcriptional activity at the GLI1 locus in malignant rhabdoid tumors22. Similarly, the EWS/FLI fusion oncogene responsible for Ewing sarcoma has been show to directly transactivate the GLI1 promoter23.
The identification of SMO as the main pharmacological target of cyclopamine24, a natural compound found in wild corn lily (Veratrum californicum)2, fostered the development of clinically optimized compounds with potent activity against SMO25-27. Some of these compounds have shown clinical efficacy against basal cell carcinoma, medulloblastoma and other cancers28-30. However, emergence of resistance and a priori resistance have been encountered25,29,31, prompting investigations into alternate strategies targeting novel sites on SMO and Hh pathway components downstream of SMO32,33 or signaling pathways that cooperate with Hh activation in development and disease34,25,35. High-throughput screens have also identified novel scaffolds that regulate GLI processing and its translocation to/from the cilia and nucleus36. However, the effectiveness of these strategies against Hh-driven cancers with MYCN-amplification is unclear as N-MYC appears to be epistatic to the targets of many of these drugs.
A novel class of drugs targeting bromo and extra C-terminal (BET) bromodomain proteins (BRD2-4, BRDT) has been recently described37. Bromodomains recognize and bind to ε-N-lysine acetylation motifs on open chromatin, such as those found on K27 residues of H3 histone N-terminal tails38,39. The BET proteins also interact with the positive transcription elongation factor (P-TEFb)40,41 and phosphorylate serine2 of RNA polymerase II, facilitating gene transcription at “super-enhancer” sites across the genome42,43. BRD-containing complexes that bind at these super-enhancers often localize to promoter regions of key transcription factors such as MYC, and disruption of these complexes by BET inhibitors have produced significant responses in mice bearing xenografts of treatment-refractory cancers driven by MYC and other previously ‘”untargetable” oncogenes, with limited or no toxicity to normal tissues44-47.
Here, we hypothesized that BET inhibitors provide a rational strategy for treating Hh-driven tumors, including those resistant to SMO antagonists. We provide evidence that BRD4 is a critical regulator of GLI1 and GLI2 transcription through direct occupancy of their promoters. Furthermore, we show that occupancy of GLI1 and GLI2 promoters by BRD4 and transcriptional activation at cancer-specific GLI promoter-binding sites are markedly inhibited by the BET inhibitor, JQ1. In GEMM and patient-derived tumors with constitutive Hh pathway activation, JQ1 effectively decreases tumor cell proliferation and viability in vitro and in vivo, even when genetic lesions conferring resistance to SMO inhibitors (SMO inhibitors) are present. Remarkably, the inhibition of cell proliferation by JQ1 can be rescued by plasmid-driven expression of GLI2, which is not under direct transcriptional regulation by BET proteins. In sum, our study identifies BET proteins as novel epigenetic regulators of Hedgehog transcriptional output, and establishes rationale for the use of BET inhibitors in cancers with evidence of Hh pathway activation.
Results
BRD4 is required for ligand-induced Hedgehog transcriptional output
The BET protein BRD4 enhances transcription of key genes involved in embryonic stem cell maintenance42 and oncogenesis43. Therefore, we hypothesized BRD4 is a transcriptional co-factor for Hh-responsive genes. In the mouse 3T3 cell-based Hh-Light2 reporter line containing a stably integrated Gli-luciferase reporter construct48, ligand-induced activation of Hh-Light2 cells with either Shh-N conditioned medium (CM)49 or Smoothened agonist (SAG)48 resulted in an expected increase in Gli1-luciferase activity and Gli1 mRNA levels, which were both potently inhibited by increasing doses of the BET inhibitor, JQ1(Fig.1a;SuppFig.1). Upregulation of other Hh target genes such as Ptch1 and Gli2 was also inhibited by JQ1(Fig.1b). In contrast, Smo was modestly influenced while Sufu and Brd4 were not significantly altered by JQ1(Fig.1b). Notably, the inhibition of Gli1 by JQ1 equaled that of SMO inhibitors (GDC-0449, LDE225 or SANT-1)(Fig.1c,d). Additionally, shRNA-mediated knockdown of Brd4 in Hh-Light2 cells followed by Shh-N CM or SAG stimulation resulted in significant downregulation of ligand-induced Gli-luciferase activity and Hh target gene expression, directly supporting an essential role of Brd4 in Hh signaling(Fig.1e,f).
Figure 1.
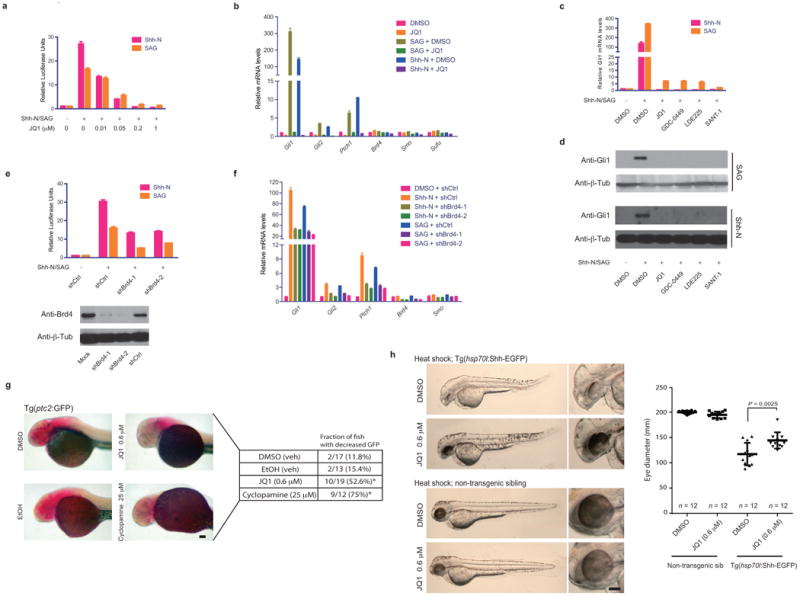
BRD4 is necessary for GLI transcription. (a) Gli-luciferase reporter activity in Hh-Light2 cells treated with Hh ligand (Shh-N CM or SAG) alone or in combination with increasing amount of JQ1. Data represent mean of triplicates ± SD. (b) Quantitative RT-PCR of Hh target genes (Gli1, Gli2, Ptch1), Hh pathway components (Sufu, Smo) and Brd4 in Hh-Light2 cells treated with Hh ligand (Shh-N CM or SAG) alone or in combination with JQ1 (1uM). Data represent mean of triplicates ± SD. (c) Quantitative RT-PCR of Gli1 mRNA in Hh-Light2 cells treated with Hh ligand (Shh-N CM or SAG) alone or in combination with 1uM of JQ1, GDC-0449, LDE225 or SANT-1. Data represent mean of triplicates ± SD. (d) Immunoblot detecting Gli1 expression in cell lysates from Hh-Light2 cells treated with Hh ligand (Shh-N CM or SAG) alone or in combination with 1uM of JQ1, GDC-0449, LDE225 or SANT-1. Anti-β-tubulin immunoblot shown as loading control. (e) Gli-luciferase reporter activity in Hh-Light2 cells treated with Hh ligand (Shh-N CM or SAG) in combination with shRNAs against Brd4 (shBrd4s) or scrambled shRNA (shCtrl). Data represent mean of quadruplicates ± SD. (f) Quantitative RT-PCR of Hh target genes (Gli1, Gli2, Ptch1), Hh pathway components (Sufu, Smo) and Brd4 upon treatment with Hh ligand (Shh-N CM or SAG) alone or in combination with shBrd4s or shCtrl. Data represent mean of triplicates ± SD. (g) In situ hybridization detecting GFP mRNA levels in transgenic zebrafish (ptc2:GFP) treated with JQ1 (0.6uM), cyclopamine (25uM) or vehicle controls (DMSO or EtOH). The fraction with decreased GFP expression was presented. Fisher's exact test was used for statistical analysis. *p<0.05, scale bar = 100 micron. (h) Images of heat-shocked +Tg(hsp70l:Shha-EGFP) or non-transgenic sibling treated with JQ1 (0.6uM) or DMSO. Eye diameter of each group (n=12) was measured and presented. Data represent group means ± SD, p-value generated using student's t-test. Scale bar = 100 micron.
To further assess inhibition of Hh transcriptional output by JQ1, we utilized zebrafish harboring a ptc2:GFP reporter transgene, a well-described canonical Hh pathway reporter in zebrafish50,51. Embryos exposed to JQ1 from 2-30hpf, showed decreased expression of GFP mRNAs similar to cyclopamine-exposed fish(Fig.1g). We also assessed whether JQ1 could revert abnormal phenotypes caused by aberrant Hh signaling in a temperature-sensitive transgenic fish line harboring an hsp70l:Shha-EGFP transgene51, which overexpresses Shh and produces a reliable and well-described dysgenic eye phenotype that often includes a ventral coloboma52,53. As predicted, heat-shocked transgenic fish treated with vehicle alone (DMSO) developed abnormally shaped eyes with diminished diameter relative to their heat-shocked non-transgenic sibs(Fig.1h). However, fish exposed to JQ1 immediately after heat shock, trended towards more normal appearing eyes with statistically significant increases in eye diameter, suggesting BET inhibition countered the effects of aberrant Hh signaling in vivo(Fig.1h).
BRD4 regulates Hh signaling at the level of Gli1 and Gli2 promoters
We next examined JQ1's effects on Hh signaling in Sufu−/− mouse embryonic fibroblasts (MEF)54 and Hh-Light2 cells overexpressing GLI2. SUFU positively regulates the degradation of GLI proteins54, thus loss of SUFU activity results in stabilization of GLI and constitutive Hh signaling downstream of SMO. As expected, we observed markedly increased Gli1 mRNA and protein levels in Sufu−/− MEFs, which were substantially downregulated by JQ1(Fig.2a,c;SuppFig.2a,b). Decreased Gli2 transcription, as well as Smo to a lesser extent, was also noted after JQ1 treatment while Brd4 mRNA levels remained unchanged(Fig.2a). In stark contrast to JQ1 treatment, little to no effect was observed in Gli transcripts or Gli1 protein in Sufu−/− MEFs after treatment with the SMO inhibitors (LDE225, GDC-0449 or SANT-1)(Fig.2b,c). Consistent with pharmacological inhibition of Brd4, shRNA-mediated knockdown of Brd4 resulted in decreased Gli1 and Gli2 mRNA levels(Fig.2d). It is worth noting that Brd4 knockdown did not abrogate GLI-luciferase activity or Gli expression as effectively as JQ1 treatment. This could be explained by incomplete knockdown of Brd4, or suggests other BET proteins (all targets of JQ1) may also contribute to the transcriptional regulation of Gli genes. Indeed, knockdown of either Brd2 or Brd3 resulted in significant decrease of Gli mRNAs in Sufu−/− MEFs(SuppFig.2c).
Figure 2.
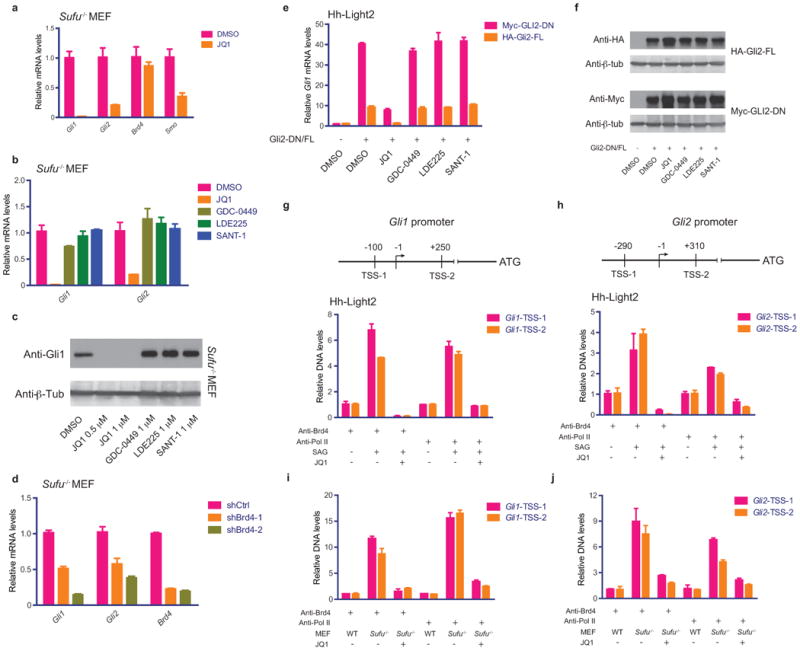
JQ1 inhibits Hh target gene activation at the level of the GLI1 and GLI2 promoters. (a) Quantitative RT-PCR showing Gli1, Gli2, Smo and Brd4 mRNA levels in Sufu−/− MEFs treated with JQ1. Data represent mean of triplicates ± SD. (b) Gli1/Gli2 mRNA levels in Sufu−/− MEFs treated with DMSO, JQ1, GDC-0449, LDE225 or SANT-1. Data represent mean of triplicates ± SD. (c) Immunoblot detecting GLI1 expression in cell lysates from Sufu−/− MEFs treated with DMSO, JQ1, GDC-0449, LDE225 or SANT-1. Anti-β-tubulin immunoblot shown as loading control. (d) Quantitative RT-PCR showing Gli1, Gli2 and Brd4 mRNA levels in Sufu−/− cells expressing shBrd4s or shCtrl. Data represent mean of triplicates ± SD. (e) Quantitative RT-PCR showing Gli1 mRNA levels in Hh-Light2 cells transiently transfected with full length Gli2 (HA-Gli2-FL) or N-terminally truncated GLI2 (Myc-GLI2-DN) and their responses to JQ1, GDC-0449, LDE225 or SANT-1. Data represent mean of triplicates ± SD. (f) Anti-HA and anti-Myc immunoblots on cell lysates from Hh-Light2 cells transfected with HA-Gli2-FL or Myc-GLI2-DN and treated with DMSO, JQ1, GDC-0449, LDE225 or SANT-1. Anti-β-tubulin immunoblot shown as loading control. Schematic of regions flanking the Gli1 and Gli2 promoter transcription start sites analyzed by ChIP-qPCR of Brd4 and PolII occupancies in Hh-Light2 cells treated with SAG and JQ1 (g,h) and in Sufu−/− MEFs treated with JQ1 (i,j). Data represent mean of triplicates ± SD. Except where indicated, cells were treated with 1 uM of JQ1, GDC-0449, LDE225 or SANT-1.
In Hh-Light2 cells, forced expression of full length murine Gli2 (HA-Gli2-FL) or an N-terminally truncated active form of human GLI2 (Myc-GLI2-DN)55 resulted in increased Gli1 mRNA level, which was inhibited by JQ1 but not by SMO inhibitors (GDC-0449, LDE225 or SANT-1)(Fig.2e). Notably, we did not observe any decrease in ectopic GLI2 expression driven off the CMV promoter-expression construct after JQ1 treatment in contrast to the marked decrease in endogenous Gli transcripts(Fig.2f;Fig.1b). Additionally, upregulation of Ptch1, another Hh target gene, was not inhibited by JQ1, suggesting not all Hh target genes are directly dependent on Brd4 as Gli genes themselves are(SuppFig.2d).
In Sufu−/− cells, JQ1 decreased Gli1 and Gli2 levels as early as 3h post-treatment, supporting a role for Brd4 as a transcriptional cofactor that directly regulates transactivation of Gli promoters(SuppFig.2e). Chromatin immunoprecipitation followed by quantitative PCR (ChIP-qPCR) using anti-Brd4 antibody of regions flanking the transcription start sites of Gli1 and Gli2 promoters confirmed increased Brd4 occupancy at both Gli promoters after SAG-mediated activation of Hh signaling in Hh-Light2 cells(Fig.2g,h). Accordingly, ChIP-qPCR with anti-PolII antibody showed engagement of both Gli promoters by PolII after SAG stimulation. Notably, both Brd4 and PolII interactions at the Gli promoters were blocked by the addition of JQ1(Fig.2g,h). Similarly, in Sufu−/− MEFs we documented increased baseline occupancy of Gli promoters by Brd4 and PolII relative to wild type (WT) MEFs, which were again markedly inhibited by JQ1(Fig.2i,j).
JQ1 inhibits Hh activity in Ptch-deficient medulloblastoma and basal cell carcinoma
We investigated the efficacy of JQ1 in Hh-driven tumors, utilizing cell lines derived from autochthonous medulloblastomas (SmoWT-MB and Med1-MB) arising in Ptch+/−;Tpr53−/− and Ptch+/−;lacZ mice, respectively32,56, and basal cell carcinoma (ASZ001)57, also derived from Ptch+/− mice. JQ1 treatment resulted in marked downregulation of Gli mRNA and protein expression with only little to no effect on Smo, Sufu or Brd4(Fig.3a-d;SuppFig.3a). Again, a rapid decrease of Gli genes followed JQ1 treatment (as early as 3h), supporting a direct effect of BET inhibition on Gli promoters(SuppFig.3b). Accordingly, ChIP-qPCR using anti-Brd4 and anti-PolII antibodies showed potent inhibition of Brd4 and PolII occupancy at Gli promoters in all cell lines upon exposure to JQ1(SuppFig.3c,d).
Figure 3.
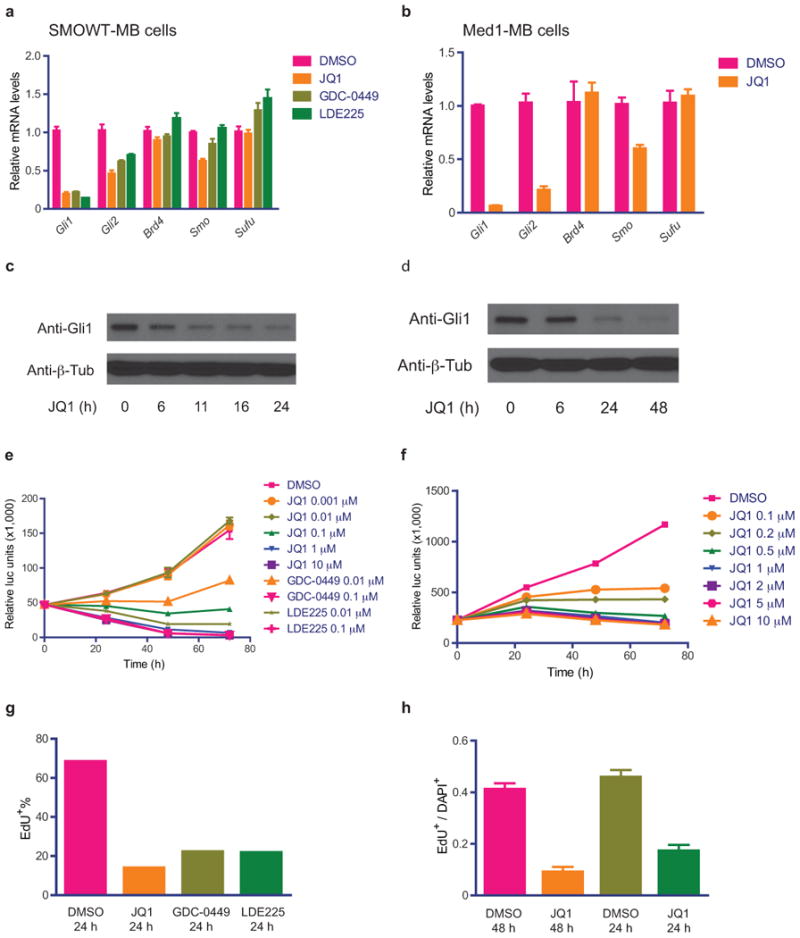
JQ1 inhibits Hh pathway activity and cell viability and proliferation in Ptch-mutated medulloblastoma (MB, SmoWT-MB and Med1-MB) cells. (a,b) Quantitative RT-PCR of expressions of Hh pathway target genes (Gli1, Gli2), components (Smo and Sufu) and Brd4 in SmoWT-MB and Med1-MB cells treated with JQ1 (1 uM), GDC-0449 (0.1uM) or LDE225 (0.1uM). Data represent mean of triplicates ± SD. (c,d) Immunoblot detecing Gli1 expression in response to JQ1 treatment over time. Anti-β-tubulin immunoblot shown as loading control. (e,f) Cell viability detection over time with increasing doses of JQ1 or SMO inhibitors. Data represent group means ± SD. (g,h) Proliferative index in response to JQ1 (1 uM) or SMO inhibitors (GDC-0449 or LDE225 at 0.1uM) as measured by EdU incorporation. Data represent group means ± SD.
In Med1-MB and SmoWT-MB cells, JQ1 treatment resulted in dose-responsive decreases in cell viability and to a much greater extent than in Hh-Light2 or Sufu−/− MEFs(SuppFig.4a). Potent growth inhibition was achieved (IC50∼50-150nM;SuppFig.4b,c) with marked decreases of proliferation(Fig.3e,f), induction of apoptosis(SuppFig.4d,e), and in Med1-MB cells an increased fraction of cells in G1 and decreased fraction of cells transitioning through S phase(SuppFig.4f). Notably, in SmoWT-MB cells, the inhibitory effects of JQ1 on Gli expression, cell viability and proliferation were equivalent to that of SMO inhibitors (GDC-0449 or LDE225)(Fig.3a,e,g;SuppFigs.3a,4d), and moreover, these effects were enhanced when cells were exposed to both JQ1 and GDC-0449 in combination(SuppFig.4g).
JQ1 downregulates cancer-specific Gli1 targets in medulloblastoma
To assess shifts in global gene expression upon JQ1 treatment in Hh-driven medulloblastoma, we generated gene expression microarray data from JQ1-treated SmoWT-MB cells and DMSO- and GDC0449-treated cells as a comparison. We observed a substantial overlap between significantly differentially expressed genes(p<0.0001) or gene sets(p<0.0001) by JQ1 and GDC0449 in both cell lines, including anticipated GLI target genes, Gli2, Ptch1, CCND1,2, Hhip and Cdk6(SuppFig.5a-c). We next compared JQ1 gene expression profiles with gene sets derived from previously published ChIP-chip studies, which indexed gene promoters with Gli1-binding sites in normal granule neuron precursor cells (GNP) and Ptch+/− medulloblastoma cells58. Specifically, we analyzed for enrichment of ChIP-chip peaks associated with GNPs, medulloblastoma, the overlap of both, and peaks associated with GNPs alone or medulloblastoma alone(SuppTableS1). Gene sets enrichment analysis (GSEA) revealed only genes with Gli1-promoter-binding sites associated with medulloblastoma were significantly enriched in JQ1-treated cells(SuppFig.5d). These results confirm the disruption of Gli1-mediated transcription by JQ1 and the preferential targeting of cancer-specific Gli1 transcriptional activity in tumor cells43.
Brd4 knockdown decreases Hh signaling and proliferation, while ectopic GLI2 expression rescues growth inhibition by JQ1
We tested whether knockdown of Brd4 could phenocopy the effects of JQ1 in Hh-driven medulloblastoma cells. As expected, knockdown of Brd4 resulted in decreased Gli expression(Fig.4a,b) and cell proliferation(Fig.4c,d), suggesting the inhibitory effect of JQ1 was through targeting of Brd4. Furthermore, to directly assess whether BET inhibition blocked cell proliferation in Hh-driven tumor cells through targeting of Gli transcription, we utilized plasmid-based expression of GLI2 (Myc-GLI2-DN;see Fig.2f) in SmoWT-MB cells and monitored its ability to rescue the inhibition of proliferation by JQ1(Fig.4c). Remarkably, ectopic expression of GLI2 negated the effects of JQ1 on EdU incorporation and normalized levels to nearly the equivalent of DMSO-treated control. This indicated that JQ1 inhibition of proliferation is mediated largely through inhibition of Gli transcription and, intriguingly, that Brd4-independent transcriptional targets of Gli transcription factors are sufficient to overcome BET inhibition(Fig.4e).
Figure 4.
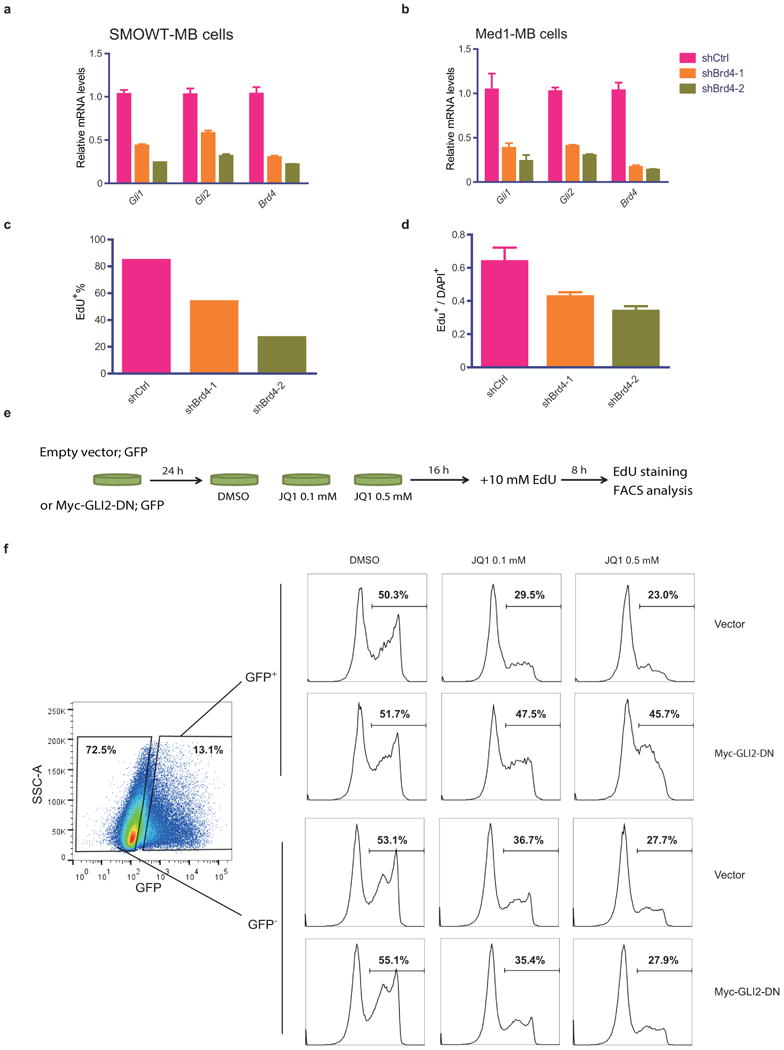
On-target validation of JQ1's inhibitory effects in Hh-driven tumor cells. Quantitative RT-PCR of Gli1, Gli2 and Brd4 mRNAs (a,b) and proliferative index determined by EdU incorporation (c,d) in shBrd4s or shCtrl expressing medulloblastoma tumor cells (SmoWT-MB and Med1-MB). Data represent group means ± SD. (e) The schematic workflow of the GLI2-overexpressing resuce experiment in SmoWT-MB cells. (f) FACS analysis of EdU incorporation in SmoWT-MB cells transfected with empty vector or Myc-GLI2-DN followed by JQ1 treatment (0.1uM or 0.5uM). GFP-expressing plasmid was used for co-transfection to mark the transfected (GFP+) cells.
SMOi-resistant Hh-driven tumors are susceptible to BET inhibition
Given the documented mechanisms of resistance to current, clinically available SMO inhibitors25,31 and the potential for BET inhibitors as a strategy to overcome this resistance, we examined the efficacy of JQ1 in Hh-driven cancers with either acquired or a priori resistance to SMO inhibitors(Fig.5a). We analyzed efficacy of JQ1 and SMO inhibitors (GDC-0449 and LDE225) against medulloblastoma cells carrying an aspartate to glycine substitution at amino acid residue 477 in Smo that results in decreased sensitivity to SMO antagonists (SmoD477G-MB)(Fig.5b)32; patient-derived SUFU-mutated primary SHH subtype medulloblastoma cells (RCMB025); patient-derived primary ATRT cells (CHB_ATRT1, SU_ATRT2) with de-repression of GLI1 transcription via loss of SNF5/SMARCB1/INI122; and patient-derived MYCN-amplified primary SHH subtype medulloblastoma cells (RCMB018). Cell viability(Fig.5b–f,top panels), Gli/GLI levels(Fig.5b-f,bottom panels) and EdU incorporation(SuppFig.6a-c) were markedly decreased in response to JQ1, while little or no effect was observed with SMO inhibitors GDC-0449 or LDE225. Additionally, Myc/MYC and Mycn/MYCN expression were examined in SmoWT-MB, SmoD477G-MB, RCMB025, CHB_ATRT1 and RCMB018 with Mycn/MYCN consistently inhibited by JQ1(Fig.5f, SuppFig.4h;SuppFig.6d–f), suggesting JQ1 targets at least two significant driver oncogenes (GLI and N-MYC) in these tumors.
Figure 5.

JQ1 inhibits Hh pathway activity and cell viability and proliferation in SMOi-resistant Hh-driven tumors. (a) Schematic depicting mechanisms of resistance to Smoothened antagonists in Hh-driven cancers. Cell viability in (b) SMOi-resistant medulloblastoma cells (SmoD477G-MB), (c) patient-derived SUFU mutant medulloblastoma cells (RCMB025), (d,e) patient-derived ATRT cells (CHB_ATRT1 and SU_ATRT2) and (f) patient-derived MYCN-amplified medulloblastoma cells (RCMB018) treated with increasing doses of JQ1, GDC-0449 or LDE225. Data represent group means ± SD. Quantitative RT-PCR of Gli1/GLI1, Gli2/GLI2 and Brd4/BRD4 (plus MYC and MYCN levels for RCMB018) in SmoD477G-MB (g), RCMB025 (h), CHB_ATRT1 (i), SU_ATRT2 (j) and RCMB018 (k) cells in response to JQ1 (1 uM), GDC-0449 or LDE225 (0.1uM for SmoD477G-MB and 1 uM for the others). Data represent mean of triplicates ± SD.
In vivo inhibition of Hh-driven tumors by JQ1
To support a therapeutic role for BET inhibition in Hh-driven tumors, we assessed the in vivo efficacy of JQ1 against medulloblastomas and BCCs. We treated flank and intracranial allografts of Med1-MB cells stably expressing a firefly luciferase reporter in NSG mice with either JQ1(50mg/kg/d,IP) or vehicle control. We observed a significant reduction in flank tumor growth in JQ1-treated mice, as well as an increase in overall survival in JQ1-treated mice harboring intracranial allografts(Fig.6a,b and SuppFig.7a). Additionally, medulloblastoma flank allografts with SmoWT-MB or SmoD477G-MB cells were treated with vehicle control, JQ1(50mg/kg/d,IP) or GDC-0449(100mg/kg/d,PO). We observed dramatic decreases in growth of SmoD477G-MB flank allografts in response to JQ1 but not to GDC-0449, whereas SmoWT-MB flank allografts responded briskly to both GDC-0449 and JQ1(Fig.6c,d). To evaluate JQ1's efficacy against BCCs in vivo, we used an allograft model of Ptch+/−;K14-creER2;p53flox/flox-derived mBCC cells34. JQ1 treatment(50mg/kg/d,IP) resulted in significant growth inhibition of BCCs, but was not as effective as the clinically-optimized SMO inhibitor, BMS-83329334(Fig.6e). Nonetheless, in all Hh-driven tumor models tested, we observed reduction of Gli mRNA, regardless of whether allografts were SMOi-sensitive or SMOi-resistant(SuppFig.7b–f). Together, these results demonstrate in vivo efficacy of JQ1 against Hh-driven tumors, even those with acquired and a priori resistance to clinically available SMO inhibitors.
Figure 6.

JQ1 inhibits Hh-driven tumor growth in vivo. Med1-MB cells transduced with a lentiviral luciferase reporter were used for flank (a) or cerebellum (b) injections of NSG mice, which were then randomized for treatment with either JQ1 (50mg/kg daily, IP) or vehicle. (a) Tumor growth of Med1-MB allografts was assessed by IVIS imaging and presented as average radiance. (b) Survival curve of the cerebellum injected mice with Med1-MB cells. (c) SmoWT-MB and (d) SmoD477G-MB cells were injected into the flanks of NSG mice (both flanks of each mouse), followed by treatment with JQ1[50 mg/kg IP qd], GDC-0449 [100 mg/kg PO qd] or vehicle. Tumor growth was assessed by caliper measurement. (e) SMOi-naïve mouse BCC tumors generated under the dermis of NSG mice were treated with JQ1 (50 mg/kg daily, IP), BMS-833293 [100 mg/kg daily, IP] or vehicle. Tumor growth was assessed by caliper measurement. Data of tumor growth represent group means ± S.E.M. Two-way ANOVA test was used for comparing tumor growth curves. Log-rank test was used for comparing survival curves.
Discussion
We have shown BRD4 and other BET proteins are critical regulators of GLI1 and GLI2 transcription and that BET inhibition provides a novel therapeutic strategy against Hh-driven tumors. Importantly, since BET proteins regulate the far downstream transcriptional output of Hh signaling, BET inhibition was effective against tumor cells that evade Smoothened antagonists through mutation of SMO or amplification of nodes downstream of SMO(Fig.5). Our study is clinically relevant for patients who have a priori resistance to SMO inhibitors and to cases where emergence of resistance develops after initial response to such therapy. By acting directly on the GLI1 and GLI2 promoters, BET inhibition circumvents all SMOi resistance mechanisms that have been reported to date, which include mutations of SMO or SUFU or amplifications in GLI2 or MYCN16,17,20,25,31. The response seen in MYCN-amplified SHH medulloblastoma cells (RCMB018;Fig.5f) is similar to the recent study showing efficacy of BET inhibitors in MYCN-amplified neuroblastoma46. We do observe, however, Mycn/MYCN consistently downregulated by JQ1 in all Hh-driven models studied, suggesting it is just as likely that decreased MYCN levels in Hh-driven tumors reflect GLI's role in directly transactivating the MYCN promoter.
Given the importance of Hh signaling in normal development, it will be essential to understand and anticipate potential toxicities of BET inhibitor therapies as they enter into clinical trials. Certainly, developmental anomalies were observed at very high doses of JQ1 in our zebrafish studies (data not shown), consistent with Brd4 heterozygous mice, which display a multitude of defects that overlap with cyclopamine-treated or Hh-deficient mice59,60. Of note, however, Brd4 heterozygous mice develop craniofacial but not overt axial skeletal phenotypes59, unlike cyclopamine-exposed embryos2,60, suggesting lineage specific differences of Hh pathway dependency on Brd4. Our finding that plasmid-driven GLI2 expression can rescue the proliferation defect induced by JQ1, supports the existence of GLI-responsive promoters that do not require BRD4 for their transactivation. Importantly, such genes appear individually or collectively sufficient to mediate part, if not all, of the oncogenic phenotype associated with Hh/GLI signaling.
Investigating how BRD4 regulates normal Hh-mediated biological processes and documenting BRD4-related changes that occur during Hh-mediated oncogenic transformation, could potentially elucidate factors essential for tumor development that are independent of normal development. Our analysis of gene expression changes in JQ1-treated medulloblastoma and BCC cells supports observations by Lee et al.58, who identified significant shifts in Gli1 occupancy across the genome in medulloblastoma compared to GNPs(SuppFig.5d). An unbiased characterization of Brd4 binding across the genome in GNPs and medulloblastomas will clarify whether Brd4's genomic footprint overlaps with Gli occupancy in the oncogenic state relative to the normal developmental state. Related to this point, emerging evidence suggests BET proteins converge on “super-enhancer” sites across the genome and that these super-enhancers help transactivate promoters of key regulators of cellular identity in normal and pathogenic contexts42,43. Whether GLI transactivates super-enhancer-related promoters and, accordingly, whether super-enhancers are positioned over GLI promoters, is currently under active investigation.
Materials and Methods
Ethics statement
All studies were performed under approval and oversight by IRB committees of Stanford University, Boston Children's Hospital and Rady Children's Hospital/Sanford-Burnham Medical Research Institute.
Cell lines and drug reagents
Mouse BCC (ASZ001 and mBCC-SMOR3), 293T and Hh-Light2 cells were derived and maintained as previously described24,34,57. RCMB025 and RCMB018 cells were derived from primary surgical resections of two medulloblastoma cases at Rady Children's Hospital and were further characterized by whole-genome sequencing as having a SUFU mutation and MYCN amplification, respectively (Kool et al. Cancer Cell 2014, In press). CHB_ATRT1 cells were derived from tumor obtained at the time of primary surgical resection of a posterior fossa atypical teratoid/rhabdoid tumor at Boston Children's Hospital. SU_ATRT2 cells were derived from tumor obtained at the time of surgical resection of an intraventricular atypical teratoid/thabdoid tumor at Lucile Packard Children's Hospital/Stanford University Medical Center. Med1-MB cells, generated from a spontaneous tumor arising in a Ptch+/−;lacZ mouse, were kindly provided by Matthew Scott (Stanford). SmoWT-MB and SmoD477G-MB cells isolated from either parental SmoWT or SmoD477G mouse Ptch+/−; p53−/− MB hind-flank allografts were kindly provided by Charles Rudin (Memorial Sloan-Kettering Cancer Center). Sufu−/− MEFs (conditional deletion of exons 4-854) were kindly provided by Pao-Tien Chang (UCSF). SAG, SANT-1, GDC-0449 (S1082, Vismodegib, HhAntag691) and LDE225 (S2151, NVP-LDE225, Erismodegib) were purchased from SelleckChem.com. Shh-N conditional medium was kindly provided by Philip Beachy (Stanford). JQ1 was synthesized as previously described44.
RNA extraction and RT-qPCR
RNA was extracted using Qiazol Lysis Reagent (79306, Qiagen, Venlo, Netherland) per the manufacturer's instructions. Reverse transcription was performed with 1ug total RNA using the High Capacity cDNA Reverse Transcription Kit (4368813, Invitrogen). Real time qPCR was performed using 2x Maxima SYBR Green qPCR Master Mix (#K0251, Thermo Scientific) on an Eppendorf Mastercycler PCR machine. qPCR primers are listed in Supplemental Table 2.
Cell cycle, proliferation, viability and apoptosis assays
For cell cycle analysis, cells were fixed in 70% ethanol for 30min at 4°C. After two washes with cold PBS, fixed cells were resuspended in staining buffer (200ul PBS+10ul 1mg/ml PI+2ul 100mg/ml RNase A) and incubated at 37°C for 45min. Cells were washed once with cold PBS and filtered through 70uM mesh (ELKO Filtering Co., Maimi, FL, USA). Filtered cells were centrifuged and resuspended in 500ul PBS for FACS analysis. Proliferation assays were performed by culturing cells in the presence of 10uM EdU for 6-8hrs. The EdU+ population was determined using either Click-iT EdU Alexa Fluor 488 Flow Cytometry Assay Kit (C35002, Invitrogen, CA, USA) or Click-iT EdU Alexa Fluor 594 Imaging Kit (C10339, Invitrogen, CA, USA). Cells were counter-stained with DAPI (D8417, Sigma, MO, USA) and the proliferation index calculated as EdU+/DAPI+ cells. Apoptosis was analyzed using BD Pharmingen FITC Annexin V Apoptosis Detection kit I (Cat# 556547, BD Biosciences, CA, USA) per the manufacturer's instructions. Cell viability was assessed using CellTiter-Glo (G7573, Promega, WI, USA) according to the manufacturer's instructions. Cells were plated at 5000 cells/well in 96-well plates, treated with drugs as indicated and data collected on a TECAN Infinite 200 plate reader. The drug synergy between JQ1 and GDC-0449 was calculated by using CalcuSyn software (Biosoft, Cambridge, UK). Combination Index (CI) less than 1 was considered as synergistic. All FACS data were collected on a BD Fortessa analyzer (BD Biosciences, CA, USA) and data analyses performed using Flowjo software (Tree Star, OR, USA).
GLI2 overexpression
Myc-GLI2-DN (17649, pCS2-MT-GLI2-deltaN) plasmid was purchased from Addgene (Cambridge, MA, USA). 3xHA-Gli2-FL plasmid was kindly provided by Philip Beachy (Stanford). Plasmid transfection was performed using Turbofect transfection reagent (#R0531, Thermo Scientific) according to the manufacturer's instructions. Cells were treated with drugs 24hr post-transfection as indicated.
Western blot
Cells were lysed with RIPA buffer (sc-24948, Santa Cruz Biotechnology) for 30min on ice and lysates cleared by centrifugation at 13000rpm, 15min at 4°C. Supernatants were incubated with 4x Lamelli sample buffer (#161-0747, Bio-rad) at 95°C for 5min. The samples were then separated with SDS-PAGE gel and immunoblotted with the indicated antibodies: anti-HA (ab18181, Abcam), anti-c-Myc (sc-789, Santa Cruz Biotechnology), anti-GLI1 (#2643, Cell signaling), anti-β-tubulin (ab6046, Abcam).
Lentiviral infection
shRNA lentiviral constructs against mouse Brd2/Brd3/Brd4 (The RNAi Consortium mouse collection) were kindly provided by Alejandro Sweet-Cordero (Stanford) and shRNA insertion sequences confirmed by Sanger sequencing. To produce shRNA lentivirus, 293T cells were transfected with lentiviral vector and packaging plasmids (pDelta 8.92+VSV-G). Titres were collected 48hr post-transfection and concentrated by PEG precipitation. The precipitated lentivirus was resuspended in PBS and aliquoted for storage at -80°C. For shRNA lentivirus infection, cells were incubated with shRNA lentivirus for 16hr. At 48hrs post-infection, puromycin was added to select virally-infected cells for further experiments.
Dual-luciferase reporter assay
Hh-Light2 cells were cultured until confluent and treated with drug as indicated. Dual-luciferase reporter assays were performed using the Dual-Luciferase Reporter Assay System 10-Pack (E1960, Promega, WI, USA) according to manufacturer's instructions and data collected on a TECAN Infinite 200 plate reader.
ChIP-qPCR
Cells were fixed with 1% formaldehyde for 10min at room temperature before adding Glycine to stop the fixation. The cells were then harvested and snap frozen and stored at -80°C prior to use. For each Chromatin IP experiment, chromatin isolated from 10E6 to 10E7 cells was sonicated and immunoprecipitated with 3-5ug of the indicated antibody and 100ul Dynabeads protein G. Beads were washed five times with RIPA buffer and one time with TE containing 50mM NaCl. Bound complexes were eluted by heating at 65°C with occasional vortexing for 30min, and crosslinking was reversed by overnight incubation at 65°C. INPUT DNA was also treated for crosslink reversal. Immunoprecipitated DNA and INPUT DNA were then purified by RNaseA/proteinase K treatment, phenol:chloroform extraction and ethanol precipitation. qPCR was performed using 2x Maxima SYBR Green qPCR Master Mix (#K0251, Thermo Scientific) on an Eppendorf Mastercycler PCR machine. ChIP-qPCR primer sequences are listed in Supplemental Table 2.
Gene expression microarray analysis
Gene expression data was generated from total RNA derived from biological duplicates of SmoWT-MB cells treated with control (DMSO), JQ1 (1uM) or GDC-0449 (0.1uM) for 6hrs. RNA was hybridized to Illumina MouseWG-6 v2.0 (SmoWT-MB) expression bead arrays per the manufacturer's instructions. Rank-invariant normalized data was generated using GenomeStudio v1.9.0 and converted to .gct file format, which was then collapsed to gene symbols using the GSEA desktop application (http://www.broadinstitute.org/gsea/index.jsp). Differentially expressed genes were visualized using the GENE-E desktop application (http://www.broadinstitute.org/cancer/software/GENE-E/) and the top 5000 differentially expressed genes between drug-treated and control-treated cells were used for agglomerative heierarchical clustering using Pearson correlation and average linkage metric across samples and genes.
Comparative marker selection analysis between JQ1 or GDC-0449 and DMSO treated cells was performed in GenePattern using the default settings. Genes with a p value of less than 0.05 and a q-value value of less than 0.1 were considered to be significantly differentially expressed. We performed Chi-square analysis to determine the significance of overlap between genes that were down-regulated by JQ1 and GDC-0449. To identify gene sets differentially expressed following treatment with JQ1 or GDC-0449 (compared to DMSO controls), Gene set enrichment analysis (GSEA) was performed as previously described61 using the C2cpg gene set (MSigDB). Gene sets with a nominal p-value less than 0.05 and q –value of less than 0.25 were considered significant. We performed Fisher's exact test to determine the significance of overlap between gene sets that were down-regulated by JQ1 and GDC-0449.
GSEA was also performed using gene sets (.gmt files) derived from Puissant et al.46, Atwood et al.34 and Lee et al.58 (Supplemental Table S1). Briefly, genes associated with Gli1 ChIP-chip peaks in normal granule neuron precursor cells and medulloblastoma (listed in Tables S1A and S1B from Lee et al.58) were converted to gene sets (“Lee_Gli1_GNP” and “Lee_Gli1_MB”). We then used the Venn diagram function in GENE-E to generate gene sets of overlapping and distinct genes between these lists (“Lee_Gli1_GNP_only”, “Lee_Gli1_MB_only” and “Lee_Gli1_GNP_MB_overlap”).
In vivo mouse studies
In vivo efficacy studies were performed in accordance with protocols approved by the Institutional Animal Care and Use Committee at Stanford University and Children's Hospital Research Center Oakland. “SMOi-naïve” BCC allografts were derived from BCC tumors generated in Ptch+/−;K14-creER2;p53flox/flox mice as previously described34. Tumors were treated with vehicle control, BMS-833293 (Bristol Myers Squib Hedgehog inhibitor) [100 mg/kg IP qd] or JQ1 [50 mg/kg IP qd], until euthanasia was required when the size of vehicle-treated tumors exceeded the limit in our animal care guidelines. Tumor size was measured with calipers every 3 to 4 days. Tumors were also harvested for RNA analysis. SMOi-resistant mBCCs were generated by treating “SMOi-naïve” BCC allografts with BMS-833293 in a cyclical fashion and then treated with JQ1 as described above. The tumors were treated with JQ1 [50 mg/kg IP qd] or vehicle for 7 days before harvesting for RNA analysis.
For in vivo medulloblastoma studies, SmoWT-MB, SmoD477G-MB and GFP-luc transduced Med1-MB cells were used for flank or cerebellum injections. 2x10e6 cells were injected into the flank of each 4-6 week old NOD.Cg-Prkdcscid Il2rgtm1Wjl/SzJ (NSG) mouse (The Jackson Laboratories). 0.5x10e6 cells were used for cerebellum injection, as previously described32. After engraftments were confirmed, mice were randomized into treatment and control groups and treated with vehicle control, GDC-0449 [100 mg/kg PO qd] or JQ1 [50 mg/kg IP qd], until euthanasia was required. Tumor growth was measured with calipers or monitored by IVIS imaging on a Xenogen IVIS2000 (Perkin-Elmer). At the end of treatment, tumors were harvested in RNAlater for RNA analysis. Survival data was recorded for the cerebellum injected mice using Med1-MB cells.
Zebrafish studies
Zebrafish embryos from an outcross of Tg(GBS-ptch2:EGFP)+/− with TL wild-type were exposed to JQ1 at concentrations ranging from 0.25uM-5uM. A 0.6uM working dose was determined optimal for in vivo studies as it caused no phenotype in contrast to 0.75uM, which caused elevated cell death and dysmorphology. The ptch2:GFP reporter fish were then exposed to JQ1, cyclopamine (25 uM), or vehicle control (DMSO or EtOH, for JQ1 and cyclopamine, respectively) from 2-30 hpf and then fixed with 4% paraformaldehyde for in situ hybridization using a GFP probe and fast red. All fish with GFP positivity were scored for intensity of staining.
For Shh overexpression experiments, embryos from an Tg(hsp70l:shha-EGFP)+/− x TL wild-type were collected and heat shocked (HS) at 38ûC for 15 min at 8 somite stage. Following HS, the embryos were immediately placed in JQ1 at 0.6 um or 6.0 um concentrations. DMSO was used as a negative control. At 12 hpf GFP-positive and negative embryos were sorted and embryos transferred to equivalent concentrations of fresh drug/DMSO. Images were captured using a Nikon Coolpix digital P520 camera fitted to a Lieca MZLIII stereo microscope at 30 and 56 hpf. Embryos were scored for eye size (dorsal axis length) at 56hpf.
Statistical analysis
Two-way ANOVA test was used for comparing tumor growth curves. Log-rank test was used for comparing survival curves. Chi-square test or Fisher's exact test were used for statistical analysis of contingency table data. Student's t-test was used for all the other comparisons.
Supplementary Material
Supplemental Figure 1. Quantitative RT-PCR showing Gli1 mRNA levels in Hh-Light2 cells treated with Hh ligand (Shh-N CM or SAG) alone or in combination with increasing doses of JQ1. Data represent mean of triplicates ± SD.
Supplemental Figure 2. (a)Quantitative RT-PCR of Gli1, Gli2, Brd4 and Smo in wild-type (WT) MEFs and Sufu−/− MEFs. Data represent mean of triplicates ± SD. (b) Quantitative RT-PCR of Gli1 mRNA in Sufu−/− MEFs in response to increasing doses of JQ1. Data represent mean of triplicates ± SD. (c) Quantitative RT-PCR of Gli1, Gli2, Brd2 and Brd3 mRNAs in Sufu−/− MEFs expressing shBrd2s, shBrd3s or shCtrl. Data represent mean of triplicates ± SD. (d) Quantitative RT-PCR showing Ptch1 mRNA levels in Hh-Light2 cells transiently transfected with HA-Gli2-FL or Myc-GLI2-DN and their response to JQ1, GDC-0449, LDE225 or SANT-1. Data represent mean of triplicates ± SD. (e)Quantitative RT-PCR of Gli1 and Gli2 mRNAs showing the time course of decreased Gli1 and Gli2 mRNA levels in response to JQ1 (1 uM). Data represent mean of triplicates ± SD.
Supplemental Figure 3. In SmoWT-MB, Med1-MB and ASZ001 cells, (a) Quantitative RT-PCR of Gli1 mRNA levels in response to increasing doses of JQ1, data represent mean of triplicates ± SD. (b) Quantitative RT-PCR showing time course of Gli1 and Gli2 mRNA levels in response to JQ1 treatment (1 uM) , data represent mean of triplicates ± SD. (c,d) ChIP-qPCR analysis of Brd4 and PolII occupancies on Gli1 and Gli2 promoter regions, data represent mean of triplicates ± SD.
Supplemental Figure 4. (a) Comparison of JQ1 dose-response measuring cell viability in Hh-driven tumor cells (SmoWT-MB and Med1-MB) and normal cells (Hh-Light2 and Sufu−/− MEF). Data represent group means ± SD. JQ1 dose-response curves measuring cell viability from day1 to day3 in SmoWT-MB (b) and Med1-MB (c) cells, data represent group means ± SD. Annexin V/DAPI staining FACS analysis measuring cell apoptosis in response to JQ1 or SMO inhibitors in SmoWT-MB (d) and Med1-MB (e) cells. (f) In Med1-MB cells, PI staining FACS analysis measuring cell cycle distribution in response to JQ1. (g) Combination treatment using increasing doses of JQ1 and GDC-0449 in SmoWT-MB cells to test the drug synergy. Data represent group means ± SD. (h) Quantitative RT-PCR analysis of Myc and Mycn mRNA levels in response to JQ1 (1 uM) or GDC-0449 (0.1 uM) treatment in SmoWT-MB cells. Data represent mean of triplicates ± SD.
Supplemental Figure 5. (a) Hierarchical clustering of samples and differentially regulated genes following 6-hour treatment of SmoWT MB cells with DMSO, JQ1 (1uM), or GDC-0449 (0.1uM). Red indicates increased gene expression and blue reduced gene expression and displayed as row normalized data. Venn diagram and statistical analysis of the overlapping differentially expressed genes (b) or enriched gene sets (c) between JQ1- and GDC-0449-treated SmoWT MB cells. Chi-square test and Fisher's exact test were used for statistical analysis. (d) GSEA analysis of JQ1-treated SmoWT-MB cells using “LEE_GLI1” gene sets.
Supplemental Figure 6. In SmoD477G-MB, RCMB025 and CHB_ATRT1 cells, (a) proliferative index was measured by EdU incorporation in response to JQ1, GDC-0449 or LDE225. (b) Myc/MYC and Mycn/MYCN expressions were measured by qRT-qPCR in response to JQ1 or SMO inhibitors. Data represent group means ± SD.
Supplemental Figure 7. (a) Tumor size of JQ1 or vehicle treated Med1-MB flank allografts at day 21 post treatment. Quantitative RT-PCR of Gli1, Gli2, Brd4 and Smo in Med1-MB (b), SmoWT-MB (c), SmoD477G (d), SMOi-naïve mBCC (e) and SMOi-resistant mBCC (f) allografts after JQ1 treatment. Data represent group means ± S.E.M. Student's t-test was used for statistical analysis. * P < 0.05, ** P < 0.01, *** P < 0.001.
Supplemental Table 1. Gene sets derived from Lee et al., PNAS 2010.
Supplemental Table 2. qPCR primers used in study.
Supplemental Dataset 1. ssGSEA of gene expression data generated from SmoWT MB cells exposed for 6h to DMSO, JQ1 (1uM), or GDC-0449 (0.1uM) using v2.0 CGP gene sets (http://www.broadinstitute.org/gsea/msigdb/index.jsp).
Acknowledgments
This work was supported the St. Baldrick's Foundation Scholar Award (YJC), Beirne Faculty Scholar Endowment (YJC), NIH U01-CA176287 (YJC), Alex's Lemonade Stand Foundation Young Investigator Award (YT), Damon-Runyon Cancer Research Foundation (JQ and JEB), NIH R01-CA159859 (RWR) and a pilot project grant from the Medical College of Wisconsin Cancer Center -Advancing a Healthier Wisconsin (BAL). RWR is the recipient of a Leadership Award (LA1-01747) from the California Institute of Regenerative Medicine.
We thank the Stanford Functional Genomics Facility (SFGF) and Protein and Nucleic Acid (PAN) facility for their assistance in generating gene expression microarray data and reagents. We thank Matthew Scott, Charles Rudin, Phil Beachy, Rolf Karlstrom and James K. Chen for reagents, helpful suggestions and/or critical reading of the manuscript.
Footnotes
YT and YJC conceived the project and wrote the manuscript. YT, BN, SM, BB, NV, SS, SC, AP, SO, FY performed all molecular biology experiments. JQ and JEB synthesized and supplied JQ1 for all studies. AO, SXA, RJW, AL and JYT generated and prepared GEMM-derived BCC cells and RWR generated and provided patient-derived medulloblastoma cells. PB, GB, RB and YJC performed all informatics analyses. SG, AL, YT, SS performed JQ1 in vivo studies.
Conflict of Interest: The Dana-Farber Cancer Institute has licensed drug-like derivatives of JQ1 prepared in the Bradner laboratory to Tensha Therapeutics for clinical translation as cancer therapeutics. Dana-Farber and Dr. Bradner have been provided minority equity shares in Tensha. Dr. Qi has a consultant agreement with Tensha Therapeutics.
References
- 1.Goodrich LV, Johnson RL, Milenkovic L, McMahon JA, Scott MP. Conservation of the hedgehog/patched signaling pathway from flies to mice: induction of a mouse patched gene by Hedgehog. Genes & development. 1996;10:301–312. doi: 10.1101/gad.10.3.301. [DOI] [PubMed] [Google Scholar]
- 2.Binns W, Shupe JL, Keeler RF, James LF. Chronologic evaluation of teratogenicity in sheep fed Veratrum californicum. Journal of the American Veterinary Medical Association. 1965;147:839–842. [PubMed] [Google Scholar]
- 3.Gorlin RJ, Vickers RA, Kellen E, Williamson JJ. Multiple Basal-Cell Nevi Syndrome. An Analysis of a Syndrome Consisting of Multiple Nevoid Basal-Cell Carcinoma, Jaw Cysts, Skeletal Anomalies, Medulloblastoma, and Hyporesponsiveness to Parathormone. Cancer. 1965;18:89–104. doi: 10.1002/1097-0142(196501)18:1<89::aid-cncr2820180114>3.0.co;2-9. [DOI] [PubMed] [Google Scholar]
- 4.Johnson RL, et al. Human homolog of patched, a candidate gene for the basal cell nevus syndrome. Science. 1996;272:1668–1671. doi: 10.1126/science.272.5268.1668. [DOI] [PubMed] [Google Scholar]
- 5.Echelard Y, et al. Sonic hedgehog, a member of a family of putative signaling molecules, is implicated in the regulation of CNS polarity. Cell. 1993;75:1417–1430. doi: 10.1016/0092-8674(93)90627-3. [DOI] [PubMed] [Google Scholar]
- 6.Marigo V, et al. Cloning, expression, and chromosomal location of SHH and IHH: two human homologues of the Drosophila segment polarity gene hedgehog. Genomics. 1995;28:44–51. doi: 10.1006/geno.1995.1104. [DOI] [PubMed] [Google Scholar]
- 7.Alcedo J, Ayzenzon M, Von Ohlen T, Noll M, Hooper JE. The Drosophila smoothened gene encodes a seven-pass membrane protein, a putative receptor for the hedgehog signal. Cell. 1996;86:221–232. doi: 10.1016/s0092-8674(00)80094-x. [DOI] [PubMed] [Google Scholar]
- 8.Huangfu D, Anderson KV. Cilia and Hedgehog responsiveness in the mouse. Proceedings of the National Academy of Sciences of the United States of America. 2005;102:11325–11330. doi: 10.1073/pnas.0505328102. [DOI] [PMC free article] [PubMed] [Google Scholar]
- 9.Haycraft CJ, et al. Gli2 and Gli3 localize to cilia and require the intraflagellar transport protein polaris for processing and function. PLoS genetics. 2005;1:e53. doi: 10.1371/journal.pgen.0010053. [DOI] [PMC free article] [PubMed] [Google Scholar]
- 10.Liu A, Wang B, Niswander LA. Mouse intraflagellar transport proteins regulate both the activator and repressor functions of Gli transcription factors. Development. 2005;132:3103–3111. doi: 10.1242/dev.01894. [DOI] [PubMed] [Google Scholar]
- 11.Oliver TG, et al. Transcriptional profiling of the Sonic hedgehog response: a critical role for N-myc in proliferation of neuronal precursors. Proceedings of the National Academy of Sciences of the United States of America. 2003;100:7331–7336. doi: 10.1073/pnas.0832317100. [DOI] [PMC free article] [PubMed] [Google Scholar]
- 12.Regl G, et al. Human GLI2 and GLI1 are part of a positive feedback mechanism in Basal Cell Carcinoma. Oncogene. 2002;21:5529–5539. doi: 10.1038/sj.onc.1205748. [DOI] [PubMed] [Google Scholar]
- 13.Mao J, et al. A novel somatic mouse model to survey tumorigenic potential applied to the Hedgehog pathway. Cancer research. 2006;66:10171–10178. doi: 10.1158/0008-5472.CAN-06-0657. [DOI] [PMC free article] [PubMed] [Google Scholar]
- 14.Xie J, et al. Mutations of the PATCHED gene in several types of sporadic extracutaneous tumors. Cancer research. 1997;57:2369–2372. [PubMed] [Google Scholar]
- 15.Thayer SP, et al. Hedgehog is an early and late mediator of pancreatic cancer tumorigenesis. Nature. 2003;425:851–856. doi: 10.1038/nature02009. [DOI] [PMC free article] [PubMed] [Google Scholar]
- 16.Cho YJ, et al. Integrative genomic analysis of medulloblastoma identifies a molecular subgroup that drives poor clinical outcome. Journal of clinical oncology : official journal of the American Society of Clinical Oncology. 2011;29:1424–1430. doi: 10.1200/JCO.2010.28.5148. [DOI] [PMC free article] [PubMed] [Google Scholar]
- 17.Pugh TJ, et al. Medulloblastoma exome sequencing uncovers subtype-specific somatic mutations. Nature. 2012;488:106–110. doi: 10.1038/nature11329. [DOI] [PMC free article] [PubMed] [Google Scholar]
- 18.Taylor MD, et al. Mutations in SUFU predispose to medulloblastoma. Nature genetics. 2002;31:306–310. doi: 10.1038/ng916. [DOI] [PubMed] [Google Scholar]
- 19.ten Haaf A, et al. Expression of the glioma-associated oncogene homolog (GLI) 1 in human breast cancer is associated with unfavourable overall survival. BMC cancer. 2009;9:298. doi: 10.1186/1471-2407-9-298. [DOI] [PMC free article] [PubMed] [Google Scholar]
- 20.Northcott PA, et al. Subgroup-specific structural variation across 1,000 medulloblastoma genomes. Nature. 2012;488:49–56. doi: 10.1038/nature11327. [DOI] [PMC free article] [PubMed] [Google Scholar]
- 21.Buczkowicz P, Ma J, Hawkins C. GLI2 is a potential therapeutic target in pediatric medulloblastoma. Journal of neuropathology and experimental neurology. 2011;70:430–437. doi: 10.1097/NEN.0b013e31821b94db. [DOI] [PubMed] [Google Scholar]
- 22.Jagani Z, et al. Loss of the tumor suppressor Snf5 leads to aberrant activation of the Hedgehog-Gli pathway. Nature medicine. 2010;16:1429–1433. doi: 10.1038/nm.2251. [DOI] [PMC free article] [PubMed] [Google Scholar]
- 23.Zwerner JP, et al. The EWS/FLI1 oncogenic transcription factor deregulates GLI1. Oncogene. 2008;27:3282–3291. doi: 10.1038/sj.onc.1210991. [DOI] [PubMed] [Google Scholar]
- 24.Chen JK, Taipale J, Cooper MK, Beachy PA. Inhibition of Hedgehog signaling by direct binding of cyclopamine to Smoothened. Genes & development. 2002;16:2743–2748. doi: 10.1101/gad.1025302. [DOI] [PMC free article] [PubMed] [Google Scholar]
- 25.Buonamici S, et al. Interfering with resistance to smoothened antagonists by inhibition of the PI3K pathway in medulloblastoma. Science translational medicine. 2010;2:51–70. doi: 10.1126/scitranslmed.3001599. [DOI] [PMC free article] [PubMed] [Google Scholar]
- 26.Lee MJ, et al. Hedgehog pathway inhibitor saridegib (IPI-926) increases lifespan in a mouse medulloblastoma model. Proceedings of the National Academy of Sciences of the United States of America. 2012;109:7859–7864. doi: 10.1073/pnas.1114718109. [DOI] [PMC free article] [PubMed] [Google Scholar]
- 27.Zhang Y, Laterra J, Pomper MG. Hedgehog pathway inhibitor HhAntag691 is a potent inhibitor of ABCG2/BCRP and ABCB1/Pgp. Neoplasia. 2009;11:96–101. doi: 10.1593/neo.81264. [DOI] [PMC free article] [PubMed] [Google Scholar]
- 28.LoRusso PM, et al. Phase I trial of hedgehog pathway inhibitor vismodegib (GDC-0449) in patients with refractory, locally advanced or metastatic solid tumors. Clinical cancer research : an official journal of the American Association for Cancer Research. 2011;17:2502–2511. doi: 10.1158/1078-0432.CCR-10-2745. [DOI] [PMC free article] [PubMed] [Google Scholar]
- 29.Rudin CM, et al. Treatment of medulloblastoma with hedgehog pathway inhibitor GDC-0449. The New England journal of medicine. 2009;361:1173–1178. doi: 10.1056/NEJMoa0902903. [DOI] [PMC free article] [PubMed] [Google Scholar]
- 30.Von Hoff DD, et al. Inhibition of the hedgehog pathway in advanced basal-cell carcinoma. The New England journal of medicine. 2009;361:1164–1172. doi: 10.1056/NEJMoa0905360. [DOI] [PubMed] [Google Scholar]
- 31.Yauch RL, et al. Smoothened mutation confers resistance to a Hedgehog pathway inhibitor in medulloblastoma. Science. 2009;326:572–574. doi: 10.1126/science.1179386. [DOI] [PMC free article] [PubMed] [Google Scholar]
- 32.Kim J, et al. Itraconazole and arsenic trioxide inhibit Hedgehog pathway activation and tumor growth associated with acquired resistance to smoothened antagonists. Cancer cell. 2013;23:23–34. doi: 10.1016/j.ccr.2012.11.017. [DOI] [PMC free article] [PubMed] [Google Scholar]
- 33.Kim J, Lee JJ, Gardner D, Beachy PA. Arsenic antagonizes the Hedgehog pathway by preventing ciliary accumulation and reducing stability of the Gli2 transcriptional effector. Proceedings of the National Academy of Sciences of the United States of America. 2010;107:13432–13437. doi: 10.1073/pnas.1006822107. [DOI] [PMC free article] [PubMed] [Google Scholar]
- 34.Atwood SX, Li M, Lee A, Tang JY, Oro AE. GLI activation by atypical protein kinase C iota/lambda regulates the growth of basal cell carcinomas. Nature. 2013;494:484–488. doi: 10.1038/nature11889. [DOI] [PMC free article] [PubMed] [Google Scholar]
- 35.Kenney AM, Widlund HR, Rowitch DH. Hedgehog and PI-3 kinase signaling converge on Nmyc1 to promote cell cycle progression in cerebellar neuronal precursors. Development. 2004;131:217–228. doi: 10.1242/dev.00891. [DOI] [PubMed] [Google Scholar]
- 36.Hyman JM, et al. Small-molecule inhibitors reveal multiple strategies for Hedgehog pathway blockade. Proceedings of the National Academy of Sciences of the United States of America. 2009;106:14132–14137. doi: 10.1073/pnas.0907134106. [DOI] [PMC free article] [PubMed] [Google Scholar]
- 37.Filippakopoulos P, et al. Selective inhibition of BET bromodomains. Nature. 2010;468:1067–1073. doi: 10.1038/nature09504. [DOI] [PMC free article] [PubMed] [Google Scholar]
- 38.Dhalluin C, et al. Structure and ligand of a histone acetyltransferase bromodomain. Nature. 1999;399:491–496. doi: 10.1038/20974. [DOI] [PubMed] [Google Scholar]
- 39.Jacobson RH, Ladurner AG, King DS, Tjian R. Structure and function of a human TAFII250 double bromodomain module. Science. 2000;288:1422–1425. doi: 10.1126/science.288.5470.1422. [DOI] [PubMed] [Google Scholar]
- 40.Jang MK, et al. The bromodomain protein Brd4 is a positive regulatory component of P-TEFb and stimulates RNA polymerase II-dependent transcription. Molecular cell. 2005;19:523–534. doi: 10.1016/j.molcel.2005.06.027. [DOI] [PubMed] [Google Scholar]
- 41.Yang Z, et al. Recruitment of P-TEFb for stimulation of transcriptional elongation by the bromodomain protein Brd4. Molecular cell. 2005;19:535–545. doi: 10.1016/j.molcel.2005.06.029. [DOI] [PubMed] [Google Scholar]
- 42.Whyte WA, et al. Master transcription factors and mediator establish super-enhancers at key cell identity genes. Cell. 2013;153:307–319. doi: 10.1016/j.cell.2013.03.035. [DOI] [PMC free article] [PubMed] [Google Scholar]
- 43.Loven J, et al. Selective inhibition of tumor oncogenes by disruption of super-enhancers. Cell. 2013;153:320–334. doi: 10.1016/j.cell.2013.03.036. [DOI] [PMC free article] [PubMed] [Google Scholar]
- 44.Delmore JE, et al. BET bromodomain inhibition as a therapeutic strategy to target c-Myc. Cell. 2011;146:904–917. doi: 10.1016/j.cell.2011.08.017. [DOI] [PMC free article] [PubMed] [Google Scholar]
- 45.Mertz JA, et al. Targeting MYC dependence in cancer by inhibiting BET bromodomains. Proceedings of the National Academy of Sciences of the United States of America. 2011;108:16669–16674. doi: 10.1073/pnas.1108190108. [DOI] [PMC free article] [PubMed] [Google Scholar]
- 46.Puissant A, et al. Targeting MYCN in neuroblastoma by BET bromodomain inhibition. Cancer discovery. 2013;3:308–323. doi: 10.1158/2159-8290.CD-12-0418. [DOI] [PMC free article] [PubMed] [Google Scholar]
- 47.Bandopadhayay P, et al. BET bromodomain inhibition of MYC-amplified medulloblastoma. Clinical cancer research : an official journal of the American Association for Cancer Research. 2014;20:912–925. doi: 10.1158/1078-0432.CCR-13-2281. [DOI] [PMC free article] [PubMed] [Google Scholar]
- 48.Chen JK, Taipale J, Young KE, Maiti T, Beachy PA. Small molecule modulation of Smoothened activity. Proceedings of the National Academy of Sciences of the United States of America. 2002;99:14071–14076. doi: 10.1073/pnas.182542899. [DOI] [PMC free article] [PubMed] [Google Scholar]
- 49.Maity T, Fuse N, Beachy PA. Molecular mechanisms of Sonic hedgehog mutant effects in holoprosencephaly. Proceedings of the National Academy of Sciences of the United States of America. 2005;102:17026–17031. doi: 10.1073/pnas.0507848102. [DOI] [PMC free article] [PubMed] [Google Scholar]
- 50.Lewis KE, Concordet JP, Ingham PW. Characterisation of a second patched gene in the zebrafish Danio rerio and the differential response of patched genes to Hedgehog signalling. Developmental biology. 1999;208:14–29. doi: 10.1006/dbio.1998.9169. [DOI] [PubMed] [Google Scholar]
- 51.Shen MC, et al. Heat-shock-mediated conditional regulation of hedgehog/gli signaling in zebrafish. Developmental dynamics : an official publication of the American Association of Anatomists. 2013;242:539–549. doi: 10.1002/dvdy.23955. [DOI] [PubMed] [Google Scholar]
- 52.Macdonald R, et al. Midline signalling is required for Pax gene regulation and patterning of the eyes. Development. 1995;121:3267–3278. doi: 10.1242/dev.121.10.3267. [DOI] [PubMed] [Google Scholar]
- 53.Lee J, et al. An ENU mutagenesis screen in zebrafish for visual system mutants identifies a novel splice-acceptor site mutation in patched2 that results in Colobomas. Investigative ophthalmology & visual science. 2012;53:8214–8221. doi: 10.1167/iovs.12-11061. [DOI] [PMC free article] [PubMed] [Google Scholar]
- 54.Chen MH, et al. Cilium-independent regulation of Gli protein function by Sufu in Hedgehog signaling is evolutionarily conserved. Genes & development. 2009;23:1910–1928. doi: 10.1101/gad.1794109. [DOI] [PMC free article] [PubMed] [Google Scholar]
- 55.Roessler E, et al. A previously unidentified amino-terminal domain regulates transcriptional activity of wild-type and disease-associated human GLI2. Human molecular genetics. 2005;14:2181–2188. doi: 10.1093/hmg/ddi222. [DOI] [PubMed] [Google Scholar]
- 56.Goodrich LV, Milenkovic L, Higgins KM, Scott MP. Altered neural cell fates and medulloblastoma in mouse patched mutants. Science. 1997;277:1109–1113. doi: 10.1126/science.277.5329.1109. [DOI] [PubMed] [Google Scholar]
- 57.Aszterbaum M, et al. Ultraviolet and ionizing radiation enhance the growth of BCCs and trichoblastomas in patched heterozygous knockout mice. Nature medicine. 1999;5:1285–1291. doi: 10.1038/15242. [DOI] [PubMed] [Google Scholar]
- 58.Lee EY, et al. Hedgehog pathway-regulated gene networks in cerebellum development and tumorigenesis. Proceedings of the National Academy of Sciences of the United States of America. 2010;107:9736–9741. doi: 10.1073/pnas.1004602107. [DOI] [PMC free article] [PubMed] [Google Scholar]
- 59.Houzelstein D, et al. Growth and early postimplantation defects in mice deficient for the bromodomain-containing protein Brd4. Molecular and cellular biology. 2002;22:3794–3802. doi: 10.1128/MCB.22.11.3794-3802.2002. [DOI] [PMC free article] [PubMed] [Google Scholar]
- 60.Cooper MK, Porter JA, Young KE, Beachy PA. Teratogen-mediated inhibition of target tissue response to Shh signaling. Science. 1998;280:1603–1607. doi: 10.1126/science.280.5369.1603. [DOI] [PubMed] [Google Scholar]
- 61.Subramanian A, et al. Gene set enrichment analysis: a knowledge-based approach for interpreting genome-wide expression profiles. Proceedings of the National Academy of Sciences of the United States of America. 2005;102:15545–15550. doi: 10.1073/pnas.0506580102. [DOI] [PMC free article] [PubMed] [Google Scholar]
Associated Data
This section collects any data citations, data availability statements, or supplementary materials included in this article.
Supplementary Materials
Supplemental Figure 1. Quantitative RT-PCR showing Gli1 mRNA levels in Hh-Light2 cells treated with Hh ligand (Shh-N CM or SAG) alone or in combination with increasing doses of JQ1. Data represent mean of triplicates ± SD.
Supplemental Figure 2. (a)Quantitative RT-PCR of Gli1, Gli2, Brd4 and Smo in wild-type (WT) MEFs and Sufu−/− MEFs. Data represent mean of triplicates ± SD. (b) Quantitative RT-PCR of Gli1 mRNA in Sufu−/− MEFs in response to increasing doses of JQ1. Data represent mean of triplicates ± SD. (c) Quantitative RT-PCR of Gli1, Gli2, Brd2 and Brd3 mRNAs in Sufu−/− MEFs expressing shBrd2s, shBrd3s or shCtrl. Data represent mean of triplicates ± SD. (d) Quantitative RT-PCR showing Ptch1 mRNA levels in Hh-Light2 cells transiently transfected with HA-Gli2-FL or Myc-GLI2-DN and their response to JQ1, GDC-0449, LDE225 or SANT-1. Data represent mean of triplicates ± SD. (e)Quantitative RT-PCR of Gli1 and Gli2 mRNAs showing the time course of decreased Gli1 and Gli2 mRNA levels in response to JQ1 (1 uM). Data represent mean of triplicates ± SD.
Supplemental Figure 3. In SmoWT-MB, Med1-MB and ASZ001 cells, (a) Quantitative RT-PCR of Gli1 mRNA levels in response to increasing doses of JQ1, data represent mean of triplicates ± SD. (b) Quantitative RT-PCR showing time course of Gli1 and Gli2 mRNA levels in response to JQ1 treatment (1 uM) , data represent mean of triplicates ± SD. (c,d) ChIP-qPCR analysis of Brd4 and PolII occupancies on Gli1 and Gli2 promoter regions, data represent mean of triplicates ± SD.
Supplemental Figure 4. (a) Comparison of JQ1 dose-response measuring cell viability in Hh-driven tumor cells (SmoWT-MB and Med1-MB) and normal cells (Hh-Light2 and Sufu−/− MEF). Data represent group means ± SD. JQ1 dose-response curves measuring cell viability from day1 to day3 in SmoWT-MB (b) and Med1-MB (c) cells, data represent group means ± SD. Annexin V/DAPI staining FACS analysis measuring cell apoptosis in response to JQ1 or SMO inhibitors in SmoWT-MB (d) and Med1-MB (e) cells. (f) In Med1-MB cells, PI staining FACS analysis measuring cell cycle distribution in response to JQ1. (g) Combination treatment using increasing doses of JQ1 and GDC-0449 in SmoWT-MB cells to test the drug synergy. Data represent group means ± SD. (h) Quantitative RT-PCR analysis of Myc and Mycn mRNA levels in response to JQ1 (1 uM) or GDC-0449 (0.1 uM) treatment in SmoWT-MB cells. Data represent mean of triplicates ± SD.
Supplemental Figure 5. (a) Hierarchical clustering of samples and differentially regulated genes following 6-hour treatment of SmoWT MB cells with DMSO, JQ1 (1uM), or GDC-0449 (0.1uM). Red indicates increased gene expression and blue reduced gene expression and displayed as row normalized data. Venn diagram and statistical analysis of the overlapping differentially expressed genes (b) or enriched gene sets (c) between JQ1- and GDC-0449-treated SmoWT MB cells. Chi-square test and Fisher's exact test were used for statistical analysis. (d) GSEA analysis of JQ1-treated SmoWT-MB cells using “LEE_GLI1” gene sets.
Supplemental Figure 6. In SmoD477G-MB, RCMB025 and CHB_ATRT1 cells, (a) proliferative index was measured by EdU incorporation in response to JQ1, GDC-0449 or LDE225. (b) Myc/MYC and Mycn/MYCN expressions were measured by qRT-qPCR in response to JQ1 or SMO inhibitors. Data represent group means ± SD.
Supplemental Figure 7. (a) Tumor size of JQ1 or vehicle treated Med1-MB flank allografts at day 21 post treatment. Quantitative RT-PCR of Gli1, Gli2, Brd4 and Smo in Med1-MB (b), SmoWT-MB (c), SmoD477G (d), SMOi-naïve mBCC (e) and SMOi-resistant mBCC (f) allografts after JQ1 treatment. Data represent group means ± S.E.M. Student's t-test was used for statistical analysis. * P < 0.05, ** P < 0.01, *** P < 0.001.
Supplemental Table 1. Gene sets derived from Lee et al., PNAS 2010.
Supplemental Table 2. qPCR primers used in study.
Supplemental Dataset 1. ssGSEA of gene expression data generated from SmoWT MB cells exposed for 6h to DMSO, JQ1 (1uM), or GDC-0449 (0.1uM) using v2.0 CGP gene sets (http://www.broadinstitute.org/gsea/msigdb/index.jsp).