

Abstract
BACKGROUND
Patients with a short QT syndrome (SQTS) have an increased risk for atrial, ventricular tachyarrhythmias and/or sudden cardiac death. PQ segment depression (PQD) is related to atrial fibrillation and carries a poor prognosis in the setting of acute inferior myocardial infarction and is a well defined ECG marker of acute pericarditis.
OBJECTİVES
The aim of this study was to evaluate the prevalence of PQD in SQTS and to analyze the association with atrial arrhythmias.
METHODS
Digitalized 12-lead ECGs of SQTS patients were evaluated for PQD in all leads and for QT intervals in lead II and V5. PQD was defined as ≥ 0.05 mV (0.5 mm) depression from the isoelectric line.
RESULTS
A total of 760 leads from 64 SQTS patients [mean age 36 ± 18 years, 48 males (75%)] were analyzed. PQD was seen in 265 (35%) leads from 52 (81%) patients and was more frequent in leads II, V3, aVF, V4, and I [n=43 (67%), n=30 (47%), n=27 (42%), n=25 (39%), n=25 (39%), respectively]. Nine of 64 patients (14%) presented with atrial tachyarrhythmias and all of them had PQD.
CONCLUSIONS
Fifty-two of 64 patients (81%) with SQTS reveal PQD. As PQD is rarely observed in healthy subjects, this ECG stigma may constitute a novel marker for SQTS in addition to a short QT interval.
Keywords: PQ depression, short QT syndrome, sudden cardiac death, ECG
Introduction
Short-QT-syndrome (SQTS) is a recently described highly arrhythmogenic cardiac channelopathy characterized by shortened QTc-interval, reduced atrial and ventricular effective refractory periods, and atrial and/or ventricular arrhythmias with an increased risk for familial sudden cardiac death1. Although the hallmark of the disease is a short QT interval on ECG, a universally accepted diagnostic cut-off value of short QT interval has not been defined. SQTS was initially recognized in patients with QTc interval of 300 ms or less. However, in subsequent studies, patients with similar clinical presentations and slightly or moderately shortened QT intervals (≤ 340–360 ms) were described2–5. Moreover, impaired QT adaptation to heart rate changes makes the correction formulas like Bazett or Fredericia inappropriate or of limited value in SQTS patients with heart rates above 100/min or below 60/min4, 6, 7. Poor performance of correction formulas, in addition to lack of universal diagnostic cut-off value for a SQTS, makes it difficult to establish a diagnosis in cases of borderline shortened QT intervals. Apart from a short QT interval, the ECG pattern of the ST segment, the T wave (tall and symmetrical T waves with a short interval between the QRS offset and the onset of T wave), an abnormal J point-Tpeak interval, Tpeak-Tend/QTc intervals or frequent clear demarcation of the U-wave (especially in precordial leads), as well as the lack of adaptation of the QT interval during exercise were previously reported to be helpful to establish the diagnosis of SQTS8–10.
Beside these markers of shortened ventricular repolarization, ECG markers of atrial repolarization abnormalities may improve the diagnostic value in differentiating patients with a SQTS. The greater abbreviation of the action potential of the pectinate muscle as compared to the cristae terminalis generates a spatial dispersion of repolarization in atria, which may cause a PQ depression on ECG due to a voltage gradient11. A heterogeneous shortening of atrial repolarization and a reduced wavelength lead clinically to an increased incidence of atrial fibrillation/flutter in patients with a congenital SQTS5. However, the impact of spatial repolarization dispersion on the PQ segment has not been established in SQTS.
PQ segment depression (PQD) is a well defined electrocardiographic marker of acute pericarditis. It is related to injury like currents and is present in the acute phase in up to 82% of patients12. Furthermore, it is a powerful tool in the differential diagnosis of patients with STEMI12–16. PQD is also associated with extensive atrial myocardial damage, atrial fibrillation and poor prognosis in patients with an acute inferior myocardial infarction17; Finally, it has been observed during ablation of the left upper pulmonary vein or in patients with atrial tumors18, 19.
The aim of this study was to evaluate the prevalence of PQD in SQTS, the value of PQD as an additional diagnostic ECG marker of SQTS.
Methods
Study Population
This multicenter study population consisted of 64 patients (48 males, age 36 ± 18 years, range 5–88 years) diagnosed with SQTS from a European SQTS registry5. In this registry, the SQTS was diagnosed: (1) if the patient had a QTc interval of 360 ms or less (in lead II or V5), with history of sudden death or aborted sudden death or syncope of arrhythmic origin; or (2) if subjects had a very short QT interval (QTc < 340 ms) (even if they were asymptomatic); or (3) if the patient had a short QT interval (QTc interval ≤ 360 ms, in lead II or V5) with a family history of SQTS.
To best of our knowledge, there is not any large scale study reporting about an abnormal or physiological PQ segment deviation in healthy subjects. Hence, we included age- and sex-matched 117 subjects as a control group without any known structural structural heart disease or channelopathy; to evaluate the presence and frequency of PQD in normal population and to avoid the bias and hypothesis driven false positive results due to the measurements performed in a single group.
ECG Measurements
All resting 12-lead ECGs (paper speed 25 or 50 mm/s, gain 10 mm/mV) of SQTS patients were scanned and analyzed for PQD in all leads and for QT-intervals in lead II and V5. All measurements were performed after 4-fold magnification of the ECGs (using Adobe Acrobat 8 Professional; Adobe Systems Incorporated, San Jose, CA).
PQ segment depression was defined as ≥ 0.05 mV (0.5 mm) depression from the isoelectric line. The TP segment (the isoelectric interval between the end of T wave and the next P wave) was used as baseline for the examinations20,21. If no clear-cut TP segment could be defined or in case of drifting, non-parallel TP and PQ baselines, the beat with less drifting baseline has been chosen for measurement and if it was not possible at all, the vertical distance from the beginning of P wave to the dip of PQ segment was measured (Figure 1).
Figure 1.

Measurement of PQ-segment depression with (A) and without (B) clear-cut TP segment (without clear-cut TP segment the vertical distance from the beginning of P wave to the dip of PR segment was measured)
In lead aVR, PQ segment elevation (≥ 0.05 mV) was accepted as equal to PQD in other leads. The ECGs of each patient were examined separately by three investigators blinded to the clinical information. In case of disagreement, decision was made by majority vote. The quantitative measurements were made by a single investigator. For intra-observer reliability analysis of quantitative measurements, a sample of 20 patients was re-analysed. The intra-observer correlation co-efficient was between 0.82 and 0.98; and variability was <16% in all leads.
The end of T wave was defined by a standard tangential method and the QT-interval was corrected for the heart rate according to Bazett’s formula.
Statistical Analysis
Numerical variables were presented as mean ± standard deviation (SD) and when the distributions were skewed, as the median and interquartile range; categorical variables are presented as absolute numbers and percentages. The differences in mean values between groups were analyzed with Student’s t-test for independent samples. When distribution of variable is skewed the Mann-Whitney U-test is used for comparison of 2 groups and the Kruskal-Wallis test is used for comparison of 3 groups. The categorical variables were analyzed with Pearson’s chi-square test. P values < 0.05 were considered significant. The receiver operating characteristics (ROC) curve was obtained for the various PQ depression cut-off values, as a predictor of atrial fibrillation/flutter. Youden’s index was calculated (YI = sensitivity + specificity –1) for each coordinate point of the ROC curve to determine the cut-off value, which has the maximum sensitivity and specificity pair. Statistical analyses were performed using Statistical Package for Social Science (SPSS) for Windows version 16.0 (SPSS, Chicago, IL, USA).
Results
Demographic, Clinical and Genetic Data
Sixty-four patients with SQTS and 117 subjects without any structural heart disease or channelopathy were included in the study. Of the 64 patients, 48 (75%) were males and the median age was 30 years (interquartile range: 23 to 44 years). Patients and controls demographic, clinical, genetic and ECG data are summarized in table 1. Thirty (47%) patients had symptoms including 18 (28%) patients with cardiac arrest (5 patients deceased), 5 (8%) patients with syncope (1 with presyncope), 9 (14%) patients with atrial fibrillation/flutter and 15 (23%) patients with ventricular premature contractions. Three of 9 patients had atrial fibrillation/flutter before 35 years of age. Initial presentation was cardiac arrest in 15 patients, syncope in 4 patients and palpitations in 5 patients.
Table 1.
Patients and controls demographical, clinical, genetic and basal ECG data.
| Patients (n=64) | Controls (n=117) | P-value | |
|---|---|---|---|
| Age in years (Median, IQR) | 30 (IQR: 21) | 36 (IQR: 38) | 0.28 |
| Male sex, n (%) | 48 (75%) | 72 (62%) | 0.07 |
| Baseline Heart Rate (mean ± SD) | 79±21 | 72±14 | 0.02 |
| Cardiac arrest, n (%) | 18 (28%) | - | |
| Syncope, n (%) | 5 (8%) | - | |
| Atrial fibrillation/Flutter, n (%) | 9 (14%) | - | |
| ECG Intervals, ms QTc (II) (mean ± SD) | 320.9 ± 29.4 | 414.2±27.7 | 0.0001 |
| Genetic Screening, n (%) | 46 (72%) | - | |
| KCNH2(HERG) Mutation | 13 (20%) | ||
| CACNB2b Mutation | 2 (3%) | ||
| PQD in any lead, n (%) | 52 (81%) | 28 (24%) | 0.0001 |
IQR: Interquartile Range; Values are n (%) or mean ± SD
Genetic screening was performed in 46 patients: 13 (20%) patients were identified with a gain-of-function mutation in KCNH2 (HERG) and 2(3%) patients with loss-of-function in cardiac L-type calcium channel (CACNB2b).
Electrocardiography
760 leads of 64 SQTS patients and 1404 leads of 117 controls were analyzed (8 leads of two SQTS patients were missing). QTc intervals were shown in table 1. PQD was seen in 52/64 (81%) patients and in 265/760 (35%) leads of patients (Fig. 2). PQD was seen only in 28/117 (24%) subjects and in 73/1404 (5.1%) leads of healthy subjects (p<0.0001). PQD was most often found in both the anterior and inferior leads in patients. Lead II was the most common (67%) and lead aVL was the rarest (3%) lead for PQD (Fig. 3). PQD was also most frequent in inferior leads [n=18 (15.8%) in lead II; n=9 (7.7%) in lead aVF] in healthy subjects. PQ segment elevation in aVR was found in 36% (n=23) of the patients and 6.8% (n=8) in controls. PQD was rare in other leads in control group (<10%). PQD was more prominent in the inferior leads in patients and healthy controls, especially in lead II (Fig. 2). PQD was also more prevalent in all leads in SQTS patients compared to controls (p=0.05 for aVL, p<0.001 for other leads).
Figure 2.

Twelve-Lead electrocardiogram of a patient with a short QT syndrome showing PQ depression (small arrows indicating PQD in leads II, aVF, V3–4).
Figure 3.
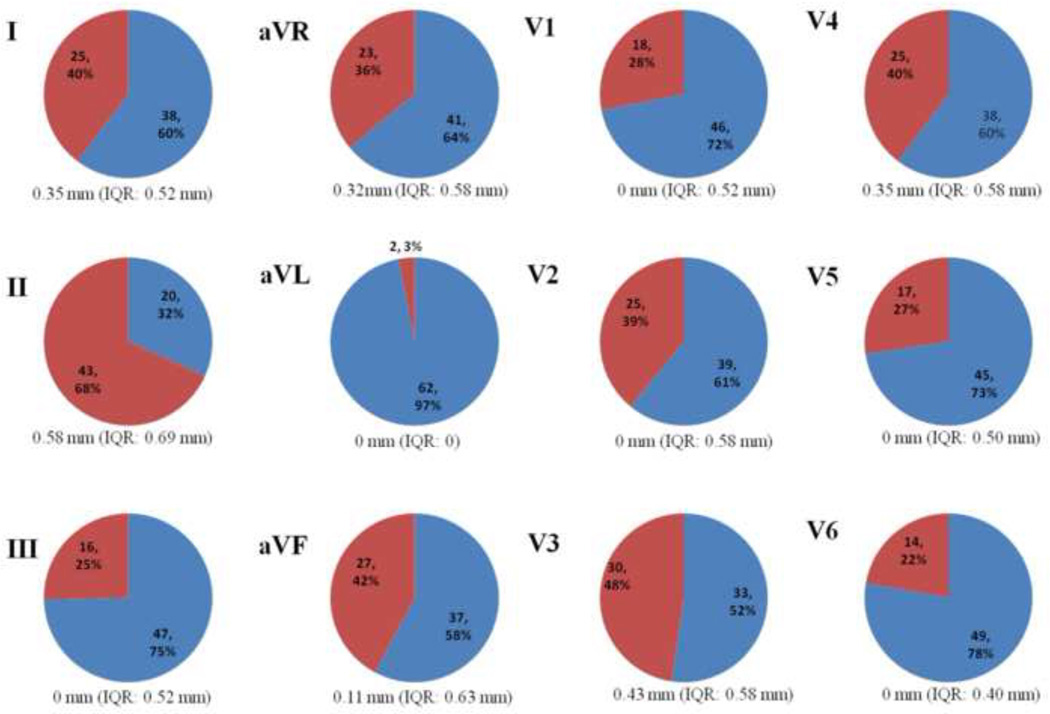
Distribution of PQD in relation to ECG leads (Values are n (%); PQD is presented in red sections; values under diagrams are median value and interquartile range for PQD in each lead)
QTc (II) and QTc (V5) were not significantly different between patients with PQD in any lead and without PQD in any lead in patients (Table 2).
Table 2.
QTc-intervals in patients with and without PQD according to leads in SQTS patients
| Lead (PQD) |
QTc (II) | p | QTc (V5) | p | ||
|---|---|---|---|---|---|---|
| PQD (−) | PQD (+) | PQD (−) | PQD (+) | |||
| I | 322.3±30.0 | 320.4±28.2 | 0.8 | 321.5±29.8 | 324.1±24.9 | 0.7 |
| II | 313.9±28.4 | 325.1±29.0 | 0.1 | 314.8±26.0 | 326.2±28.2 | 0.1 |
| III | 318.2±26.6 | 331.4±34.5 | 0.1 | 319.2±26.5 | 332.6±29.9 | 0.1 |
| aVR | 320.0±26.9 | 322.4±33.9 | 0.7 | 321.7±27.8 | 322.7±28.6 | 0.8 |
| aVL | 321.9±28.2 | 287.7±57.4 | 0.1 | 322.5±28.1 | 306.8±15.2 | 0.4 |
| aVF | 317.1±26.6 | 326.0±32.5 | 0.2 | 316.8±25.3 | 329.3±30.0 | 0.07 |
| V1 | 319.2±31.7 | 325.0±22.6 | 0.4 | 322.1±29.3 | 322.0±24.8 | 0.9 |
| V2 | 324.3±28.2 | 315.5±30.8 | 0.2 | 323.7±26.1 | 319.4±30.8 | 0.5 |
| V3 | 322.9±29.1 | 317.3±29.5 | 0.4 | 322.2±26.1 | 320.5±29.6 | 0.8 |
| V4 | 324.6±29.9 | 316.8±27.7 | 0.3 | 324.0±26.5 | 320.3±30.0 | 0.6 |
| V5 | 322.6±28.7 | 316.6±31.0 | 0.4 | 321.7±25.7 | 322.4±32.8 | 0.9 |
| V6 | 322.4±27.9 | 325.4±33.7 | 0.5 | 320.3±25.9 | 330.3±33.6 | 0.2 |
Values are mean ± SD
As PQD is related to atrial repolarization, the relationship between PQD and atrial arrhythmias was evaluated: patients with PQD in any lead vs. patients without any PQD; or presence of PQD in every lead separately.
There was no significant association between the prevalence of PQD and atrial arrhythmias. However, all of 9 patients with atrial fibrillation/flutter had PQD at least in one lead. We also conducted quantitative measurements of PQ depression and found that the patients with atrial arrhythmias had significantly more prominent PQ depression in leads II, III and aVF, i.e. inferior leads. (0.44 mm vs 0.78 mm, p:0.01; 0.17 mm vs. 0.48 mm, p:0.005 ; 0.28 mm vs. 0.66 mm, p:0.004, respectively). The cut-off values for atrial arrhythmias in leads II, III, aVF were 0.66 mm, 0.59 mm, 0.42 mm, respectively (sensitivity 67%, 67%, 89%; specificity 80%, 82%, 65%, respectively). There was no significant difference in quantitative PQ depression in any other leads. Quantitative measurements of PQ depression were similar in all leads between patients with and without syncope or cardiac arrest (data not shown).
There was also no significant difference between patients with and without PQD in any lead in terms of gender, age, QT intervals, cardiac arrest, and syncope (Table 3).
Table 3.
QT intervals and clinical events in SQTS patients with PQD in at least one lead and without any PQD
| Variable | PQD (+) in at least one lead (n=52) |
PQD (−) (n=12) |
P value |
|---|---|---|---|
| Male/Female gender | 37 (71%)/15(29%) | 11(92%)/1(8%) | 0.2 |
| Age, year | 36±17 | 38±24 | 0.6 |
| QTc (II), ms | 321.1±30.8 | 319.6±22.7 | 0.8 |
| QTc (V5), ms | 323.4±28.5 | 315.9±25.0 | 0.4 |
| Cardiac arrest | 17 (32%) | 1 (8%) | 0.08 |
| Syncope | 5 (9%) | 0 | -- |
| Atrial fibrillation/flutter | 9 (17%) | 0 | -- |
Values are n (%) or mean ± SD
Discussion
SQTS is a recently recognized cardiac channelopathy with an increased risk of life-threatening ventricular tachyarrhythmias and sudden cardiac death1. The major hallmark of the disease is a short QT interval. However, there is no clear cut-off value of short QT interval. Additional ECG markers like short or absent ST segment with tall, narrow, peaked, symmetrical T waves, presence of delineated U waves in precordial leads, or additional intervals like Tpeak-Tend, Tpeak-Tend/QTc, Jpoint-Tpeak may be helpful to ensure the diagnosis especially in patients with borderline QTc intervals (QTc 340–370 ms). In the present study, we conducted an analysis of ECGs of SQTS patients from European SQTS registry and observed that PQD is very frequent in SQTS patients.
The patients with QTc interval less than 320 ms were diagnosed with SQTS in early reports1, 6, 22, 23. Thereafter, Bjerregaard and coworkers24 proposed QTc < 350 ms as a short QT interval (<88% of the mean predicted value) and < 320 ms as a very short QT interval (<80% of the mean predicted value) based on Rataharju’s ECG analyses of 14379 healthy individuals25. Viskin et al demonstrated that male patients with idiopathic ventricular fibrillation had shorter QT intervals (371±22 ms) and suggested gender specific cut-off values (QTc < 360 ms for males, QTc < 370 ms for females) for short QT interval2. In several population based studies, the lower limit of QT intervals were identified between 332–380 ms for males and 344–390 ms for females26–31. It has also been shown that very short QT intervals (<300 ms) are very rare and a moderately shortened QT interval (<340 ms) does not always indicate an increased risk of sudden death7, 26, 31, 32. Nevertheless, there is still no clear consensus for the diagnostic cut-off value of QTc interval. In our patient population the mean QTc (II) and (V5) intervals were 320.9 ± 29.4 ms (range 242–368 ms) and 322.1 ± 27.9 ms (range 248–364 ms), respectively, though 18 patients had QTc (II)-interval longer than 340 ms. Moreover, contrary to population based studies with short QT interval subjects, cardiac arrest was the initial presentation in 18 of 65 patients. For the diagnosis of SQTS, especially with borderline shortened QT intervals, underlying conditions (hyperkalemia, hypercalcemia, hyperthermia, acidosis and digitalis overdose) should be excluded, other ECG patterns (T wave morphology, PQD, or presence of prominent U wave) should also be taken into consideration and genetic screening should be initiated33, 34. The mutations of cardiac ion channels (gain of function of K channels - KCNH2, KCNQ1, KCNJ2) and loss of function of cardiac L-type Ca channels (CACNA1C, CACNB2b, CACNA2D1) operating in phase 2 and 3 of the cardiac action potential are responsible for the abbreviation of action potential duration23, 35–38. These mutations lead to heterogenous abbreviation of the action potential duration (preferentially more on epi- and endocardial layers), to a shortened QT interval and also to peaked T wave, and ST segment elevation on the ECG11, 39. Antzelevitch et al proposed the heterogeneous shortening of action potential duration among the three layers of myocardium [increased transmural dispersion of repolarization (TDR)] and the decreased wavelength of activation as the mechanism of the arrhythmogenicity in SQTS11, 39.
Similarly, the presence of PQD in SQTS patients may be due to heterogeneous abbreviation of atrial repolarization, which is expected to manifest as a deviation in the voltage of the PQ segment. In both animals and humans, the atria are comprised of diverse cell types whose action potential morphologies differ because of differences in the contribution of outward and inward ion channel currents40–42. Atrial cells in the crista terminalis and the pectinate muscle have ion channels with different kinetic properties creating spatial dispersion of action potential duration between the crista terminalis and pectinate muscles as well as between atrial epicardium and endocardium11. This spatial dispersion of repolarization and attendant dispersion of refractoriness contributes to the development of arrhythmogenesis in the atria41, 43. The SQT1 form of the short QT syndrome has been shown to be associated with mutations in KCNH2, which cause a gain-of-function of IKr35. Using a coronary-perfused canine atrial preparation, Nof et al showed that the IKr agonist PD-118057 is capable of recapitulating the electrophysiologic and arrhythmic manifestations of SQT111. Abbreviation of action potential duration and effective refractory period together with amplification of spatial dispersion of repolarization predisposed to the development of atrial fibrillation by creating the substrate for reentry. The spatial dispersion of repolarization developed as a consequence of the greater abbreviation of the action potential of the pectinate muscle as compared to the cristae terminalis. This heterogeneous action of the IKr agonist created a voltage gradient at the level of the action potential plateau, giving rise to a depression in the pseudo-ECG. This depression is expected to cause a PQ depression in the body surface ECG11.
PQD is also seen up to 24% in control group (mostly due to PQD in lead II). One of the possible explanation for this phenomenon in healthy subjects might be simply the augmentation of the atrial T wave in some patients (as it is more prominent and prevalent in lead II). Another plausible explanation could be the increased spatial dispersion in atria in otherwise healthy subjects as in SQTS patients. However, the exact mechanism for PQD in healthy subject, as well as the clinical implications of PQD in healthy subjects (whether PQD is a predictor for atrial arrhtyhmias or other clinical events in the future) remains unknown and requires further studies.
In previous studies, PQD was shown to be a prognostic indicator of atrial fibrillation and poor outcome in several clinical situations17, 44–47. In accordance with previous studies, we found that patients with atrial arrhythmias had significantly more pronounced PQ depression in inferior leads, supporting the proposed mechanism of heterogeneous abbreviation of action potentials and consequent spatial repolarization dispersion and voltage gradient presenting as PQD and increased risk of arrhythmias in SQTS.
PQD has also been shown to occur rarely during the left upper pulmonary vein ablation or atrial tumors18, 19. In acute pericarditis, likewise, PQD is presented in about 80% of the patients and it also occurs earlier than ST elevation in course12,48. Proposed mechanism of PQD in these settings is the transient increase in the magnitude (without change in direction) of the atrial repolarization vector due to injury currents12, 18. In acute pericarditis, ST elevation and PQD share the same mechanism, which is the injury current due to epimyocarditis. Ventricular epimyocarditis manifests as ST elevation and atrial epimyocarditis manifests as PQD. As in acute pericarditis, PQD is present in 81% of SQTS patients, and more prevalent and prominent in inferior and anterior leads consistent with the direction of the atrial repolarization vector.
Limitations
Our study has several limitations. The lack of control group consisted of subjects with borderline QT intervals is one of the limitations in the present study. Nevertheless, healthy subjects with borderline QT-interval are extreme rare to constitute a control group and the question whether these subjects are so far asymptomatic SQTS patients or healthy subject with QT interval in very lower physiological border, would remain unanswered. Therefore, we included age- and sex-matched subjects with normal QT intervals without any structural heart disease or channelopathy as a control group to compare the presence and frequency of PQD in healthy subjects with SQTS patients.
Measurement related issues are the other limitations of our study. Tachycardia or drifting baselines may interfere with measurement of the PQD, and also the risks related to manual measurements could not be totally excluded.
Another limitation of the present study is the predefined cut-off value of 0.5 mm. This value was chosen according to previous studies20, 21, 44–46. However, this cut-off value was used for definition of PQD in pericarditis or atrial infarction and might not be appropriate to assess the PQD in STQS.
Conclusion
In this study, we showed a significantly high prevalence (81% of patients) of PQD in SQTS. The association between the degree of PQD in inferior leads and atrial arrhythmias suggests that an augmented TDR and resulting currents in atria may be the operative mechanism. This frequent ECG pattern in SQTS reflecting augmented atrial TDR may constitute a novel marker for SQTS in addition to a short QT interval.
Abbreviations
- SQTS
Short QT Syndrome
- ECG
Electrocardiogram
- PQD
PQ segment depression
Footnotes
Disclosures: There is no potential conflict of interest to disclose for any of the co-authors.
References
- 1.Gaita F, Giustetto C, Bianchi F, Wolpert C, Schimpf R, Riccardi R, Grossi S, Richiardi E, Borggrefe M. Short QT Syndrome: a familial cause of sudden death. Circulation. 2003 Aug 26;108:965–970. doi: 10.1161/01.CIR.0000085071.28695.C4. [DOI] [PubMed] [Google Scholar]
- 2.Viskin S, Zeltser D, Ish-Shalom M, Katz A, Glikson M, Justo D, Tekes-Manova D, Belhassen B. Is idiopathic ventricular fibrillation a short QT syndrome? Comparison of QT intervals of patients with idiopathic ventricular fibrillation and healthy controls. Heart Rhythm. 2004 Nov;1:587–591. doi: 10.1016/j.hrthm.2004.07.010. [DOI] [PubMed] [Google Scholar]
- 3.Watanabe H, Makiyama T, Koyama T, et al. High prevalence of early repolarization in short QT syndrome. Heart Rhythm. 2010 May;7:647–652. doi: 10.1016/j.hrthm.2010.01.012. [DOI] [PubMed] [Google Scholar]
- 4.Schimpf R, Wolpert C, Gaita F, Giustetto C, Borggrefe M. Short QT syndrome. Cardiovasc Res. 2005 Aug 15;67:357–366. doi: 10.1016/j.cardiores.2005.03.026. [DOI] [PubMed] [Google Scholar]
- 5.Giustetto C, Schimpf R, Mazzanti A, Scrocco C, Maury P, Anttonen O, Probst V, Blanc JJ, Sbragia P, Dalmasso P, Borggrefe M, Gaita F. Long-term follow-up of patients with short QT syndrome. J Am Coll Cardiol. 2011 Aug 2;58:587–595. doi: 10.1016/j.jacc.2011.03.038. [DOI] [PubMed] [Google Scholar]
- 6.Giustetto C, Di Monte F, Wolpert C, Borggrefe M, Schimpf R, Sbragia P, Leone G, Maury P, Anttonen O, Haissaguerre M, Gaita F. Short QT syndrome: clinical findings and diagnostic-therapeutic implications. Eur Heart J. 2006 Oct;27:2440–2447. doi: 10.1093/eurheartj/ehl185. [DOI] [PubMed] [Google Scholar]
- 7.Kobza R, Roos M, Niggli B, Abacherli R, Lupi GA, Frey F, Schmid JJ, Erne P. Prevalence of long and short QT in a young population of 41,767 predominantly male Swiss conscripts. Heart Rhythm. 2009 May;6:652–657. doi: 10.1016/j.hrthm.2009.01.009. [DOI] [PubMed] [Google Scholar]
- 8.Wolpert C, Schimpf R, Giustetto C, Antzelevitch C, Cordeiro J, Dumaine R, Brugada R, Hong K, Bauersfeld U, Gaita F, Borggrefe M. Further insights into the effect of quinidine in short QT syndrome caused by a mutation in HERG. J Cardiovasc Electrophysiol. 2005 Jan;16:54–58. doi: 10.1046/j.1540-8167.2005.04470.x. [DOI] [PMC free article] [PubMed] [Google Scholar]
- 9.Anttonen O, Junttila MJ, Maury P, et al. Differences in twelve-lead electrocardiogram between symptomatic and asymptomatic subjects with short QT interval. Heart Rhythm. 2009 Feb;6:267–271. doi: 10.1016/j.hrthm.2008.10.033. [DOI] [PubMed] [Google Scholar]
- 10.Schimpf R, Antzelevitch C, Haghi D, Giustetto C, Pizzuti A, Gaita F, Veltmann C, Wolpert C, Borggrefe M. Electromechanical coupling in patients with the short QT syndrome: further insights into the mechanoelectrical hypothesis of the U wave. Heart Rhythm. 2008 Feb;5:241–245. doi: 10.1016/j.hrthm.2007.100.015. [DOI] [PMC free article] [PubMed] [Google Scholar]
- 11.Nof E, Burashnikov A, Antzelevitch C. Cellular basis for atrial fibrillation in an experimental model of short QT1: implications for a pharmacological approach to therapy. Heart Rhythm. 2010;7:251–257. doi: 10.1016/j.hrthm.2009.10.017. [DOI] [PMC free article] [PubMed] [Google Scholar]
- 12.Spodick DH. Diagnostic electrocardiographic sequences in acute pericarditis. Significance of PR segment and PR vector changes. Circulation. 1973 Sep;48:575–580. doi: 10.1161/01.cir.48.3.575. [DOI] [PubMed] [Google Scholar]
- 13.Porela P, Kyto V, Nikus K, Eskola M, Airaksinen KE. PR depression is useful in the differential diagnosis of myopericarditis and ST elevation myocardial infarction. Ann Noninvasive Electrocardiol. 2012 Apr;17:141–145. doi: 10.1111/j.1542-474X.2012.00489.x. [DOI] [PMC free article] [PubMed] [Google Scholar]
- 14.Ginzton LE, Laks MM. The differential diagnosis of acute pericarditis from the normal variant: new electrocardiographic criteria. Circulation. 1982 May;65:1004–1009. doi: 10.1161/01.cir.65.5.1004. [DOI] [PubMed] [Google Scholar]
- 15.Bruce MA, Spodick DH. Atypical electrocardiogram in acute pericarditis: characteristics and prevalence. J Electrocardiol. 1980;13:61–66. doi: 10.1016/s0022-0736(80)80011-2. [DOI] [PubMed] [Google Scholar]
- 16.Baljepally R, Spodick DH. PR-segment deviation as the initial electrocardiographic response in acute pericarditis. Am J Cardiol. 1998 Jun 15;81:1505–1506. doi: 10.1016/s0002-9149(98)00217-3. [DOI] [PubMed] [Google Scholar]
- 17.Jim MH, Siu CW, Chan AO, Chan RH, Lee SW, Lau CP. Prognostic implications of PR-segment depression in inferior leads in acute inferior myocardial infarction. Clin Cardiol. 2006 Aug;29:363–368. doi: 10.1002/clc.4960290809. [DOI] [PMC free article] [PubMed] [Google Scholar]
- 18.Sorgente A, Chierchia GB, Brugada P. PR-segment deviation during cryoballoon ablation. Europace. 2010 Dec;12:1761. doi: 10.1093/europace/euq304. [DOI] [PubMed] [Google Scholar]
- 19.Goldberger AL, Ludwig M. Metastatic atrial tumor: case report with electrocardiographic-pathologic correlation. J Electrocardiol. 1978 Jul;11:297–300. doi: 10.1016/s0022-0736(78)80132-0. [DOI] [PubMed] [Google Scholar]
- 20.Kudo Y, Yamasaki F, Doi Y, Sugiura T. Clinical correlates of PR-segment depression in asymptomatic patients with pericardial effusion. J Am Coll Cardiol. 2002 Jun 19;39:2000–2004. doi: 10.1016/s0735-1097(02)01889-2. [DOI] [PubMed] [Google Scholar]
- 21.Chan TC, Brady WJ, Pollack M. Electrocardiographic manifestations: acute myopericarditis. J Emerg Med. 1999 Sep-Oct;17:865–872. doi: 10.1016/s0736-4679(99)00097-9. [DOI] [PubMed] [Google Scholar]
- 22.Gussak I, Brugada P, Brugada J, Wright RS, Kopecky SL, Chaitman BR, Bjerregaard P. Idiopathic short QT interval: a new clinical syndrome? Cardiology. 2000;94:99–102. doi: 10.1159/000047299. [DOI] [PubMed] [Google Scholar]
- 23.Priori SG, Pandit SV, Rivolta I, et al. A novel form of short QT syndrome (SQT3) is caused by a mutation in the KCNJ2 gene. Circ Res. 2005 Apr 15;96:800–807. doi: 10.1161/01.RES.0000162101.76263.8c. [DOI] [PubMed] [Google Scholar]
- 24.Bjerregaard P, Gussak I. Short QT syndrome: mechanisms, diagnosis and treatment. Nat Clin Pract Cardiovasc Med. 2005 Feb;2:84–87. doi: 10.1038/ncpcardio0097. [DOI] [PubMed] [Google Scholar]
- 25.Rautaharju PM, Zhou SH, Wong S, Calhoun HP, Berenson GS, Prineas R, Davignon A. Sex differences in the evolution of the electrocardiographic QT interval with age. Can J Cardiol. 1992 Sep;8:690–695. [PubMed] [Google Scholar]
- 26.Anttonen O, Junttila MJ, Rissanen H, Reunanen A, Viitasalo M, Huikuri HV. Prevalence and prognostic significance of short QT interval in a middle-aged Finnish population. Circulation. 2007 Aug 14;116:714–720. doi: 10.1161/CIRCULATIONAHA.106.676551. [DOI] [PubMed] [Google Scholar]
- 27.Sagie A, Larson MG, Goldberg RJ, Bengtson JR, Levy D. An improved method for adjusting the QT interval for heart rate (the Framingham Heart Study) Am J Cardiol. 1992 Sep 15;70:797–801. doi: 10.1016/0002-9149(92)90562-d. [DOI] [PubMed] [Google Scholar]
- 28.Vincent GM, Timothy KW, Leppert M, Keating M. The spectrum of symptoms and QT intervals in carriers of the gene for the long-QT syndrome. N Engl J Med. 1992 Sep 17;327:846–852. doi: 10.1056/NEJM199209173271204. [DOI] [PubMed] [Google Scholar]
- 29.Rautaharju PM, Prineas RJ, Kadish A, Larson JC, Hsia J, Lund B. Normal standards for QT and QT subintervals derived from a large ethnically diverse population of women aged 50 to 79 years (the Women's Health Initiative [WHI]) Am J Cardiol. 2006 Mar 1;97:730–737. doi: 10.1016/j.amjcard.2005.09.108. [DOI] [PubMed] [Google Scholar]
- 30.Mason JW, Ramseth DJ, Chanter DO, Moon TE, Goodman DB, Mendzelevski B. Electrocardiographic reference ranges derived from 79,743 ambulatory subjects. J Electrocardiol. 2007 Jul;40:228–234. doi: 10.1016/j.jelectrocard.2006.09.003. [DOI] [PubMed] [Google Scholar]
- 31.Bjerregaard P, Nallapaneni H, Gussak I. Short QT interval in clinical practice. J Electrocardiol. 2010 Sep-Oct;43:390–395. doi: 10.1016/j.jelectrocard.2010.06.004. [DOI] [PubMed] [Google Scholar]
- 32.Gallagher MM, Magliano G, Yap YG, Padula M, Morgia V, Postorino C, Di Liberato F, Leo R, Borzi M, Romeo F. Distribution and prognostic significance of QT intervals in the lowest half centile in 12,012 apparently healthy persons. Am J Cardiol. 2006 Oct 1;98:933–935. doi: 10.1016/j.amjcard.2006.04.035. [DOI] [PubMed] [Google Scholar]
- 33.Zhang L, Timothy KW, Vincent GM, et al. Spectrum of ST-T-wave patterns and repolarization parameters in congenital long-QT syndrome: ECG findings identify genotypes. Circulation. 2000 Dec 5;102:2849–2855. doi: 10.1161/01.cir.102.23.2849. [DOI] [PubMed] [Google Scholar]
- 34.Cheng TO. Digitalis administration: an underappreciated but common cause of short QT interval. Circulation. 2004 Mar 9;109:e152. doi: 10.1161/01.CIR.0000118177.56908.5B. author reply e152. [DOI] [PubMed] [Google Scholar]
- 35.Brugada R, Hong K, Dumaine R, et al. Sudden death associated with short-QT syndrome linked to mutations in HERG. Circulation. 2004 Jan 6;109:30–35. doi: 10.1161/01.CIR.0000109482.92774.3A. [DOI] [PubMed] [Google Scholar]
- 36.Bellocq C, van Ginneken AC, Bezzina CR, Alders M, Escande D, Mannens MM, Baro I, Wilde AA. Mutation in the KCNQ1 gene leading to the short QT-interval syndrome. Circulation. 2004 May 25;109:2394–2397. doi: 10.1161/01.CIR.0000130409.72142.FE. [DOI] [PubMed] [Google Scholar]
- 37.Antzelevitch C, Pollevick GD, Cordeiro JM, et al. Loss-of-function mutations in the cardiac calcium channel underlie a new clinical entity characterized by ST-segment elevation, short QT intervals, and sudden cardiac death. Circulation. 2007 Jan 30;115:442–449. doi: 10.1161/CIRCULATIONAHA.106.668392. [DOI] [PMC free article] [PubMed] [Google Scholar]
- 38.Templin C, Ghadri JR, Rougier JS, et al. Identification of a novel loss-of-function calcium channel gene mutation in short QT syndrome (SQTS6) Eur Heart J. 2011 May;32:1077–1088. doi: 10.1093/eurheartj/ehr076. [DOI] [PMC free article] [PubMed] [Google Scholar]
- 39.Extramiana F, Antzelevitch C. Amplified transmural dispersion of repolarization as the basis for arrhythmogenesis in a canine ventricularwedge model of short-QT syndrome. Circulation. 2004 Dec 14;110:3661–3666. doi: 10.1161/01.CIR.0000143078.48699.0C. [DOI] [PubMed] [Google Scholar]
- 40.Wang Z, Fermini B, Nattel S. Rapid and slow components of delayed rectifier current in human atrial myocytes. Cardiovasc Res. 1994 Oct;28:1540–1546. doi: 10.1093/cvr/28.10.1540. [DOI] [PubMed] [Google Scholar]
- 41.Burashnikov A, Mannava S, Antzelevitch C. Transmembrane action potential heterogeneity in the canine isolated arterially perfused right atrium: effect of IKr and IKur/Ito block. Am J Physiol Heart Circ Physiol. 2004 Jun;286:H2393–H2400. doi: 10.1152/ajpheart.01242.2003. [DOI] [PubMed] [Google Scholar]
- 42.Feng J, Yue L, Wang Z, Nattel S. Ionic mechanisms of regional action potential heterogeneity in the canine right atrium. Circ Res. 1998 Sep 7;83:541–551. doi: 10.1161/01.res.83.5.541. [DOI] [PubMed] [Google Scholar]
- 43.Schuessler RB, Kawamoto T, Hand DE, Mitsuno M, Bromberg BI, Cox JL, Boineau JP. Simultaneous epicardial and endocardial activation sequence mapping in the isolated canine right atrium. Circulation. 1993 Jul;88:250–263. doi: 10.1161/01.cir.88.1.250. [DOI] [PubMed] [Google Scholar]
- 44.Nagahama Y, Sugiura T, Takehana K, Tarumi N, Iwasaka T, Inada M. PQ segment depression in acute Q wave inferior wall myocardial infarction. Circulation. 1995 Feb 1;91:641–644. doi: 10.1161/01.cir.91.3.641. [DOI] [PubMed] [Google Scholar]
- 45.Nagahama Y, Sugiura T, Takehana K, Tarumi N, Iwasaka T, Inada M. Clinical significance of PQ segment depression in acute Q wave anterior wall myocardial infarction. J Am Coll Cardiol. 1994 Mar 15;23:885–890. doi: 10.1016/0735-1097(94)90633-5. [DOI] [PubMed] [Google Scholar]
- 46.Nagahama Y, Sugiura T, Takehana K, Hatada K, Inada M, Iwasaka T. The role of infarction-associated pericarditis on the occurrence of atrial fibrillation. Eur Heart J. 1998 Feb;19:287–292. doi: 10.1053/euhj.1997.0744. [DOI] [PubMed] [Google Scholar]
- 47.Flugelman MY, Hasin Y, Shefer A, Sebbag D, Freiman I, Gotsman MS. Atrial fibrillation in acute myocardial infarction. Isr J Med Sci. 1986 May;22:355–359. [PubMed] [Google Scholar]
- 48.Spodick DH. Electrocardiogram in acute pericarditis. Distributions of morphologic and axial changes by stages. Am J Cardiol. 1974 Apr;33:470–474. doi: 10.1016/0002-9149(74)90603-1. [DOI] [PubMed] [Google Scholar]