

Abstract
Aging decreases the density of spines and the proportion of thin spines in the non-human primate (NHP) dorsolateral prefrontal cortex (dlPFC). In this study, we used confocal imaging of dye-loaded neurons to expand upon previous results regarding the effects of aging on spine density and morphology in the NHP dlPFC and compared these results to the effects of aging on pyramidal neurons in primary visual cortex (V1). We confirmed that spine density, and particularly the density of thin spines, decreased with age in the dlPFC of rhesus monkeys. Furthermore, the average head diameter of non-stubby spines in the dlPFC was a better predictor than chronological age of the number of trials required to reach criterion on both the delayed response test of visuospatial working memory and the delayed nonmatching-to-sample test of recognition memory. By contrast, total spine density was lower on neurons in V1 than in dlPFC, and neither total spine density, thin spine density, nor spine size in V1 was affected by aging. Our results highlight the importance and selective vulnerability of dlPFC thin spines for optimal prefrontal-mediated cognitive function. Understanding the nature of the selective vulnerability of dlPFC thin spines as compared to the resilience of thin spines in V1 may be a promising area of research in the quest to prevent or ameliorate age-related cognitive decline.
Keywords: prefrontal cortex, visual cortex, dendritic spines, macaque, aging
Introduction
Aging humans and NHPs often develop cognitive impairment revealed by dlPFC-dependent cognitive tasks. Two tasks used to evaluate dlPFC function in NHPs are the delayed nonmatching-to-sample recognition memory task (DNMS) and the delayed response test of visuospatial working memory (DR) (Rapp and Amaral, 1989; Luebke et al., 2010). DR performance critically requires dlPFC integrity (Gross and Weiskrantz, 1962; Divac and Warren, 1971), and changes in dlPFC morphological and electrophysiological characteristics correlate with changes in DNMS performance (Peters et al., 1998; Chang et al., 2005; Shamy et al., 2011). Aging rhesus monkeys are generally impaired in both acquisition and performance across increasing memory delays on DR and DNMS (Rapp and Amaral, 1989; Roberts et al., 1997; Rapp et al., 2003; Nagahara et al., 2010), suggesting that dlPFC function may be degraded in aged animals. This can be contrasted with the relative preservation of function in aging humans and NHPs with respect to visual discrimination tasks not reliant on dlPFC (Bartus et al., 1979; Rapp, 1990; Rapp et al., 2003).
The delineation of the molecular and structural alterations that underlie these deficits is an important focus of research in cognitive aging. Normal aging is not associated with significant neuronal loss in the human (Pakkenberg and Gundersen, 1997) or macaque neocortex (Peters et al., 1994). Instead, age-related cognitive decline is thought to result from more subtle synaptic alterations (Morrison and Hof, 1997).
Most excitatory synapses between cortical neurons occur on dendritic protrusions called spines (Nimchinsky et al., 2002). Pyramidal neurons in the macaque dlPFC lose a significant proportion of their dendritic spines with age (Hao et al., 2007; Dumitriu et al., 2010), and morphologically distinct types of spines are differentially affected (Benavides-Piccione et al., 2013). Among spines with a discernable neck (non-stubby spines), the density of spines with large head diameters (mushroom spines) does not decrease with age in rhesus monkey dlPFC (Hao et al., 2007; Dumitriu et al., 2010). Instead, the age-related decrease in spine density is driven by the loss of long, thin spines (Hao et al., 2007; Dumitriu et al., 2010), thought to be highly plastic (Kasai et al., 2010) and critically important for working memory (Arnsten et al., 2012). We have hypothesized that the “synaptic strategy” underlying function of dlPFC requires the extensive ongoing synaptic plasticity and flexibility that thin spines provide (Morrison and Baxter, 2012). We hypothesize further that while synaptic plasticity also occurs in sensory areas such as primary visual cortex ( Trachtenberg et al., 2002; Gilbert and Li, 2012), the balance between stability and plasticity likely differs from dlPFC, which should be reflected in regional differences in both spine populations and vulnerability to age. Thus, we chose V1 for a regional comparison of age-related effects relevant to synaptic stability vs. plasticity. Other groups have also drawn regional comparisons between V1 and dlPFC in the context of synaptic aging (Peters et al., 1998, 2001; Amatrudo et al., 2012). To address this issue, we imaged pyramidal neurons in layer III of Brodmann areas 46 (dlPFC) and 17 (V1) and examined the density and morphology of dendritic spines along segments of apical and basal dendrites. We found that the density of thin spines is reduced with age in dlPFC, but not in V1, and that the density of other spine types does not change with age in either area.
Methods
All neurons analyzed were newly loaded for this experiment using tissue that had been stored at 4 °C in a solution of 0.1% sodium azide in phosphate buffered saline for up to 9 years prior to loading. Tissue slices were stored free-floating in well plates sealed with Parafilm and checked periodically to ensure adequate solution was present. Storage solution was changed whenever there was visible evidence of evaporation in one or more plates. Our replication and extension of previous findings from Dumitriu et al., 2010 using these methods from a subset of the same animals using an entirely different set of neurons is key given the current discussions regarding difficulty in replication of preclinical findings (Landis et al., 2012). In addition, demonstrating the validity of the use of stored tissue opens up opportunities for multiple additional studies of other cortical regions.
Animals
Seven young adult (9-13 years old; mean, 10.9 ± 0.6 years old; 1 male, 6 females) and ten aged (22-33 years old; mean, 27.2 ± 1.2 years old, 1 male, 9 females) rhesus monkeys (Macaca mulatta) were used for the analysis of area 46. Data from different sets of neurons from three of the young and two of the aged animals were reported previously in Dumitriu et al., 2010. For the analysis of V1, four young adult (9-11 years old; mean, 10.6 ± 0.5 years old; all female) and four aged (24-27 years old; mean, 26.1 ± 0.5 years old; all female) rhesus monkeys were used, including seven of the same animals used in the analysis of area 46. Behavioral results from several of these animals have been reported previously (Dumitriu et al., 2010). Animals were singly housed in colonies of approximately 40 individuals under the same conditions used in previous studies (Rapp et al., 2003; Hao et al., 2006, 2007), and water and monkey chow were provided in excess of nutritional needs. All experiments were conducted in compliance with the National Institutes of Health Guidelines for the Care and Use of Experimental Animals approved by the Institutional Animal Care and Use Committee at the University of California, Davis and Icahn School of Medicine at Mount Sinai.
Behavioral testing
DR test
Cognitive assessment included a delayed response test of spatiotemporal working memory, as previously described (Rapp et al., 2003; Shamy et al., 2011). Monkeys sat in a manual Wisconsin General Testing Apparatus and watched through a clear Plexiglass panel while the experimenter baited one of two wells and covered both with identical opaque covers. The left/right position of the rewarded location was varied pseudorandomly and balanced across trials. The Plexiglass panel was raised and the monkey was allowed to uncover one well to find the food reward. The task was first acquired with no delay for 30 trials per day until a criterion of 90% correct choices in 90 consecutive trials was reached. A one second delay was then imposed, during which an opaque screen was lowered, and monkeys were again required to reach a criterion of 90% correct choices in 90 consecutive trials. Monkeys were then tested on increasing delay intervals of 5, 10, 15, 30, and 60 seconds for 90 trials each.
DNMS test
Monkeys were tested on a delayed nonmatching-to-sample test of visual recognition memory as previously described (Rapp and Amaral, 1991; Rapp et al., 2003; Hara et al., 2012). Monkeys were placed in the same manual Wisconsin General Testing Apparatus as above and presented with a sample object covering the central well of the test tray, which contained a food reward. After the reward was retrieved, an opaque screen was lowered for the duration of the delay period. When the screen was again raised, the monkey was presented with two objects: the pre-delay sample item and a novel object. The the novel object covered the food reward. The intertrial interval was 30 seconds. The task was acquired using a delay period of 10 seconds, tested for 20 trials per day until a criterion of 90% correct was met across 100 consecutive trials. After reaching criterion, monkeys were tested on successively longer delay periods. Retention intervals of 15, 30, 60, and 120 seconds were tested for 100 trials each, 20 trials per day. The final delay period of 10 minutes was tested for 50 trials, 5 trials per day.
Quantitative analysis of dendritic spine density and morphology
Perfusion and tissue processing
Monkeys were perfused after behavioral testing was completed. Animals were first deeply anesthetized with ketamine hydrochloride (25 mg/kg) and sodium pentobarbital (20-35 mg/mg), intubated, and mechanically ventilated. Sodium nitrate (0.5%, 1.5 ml) was injected into the left ventricle of the heart, and the descending aorta was clamped. Transcardial perfusion was performed with cold 1% paraformaldehyde in 0.1 M phosphate buffer (pH 7.2) at a rate of 250 ml/min for 2 minutes, followed by 10 minutes of 4% paraformaldehyde in 0.1 M phosphate buffer at the same rate. The flow rate was then reduced to 100 ml/min for 50 minutes. If perfusion could not be scheduled immediately after completion of behavioral testing, monkeys continued mock testing until the day before perfusion.
After perfusion, brains were removed and dissected into multiple standardized blocks. The frontal block, containing all of Brodmann's area 46, and the occipital block, containing all of the primary visual cortex, were cut on a Vibratome. A systematic random series of 8-12 400 μm-thick sections, each spaced 2.6 mm apart, throughout each of areas 17 and 46 was obtained for intracellular injection of Lucifer yellow (Invitrogen). Intracellular injection of layer III pyramidal cells with Lucifer yellow was performed according to methods previously described (Hao et al., 2006; Dumitriu et al., 2011). Briefly, 400 μm sections were first stained with 4,6-diamidino-2-phenylindole (DAPI) to enable visualization of neuronal cell bodies and mounted on filter paper immersed in 0.1M PBS. Pyramidal cells in layer III of areas 17 and 46 were identified using epifluorescence under a UV filter, and the cell bodies were impaled with sharp micropipettes and filled with 5% Lucifer yellow in dH2O for five to ten minutes under a 1-10 nA direct current. Approximately 6-8 neurons were so loaded per section, sufficiently far apart to ensure no crossing of dendritic arbors. Sections containing loaded neurons were mounted on slides with VectaShield mounting medium (Vector Laboratories, Burlingame, CA).
Imaging
All filled neurons had somata located in layer III and within the boundaries of area 17 or area 46, as determined by analysis after counterstaining selected slices with DAPI. Neurons used for analysis had completely filled dendritic trees, as demonstrated by well-defined endings, and were located sufficiently far away from other loaded cells to unambiguously determine the origin of every dendritic segment. To minimize fading during imaging, segments were located using minimum laser power before being imaged at high power for the briefest time possible to achieve good signal quality, i.e., a gain of less than 750V being required to achieve dynamic range, in which there are only a few pixels of minimum and a few pixels of maximum signal intensity.
In order to ensure systematic-random sampling of dendritic segments, well-filled neurons were first imaged at low magnification, and concentric circles 60 and 120 μm in diameter (in area 46) or 50 and 100 μm in diameter (in area 17) were drawn around the cell body. Only dendritic segments intersecting these circles were used for high-magnification imaging and analysis. Six apical and six basal secondary or tertiary dendritic segments were imaged on each cell at these points of intersection. Each dendritic segment was imaged in a sequential z-stack using a Zeiss LSM 510 confocal microscope (Carl Zeiss, Oberkochen, Germany) using a Plan-Apochromat 100x 1.4 NA oil-immersion objective and an argon laser with excitation at 458nm. Stacks were acquired at a resolution of 0.07 × 0.07 × 0.07μm. Care was taken to completely image each dendritic segment, including a margin of whitespace on all sides. Image stacks were deconvolved with AutoDeblur (Media Cybernetics, Silver Spring, MD), and loaded into NeuronStudio software (Rodriguez et al., 2008) for automated measurement of spine length, head diameter, and head volume.
Spines were classified as “thin,” “mushroom,” or “stubby” based on previously published criteria (Dumitriu et al., 2010; Ohm et al., 2012). All spines lacking a detectable neck were classified as “stubby.” The spines with a detectable neck were run through a two-way cluster analysis directed to produce two groups on the basis of maximum spine head diameter alone. The cluster analysis determined a cutoff value of 0.4709 μm for the best fit within the two groups, very close to the value of 0.47 μm used in previous studies (Ohm et al., 2012). As there were no spines with measured maximum head diameters falling between 0.47 and 0.471 μm, spines with a neck were classified as “mushroom” if the maximum spine head diameter was ≥ 0.47 μm and “thin” if the maximum spine head diameter was < 0.47 μm.
Statistical analysis
All variables were normally distributed according to Shapiro-Wilk tests (p > 0.1 for all variables). Statistical analyses were performed using one-way ANOVA, followed by Bonferonni post hoc tests where appropriate, to assess possible differences in the various morphometric parameters between groups. All post hoc tests were adjusted for multiple comparisons. The values are shown as means ± SEM, calculated based on one aggregate (mean) value per animal. Observed power was calculated in all ANOVA to confirm that the sample size was sufficient to support the data. Two-tailed Pearson correlations were used to examine the relationships between morphological and behavioral metrics. The statistical significance level was set at p < 0.05.
Results
Behavior
As previously shown using some of the same monkeys included in the current study (Dumitriu et al., 2010), in this particular cohort of animals, there was no difference between the young and aged groups in the number of trials required to reach the criterion of 90% correct at 0 or 1 second delay or on percent correct selections with delay intervals of 5, 10, 15, 30, or 60 seconds on the DR test (Fig 1A). This was due in large part to several young animals, which were slow to acquire the task and performed more poorly across increasing retention intervals than expected for their age. Scores for the aged group, by comparison, were comparable to the impaired performance reported in earlier studies of aged rhesus monkeys (Rapp and Amaral, 1989; Rapp et al., 2003; Hara et al., 2012b).
Figure 1.
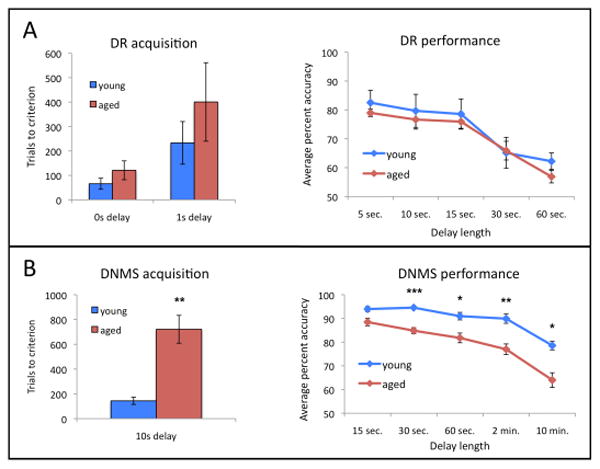
(A) In this cohort, there was no significant effect of age on the number of trials required to reach criterion on the DR task or on performance accuracy on DR at any delay tested. (B) Aged monkeys required a significantly higher number of trials to reach criterion on the DNMS task, and performed significantly less accurately than young animals at all delays tested. *p < 0.01, **p < 0.005, ***p < 0.0001.
The DNMS test is also used to measure age-related cognitive decline in nonhuman primates (Rapp et al., 2003). As previously reported (Hara et al., 2012), in this cohort, we did find the expected impairment in acquisition and performance of the DNMS task in the aged animals, with aged animals requiring more trials to reach the criterion of 90% correct with a 10 second delay interval and scoring significantly less accurately across longer delays than young animals (Fig 1B).
Spine density
In order to establish the morphological effects of aging on different brain regions, we compared the total spine density and measures of spine morphology between V1 and dlPFC in young and aged animals. We separated spines into groups of thin, mushroom, and stubby spines based on head diameter and on the presence or absence of a spine neck (see Methods). Numerical measures of spine density and morphology are summarized in Table 2.
Table 2.
Measurements of spine morphology from apical and basal trees of layer III pyramidal neurons in dlPFC and V1, broken down by spine type and animal age. Results are expressed as mean ± SEM.
| Spine Morphology Values | |||||||||
|---|---|---|---|---|---|---|---|---|---|
| dlPFC | V1 | ||||||||
| Both apical and basal segments | Both apical and basal segments | ||||||||
|
|
|||||||||
| Total | Thin | Mushroom | Stubby | Total | Thin | Mushroom | Stubby | ||
| Spine numbers | young | 6799 | 4536 (66.7%) | 1337 (19.7%) | 926 (13.6%) | 3340 | 2279 (68.2%) | 294 (8.8%) | 767 (23.0%) |
| (n) | aged | 7728 | 4493 (58.1%) | 1749 (22.6%) | 1486 (19.2%) | 3196 | 2180 (68.2% | 357 (11.2%) | 659 (20.6%) |
| Head diameter | young | 403 ± 8 | 365 ± 5 | 545 ± 4 | 392 ± 9 | 376 ± 5 | 366 ± 4 | 517 ± 6 | 352 ± 10 |
| (nm) | aged | 420 ± 5 | 382 ± 5 | 543 ± 4 | 388 ± 5 | 383 ± 4 | 371 ± 3 | 520 ± 4 | 348 ± 6 |
| Head volume | young | 0.106 ± 0.008 | 0.083 ± 0.004 | 0.200 ± 0.011 | 0.082 ± 0.007 | 0.062 ± 0.003 | 0.059 ± 0.002 | 0.124 ± 0.009 | 0.046 ± 0.003 |
| (um3) | aged | 0.110 ± 0.006 | 0.091 ± 0.005 | 0.185 ± 0.007 | 0.077 ± 0.003 | 0.070 ± 0.005 | 0.067 ± 0.004 | 0.129 ± 0.005 | 0.047 ± 0.004 |
| Spine length | young | 1481 ± 36 | 1570 ± 33 | 1703 ± 39 | 722 ± 20 | 1388 ± 55 | 1577 ± 50 | 1781 ± 32 | 675 ± 11 |
| (nm) | aged | 1336 ± 40 | 1452 ± 38 | 1599 ± 42 | 678 ± 20 | 1462 ± 51 | 1629 ± 57 | 1850 ± 72 | 700 ± 40 |
|
|
|||||||||
| Apical segments only | Apical segments only | ||||||||
|
|
|||||||||
| All spines | Thin | Mushroom | Stubby | All spines | Thin | Mushroom | Stubby | ||
|
|
|||||||||
| Spine numbers | young | 3145 | 2063 (65.6%) | 634 (20.2%) | 448 (14.2%) | 1568 | 1018 (64.9%) | 138 (8.8%) | 412 (26.3%) |
| (n) | aged | 3922 | 2248 (57.3%) | 903 (23.0%) | 771 (19.7%) | 1602 | 1045 (65.2%) | 185 (11.6%) | 372 (23.2%) |
| Head diameter | young | 406 ± 9 | 365 ± 5 | 550 ± 6 | 397 ± 9 | 377 ± 5 | 366 ± 3 | 513 ± 5 | 359 ± 8 |
| (nm) | aged | 421 ± 6 | 381 ± 6 | 541 ± 4 | 394 ± 6 | 381 ± 4 | 370 ± 3 | 521 ± 4 | 342 ± 6 |
| Head volume | young | 0.112 ± 0.010 | 0.086 ± 0.005 | 0.211 ± 0.015 | 0.090 ± 0.008 | 0.062 ± 0.002 | 0.060 ± 0.002 | 0.122 ± 0.007 | 0.049 ± 0.004 |
| (um3) | aged | 0.115 ± 0.007 | 0.094 ± 0.006 | 0.191 ± 0.010 | 0.084 ± 0.004 | 0.070 ± 0.005 | 0.069 ± 0.005 | 0.131 ± 0.005 | 0.044 ± 0.003 |
| Spine length | young | 1463 ± 37 | 1558 ± 32 | 1646 ± 44 | 755 ± 24 | 1359 ± 58 | 1558 ± 52 | 1824 ± 12 | 696 ± 38 |
| (nm) | aged | 1324 ± 46 | 1436 ± 41 | 1584 ± 47 | 703 ± 27 | 1437 ± 62 | 1640 ± 78 | 1777 ± 70 | 711 ± 40 |
|
|
|||||||||
| Basal segments only | Basal segments only | ||||||||
|
|
|||||||||
| All spines | Thin | Mushroom | Stubby | All spines | Thin | Mushroom | Stubby | ||
|
|
|||||||||
| Spine numbers | young | 3654 | 2473 (67.7%) | 703 (19.2%) | 478 (13.1%) | 1772 | 1261 (71.2%) | 156 (8.8%) | 355 (20.0%) |
| (n) | aged | 3806 | 2245 (59.0%) | 846 (22.2%) | 715 (18.8%) | 1594 | 1135 (71.2%) | 172 (10.8%) | 287 (18.0%) |
| Head diameter | young | 401 ± 7 | 365 ± 4 | 540 ± 4 | 388 ± 10 | 375 ± 6 | 366 ± 6 | 519 ± 7 | 344 ± 11 |
| (nm) | aged | 420 ± 4 | 384 ± 4 | 544 ± 4 | 382 ± 5 | 385 ± 4 | 372 ± 2 | 518 ± 4 | 357 ± 10 |
| Head volume | young | 0.101 ± 0.006 | 0.081 ± 0.004 | 0.190 ± 0.008 | 0.074 ± 0.007 | 0.061 ± 0.003 | 0.058 ± 0.001 | 0.126 ± 0.010 | 0.043 ± 0.004 |
| (um3) | aged | 0.105 ± 0.004 | 0.089 ± 0.004 | 0.178 ± 0.005 | 0.069 ± 0.002 | 0.070 ± 0.004 | 0.067 ± 0.003 | 0.126 ± 0.006 | 0.052 ± 0.007 |
| Spine length | young | 1498 ± 39 | 1582 ± 39 | 1760 ± 45 | 687 ± 23 | 1413 ± 55 | 1592 ± 50 | 1742 ± 49 | 633 ± 30 |
| (nm) | aged | 1342 ± 37 | 1464 ± 39 | 1607 ± 42 | 651 ± 14 | 1488 ± 53 | 1619 ± 48 | 1929 ± 92 | 706 ± 45 |
p < 0.01,
p < 0.001,
p < 0.0001.
Several studies have found that the total dendritic length of layer III pyramidal neurons in macaque neocortex does not change significantly with age (Duan et al., 2003; Kabaso et al., 2009), or, if any change is noted, that it is limited to a slight loss of length from some apical branches of the dendritic tree (Kabaso et al., 2009). As such, any finding of lower spine density in aged animals implies a significant decrease in the total number of spines per neuron.
As there was no significant difference within any animal in the density or morphology of any spine type between apical and basal branches in either area, all reported findings reflect data combined from spines on both arbors. To allow for direct comparison between areas, we replicated our previous study of dlPFC pyramidal neurons (Dumitriu et al., 2010) in different neurons from a mostly new set of animals, using the same parameters for imaging and analysis as for the V1 neurons. A representative image of a dendritic segment from each group is shown in figure 2. In young animals, total spine density in V1 was significantly lower than spine density in dlPFC (Fig 3A). This difference extended to the densities of both thin and mushroom spines (p = 0.03 and p = 0.002, respectively), while the density of stubby spines was the same on young layer III pyramidal neurons in the two areas (p > 0.5). In terms of the proportion of different spine types on each neuron, young V1 neurons had a significantly higher proportion of stubby spines (p = 0.002) and a lower proportion of mushroom spines (p = 0.01) than young dlPFC neurons, while the proportion of thin spines did not differ between the two areas (p > 0.7).
Figure 2.

Representative projections of z-stacks from analyzed dendritic segments in each group: (A) young dlPFC (B) young V1 (C) aged dlPFC (D) aged V1. Scale bar = 2μm.
Figure 3.
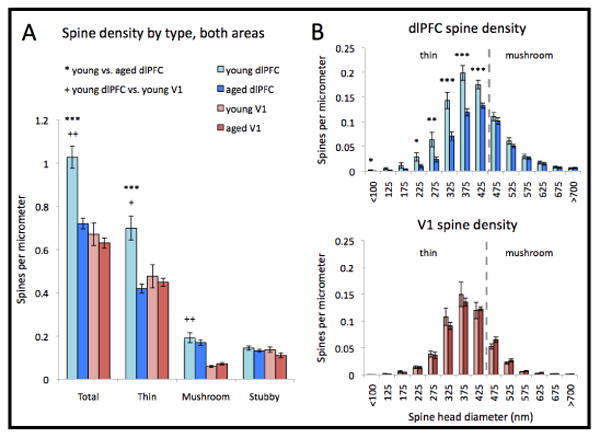
(A) Layer III pyramidal neurons in V1 have a lower total spine density, a lower proportion of mushroom spines, and a higher proportion of stubby spines than those in young dlPFC. There is no difference in the density of any spine type in V1 between aged and young animals. In dlPFC, however, there is a significant decrease in the density of thin spines with age, with no change in the density of mushroom or stubby spines. (B) In the dlPFC, the only spines lost with age are long, thin spines; i.e., non-stubby spines with head diameters below approximately 475nm. In V1, there is no change with aging of the density of non-stubby spines, irrespective of spine head diameter. *p < 0.05, **p < 0.005, ***p < 0.001; asterisks represent comparisons between young and aged dlPFC, crosses represent comparisons between young dlPFC and young V1.
Aging had different effects on spine density in V1 and dlPFC neurons. We found no age-related difference in total spine density or in the density of any type of spine on the apical or basal branches of layer III pyramidal neurons in V1 (Figure 3A; p > 0.1 for all comparisons). Total spine density on dlPFC neurons was 30% lower in aged than in young animals (p < 0.001; Fig 3A). The density of stubby spines did not change with age (p > 0.2). As shown in figure 3B, among non-stubby spines in the dlPFC, the decline in spine density occurred entirely among thin spines, i.e., those with a head diameter < 0.47 μm (p < 0.001), with no change in the density of spines with larger head diameters (p > 0.3 for mushroom spines).
Spine morphology
In young animals, the total average spine head diameter was significantly smaller in V1 than in dlPFC (p = 0.04). This was due to smaller head diameters among stubby and mushroom spines (p = 0.03 and p = 0.002, respectively), with thin spines having the same mean head diameter (p > 0.9; Figure 4A). There was no significant difference in the mean length of any type of spine between young V1 and young dlPFC (Figure 3B).
Figure 4.

(A) While the mean head diameter of all spines and of thin spines increased with age in dlPFC, there was no change with age in the mean head diameter of any type of spine in V1. In young animals, mean head diameters of mushroom and stubby spines were smaller in V1 than in dlPFC, though there was no difference in the mean head diameter of thin spines between the two areas. (B) The mean length of all spines and of thin spines decreased with age in dlPFC. There was no difference in mean spine length with age in V1 or between young V1 and the young dlPFC. (C) Larger mean spine head diameters among thin and mushroom spines in dlPFC correlated positively with the number of trials required to reach criterion on both the DR and DNMS tasks. *p < 0.05, **p < 0.005; asterisks represent significant difference from young dlPFC.
The total mean spine head diameter was significantly larger in aged than in young dlPFC (p = 0.05; Figure 4A). This was due to a larger mean head diameter of thin spines (p = 0.03), with no change in the mean head diameter of mushroom or stubby spines (p > 0.7 for both comparisons). The mean length of all spines in dlPFC was significantly reduced with age (p = 0.01; Figure 4B). This effect was significant for thin spines (p = 0.04), but not for mushroom spines (p = 0.1). By contrast, there was no change in the mean head diameter of all spines or of any spine type with age on pyramidal neurons in V1 (p > 0.3 for all comparisons).
These results suggest that the resilience of V1 to age-related decline is not simply due to a paucity of thin spines in this area. Additionally, the morphology of V1 thin spines is very similar to that of the young dlPFC. However, while the profile of thin spines in dlPFC changes toward larger head diameter and shorter spine length with aging, this effect was not observed among thin spines in V1, indicating that the vulnerability of thin spines to aging is not a property of thin spines per se but rather arises from their location within particular vulnerable circuits.
Behavioral correlations
We found that no morphological index measured in V1 correlated with any behavioral metric (p > 0.05 for all correlations). By contrast, in dlPFC, when spines were broken up by type, the percentage of spines that were classified as “thin” in a given animal correlated with fewer trials required to reach criterion on both the DR (r = -0.493; p = 0.04) and DNMS tasks (r = -0.583; p = 0.02; data not shown). The percentage of spines that were classified as “mushroom” correlated with a greater number of trials required to reach criterion on both the DR (r = 0.571; p = 0.02) and DNMS (r = 0.533; p = 0.03) tasks, while the percentage of spines classified as “stubby” did not correlate with acquisition on either task (p > 0.2). Combining these findings into one, we found that, among non-stubby spines, a smaller mean head diameter correlated with fewer trials to reach criterion on both the DR (r = 0.652; p = 0.005) and DNMS tasks (r = 0.569; p = 0.02; Figure 3C). No index from dlPFC correlated with delay performance on either task (p > 0.05 for all correlations).
Discussion
Methodological implications
These analyses were performed on pyramidal neurons that were stored at 4 degrees in phosphate buffered saline containing 0.1% sodium azide for several years prior to intracellular loading with Lucifer yellow and morphometric analyses. It is important to note that while absolute spine densities were lower in this study, we fully replicated our previous findings in area 46 regarding thin spine loss (Dumitriu et al, 2010) that were generated from completely different neurons in a subset of the animals included here. Thus, this study not only provides critical replication of a key finding regarding the synaptic basis of cognitive aging, but also demonstrates that we can return to tissue from valuable monkeys years later to perform important studies such as the analysis of V1, which is reported for the first time here.
It is also worth noting that our findings on V1 differ from a recent publication that reported an age-related decrease in mushroom spines on apical dendrites of layer III pyramidal neurons in area 46, along with a decrease in thin spines on basal dendrites (Luebke et al., 2013). This discrepancy likely results from the fact that very different preparations were used in the two studies, and there were minor differences in data acquisition and design as well. Luebke et al. used in vitro slices of rhesus monkey V1 to first obtain electrophysiological data from layer III pyramidal cells and intracellular injection of biocytin followed by immersion fixation at 4 degrees C, whereas we used LY injection into fixed V1 slices taken from monkeys that had been perfusion-fixed. It is well known that spine density in in vitro slice preparations can vary widely from spine number in perfusion fixed tissue, and this is highly dependent on the temperature of the slice preparation (Kirov et al., 2004; Bourne et al., 2007). In addition, different spine classes display different responses to temperature in immature vs adult slices (Kirov et al., 1999). The cold temperatures used to collect the slices and immersion fix the slices by Luebke et al. likely affected spine density, and it would not be surprising if aged spines were more susceptible to such effects than young adult spines. Additional minor factors that may have contributed to the discrepant results are that the current study included more dendritic segments per neuron and more neurons per animal than the previous study, the statistical analysis differed across the studies, and if unknown selection biases exist for neuronal inclusion, they likely differ when electrophysiological properties are the initial screen as opposed to successful visualization of intracellular Lucifer yellow.
Variations in age-related declines in cognitive performance
The results of this study are consistent with previous studies, using some of the same animals, in that the group of young animals in this study performed more poorly than expected for their age group on DR (Dumitriu et al., 2010; Hara et al., 2012). We found a change with age in the mean number of trials required to reach criterion and in the mean percent of correct responses across all delays on the DNMS task, but we did not find a change with age in mean acquisition or performance measures on the DR task, due to unusually poor performance of several young monkeys on DR. However, in our study, as expected, we found an increase in the variance in the aged group compared to the young group on both the number of trials required to reach criterion and overall percent accuracy on both the DR and DNMS tasks. Interestingly, we found that a higher proportion of thin spines was associated with fewer trials to criterion on the DR task, even without an overall age effect. Moreover, though the young group had fewer animals, a higher proportion of thin spines was associated with fewer trials to criterion on DR for young animals as well, suggesting that a high proportion of long, thin spines in the dlPFC may be important for fast DR acquisition at any age.
Functional correlates of spine type shifts
Spine size and shape have been linked to synaptic plasticity, spine stability, learning, and memory, particularly with respect to mushroom and thin spines (Matsuzaki et al., 2001; Grutzendler et al., 2002; Trachtenberg et al., 2002; Kasai et al., 2003, 2010a, 2010b; Zuo et al., 2005; Holtmaat et al., 2006; Bourne and Harris, 2007). Mushroom spines have an expanded head, are highly stable, AMPA receptor-dominated, and thought to transmit highly stable information, whereas thin spines are highly motile, expand and retract, and are NMDA receptor-dominated (Matsuzaki et al., 2001; Grutzendler et al., 2002; Trachtenberg et al., 2002; Kasai et al., 2003, 2010a, 2010b; Zuo et al., 2005; Holtmaat et al., 2006; Bourne and Harris, 2007). We have hypothesized that the unique cognitive functions mediated by dlPFC are likely to require particularly robust plasticity as mediated by thin spines (Hao et al, 2007; Dumitriu et al, 2010; Morrison and Baxter, 2012). This hypothesis is supported by the strong correlation between thin spines and cognitive performance mediated by dlPFC in rhesus monkeys (Dumitriu et al, 2010), and the proposed role of thin spines in mediating working memory (Wang et al., 2011). By extension, in the current study, we hypothesized that V1 and dlPFC would display divergent spine profiles by virtue of their divergent roles as a primary sensory area and a high level polymodal association region. This hypothesis was partially borne out, in that even though the relative proportion of total spines represented by the thin class was equivalent in V1 and dlPFC, there were far fewer thin spines in V1 than in dlPFC per unit dendrite, and this difference led to a large difference in overall spine density. In fact, the density of thin spines in young and aged V1 was equivalent to the density in aged dlPFC, which is far lower than the density in young dlPFC. These regional differences suggest that there may be multiple classes of thin spines that may vary in their stability, capacity for plasticity, and vulnerability to age. If such distinct classes of thin spines exist with respect to stability and plasticity, they likely have a distinct molecular phenotype as well, which may be evident with high resolution electron microscopic immunocytochemistry. We are currently pursuing such studies.
Spines on layer III pyradmidal neurons in V1 age differently from those in dlPFC
In this study, we confirmed our previous findings about aging in dlPFC using a fresh selection of tissue and twelve new monkeys not examined in Dumitriu et al., 2010. These experiments verified that thin spine density declines with age on layer III pyramidal neurons in the dlPFC, while the density of mushroom or stubby spines does not change with age. Aging also increased the average head diameter of dlPFC thin spines without altering the head diameter of mushroom or stubby spines. Further, comparing our morphological results to the behavioral data from these animals, we found that a larger proportion of spines with small head diameters correlated with fewer trials required to reach criterion on both the DR and DNMS tasks. This agrees with previous data linking thin spine density in the dlPFC to acquisition of the DNMS task in young and aged rhesus monkeys (Dumitriu et al., 2010).
Though thin spine density was dramatically reduced with age in the dlPFC, this effect was not present in primary visual cortex. Instead, we found that, while neurons in V1 tended to have lower total spine densities than neurons in dlPFC, V1 neurons had an equal or higher proportion of thin spines, and the mean head diameter of thin spines in V1 was equivalent to that in young dlPFC. Despite this preponderance of thin spines, aging did not affect the density or head diameter of any type of spine in V1. It is worth noting that this result may be specific to the area surrounding layer III; an age-related loss of layer I synapses in monkey V1 has been reported (Peters et al., 2001), and our sampling procedure systematically excludes layer I dendritic segments.
It is not clear why thin spines in V1 would be resistant to the morphological effects of aging. It is possible that this is the result of a floor effect, as V1 neurons from both young and aged animals had spine densities approximately equal to those seen in aged dlPFC. It is also possible that the loss of spines in dlPFC results from a change in inputs due to demyelination and deafferentation with age in this area, though many of these white matter alterations are also observed with age in V1 (Peters et al., 2000; Peters and Kemper, 2012). On the other hand, the relative resilience of V1 may be due to some intrinsic property of the V1 neurons. V1 neurons may be somewhat protected by their size and pattern of connectivity, as they have smaller dendritic arbors and less corticocortical connectivity than layer III dlPFC pyramidal neurons. Differential vulnerability may also be related to the activity of the circuits in which these neurons are embedded. Further analyses of the molecular characteristics of the thin spines in area 46 compared to V1 are needed to reveal synaptic attributes that might confer resilience on thin spines in V1 as compared to those in area 46. In addition, determining the morphological and molecular mechanisms underlying the selective vulnerability of dlPFC thin spines may offer important implications for treatments that preserve dlPFC-mediated cognitive functions in the aging population.
Conclusion
These results confirm prior findings (Peters et al., 2008; Dumitriu et al., 2010) that aging has a profound effect on dendritic spines in dlPFC, with aged animals having lower spine density and a smaller proportion of thin spines on both apical and basal dendritic trees than younger animals. In addition, we confirm previous findings (Dumitriu et al., 2010) that the proportion and size of thin spines in dlPFC correlates with the speed of DNMS task acquisition. Finally, we found that V1 pyramidal neurons, despite having a large proportion of thin spines, are largely impervious to the morphological effects of cognitive aging commonly seen in the dlPFC. Taken together, these experiments show that cognitive aging appears to reflect a selective loss of thin spines in the dlPFC in primates, with a primary sensory region such as V1 that is highly reliant on synaptic stability resilient to age-related loss of spines.
Table 1.
Age, sex, and behavioral data from all animals in the present study, with indication of which animals were used for dlPFC and/or V1 analysis.
| Cohort Composition | ||||||||
|---|---|---|---|---|---|---|---|---|
| Animal | Sex | Age Group | Age (years) | Trials to 10s Criterion (DNMS) | Mean % Correct (DNMS) | Trials to 1s Criterion (DR) | Mean % Correct (DR) | Areas Analyzed |
| 1* | f | young | 9.7 | 247 | 92.6 | 100 | 52.9 | PFC, V1 |
| 2* | f | young | 10.1 | 100 | 90.8 | 10 | 77.1 | PFC |
| 3 | f | young | 10.1 | 159 | 92.4 | 140 | 77.5 | PFC |
| 4 | f | young | 10.1 | 43 | 87.3 | 140 | 70.9 | PFC, V1 |
| 5 | f | young | 11.1 | 80 | 90.6 | 40 | 77.8 | PFC, V1 |
| 6 | f | young | 11.1 | 237 | 86.5 | 30 | 68.9 | PFC, V1 |
| 7* | m | young | 13.4 | 140 | 87.0 | 0 | 90.2 | PFC |
| 8* | f | aged | 22.8 | 654 | 73.7 | 20 | 69.8 | PFC |
| 9 | f | aged | 24.4 | n/a | n/a | 130 | 79.6 | PFC |
| 10 | f | aged | 24.8 | 551 | 87.0 | 80 | 71.1 | PFC, V1 |
| 11* | m | aged | 26.0 | 957 | 77.4 | 0 | 76.2 | PFC |
| 12 | f | aged | 26.1 | - | - | - | - | V1 |
| 13 | f | aged | 26.3 | 744 | 82.7 | 87 | 74.9 | PFC |
| 14 | f | aged | 26.6 | 1434 | 80.4 | 340 | 64.9 | PFC, V1 |
| 15 | f | aged | 27.0 | 406 | 79.5 | 341 | 64.3 | PFC, V1 |
| 16 | f | aged | 29.8 | 390 | 80.6 | 40 | 73.8 | PFC |
| 17 | f | aged | 32.5 | 456 | 79.2 | 110 | 71.8 | PFC |
| 18 | f | aged | 33.8 | 899 | 72.6 | 60 | 62.2 | PFC |
Asterisks represent animals from which dlPFC tissue was previously analyzed in Dumitriu et al., 2010.
Unlike neurons in dlPFC, neurons in V1 do not lose spines with age in rhesus monkeys
Aging decreases the proportion of thin spines in macaque dlPFC but not in V1
Smaller dlPFC mean spine head diameter correlates with fewer trials to criterion on DR and DNMS tasks
Acknowledgments
The authors thank William Janssen and Dr. Yuko Hara for their expert advice and assistance. This work is supported by AG016765, AG006647, and AG010606 to J.H.M. from the NIA, and in part by the Intramural Research Program of the NIA.
Footnotes
Conflicts of Interest: None
Publisher's Disclaimer: This is a PDF file of an unedited manuscript that has been accepted for publication. As a service to our customers we are providing this early version of the manuscript. The manuscript will undergo copyediting, typesetting, and review of the resulting proof before it is published in its final citable form. Please note that during the production process errors may be discovered which could affect the content, and all legal disclaimers that apply to the journal pertain.
References
- Amatrudo JM, Weaver CM, Crimins JL, Hof PR, Rosene DL, Luebke JI. Influence of highly distinctive structural properties on the excitability of pyramidal neurons in monkey visual and prefrontal cortices. J Neurosci. 2012;32:13644–13660. doi: 10.1523/JNEUROSCI.2581-12.2012. [DOI] [PMC free article] [PubMed] [Google Scholar]
- Arnsten A, Paspalas C, Gamo N, Yang Y, Wang M. Dynamic Network Connectivity: A new form of neuroplasticity. TINS. 2010;14:365–375. doi: 10.1016/j.tics.2010.05.003. [DOI] [PMC free article] [PubMed] [Google Scholar]
- Arnsten AFT, Wang MJ, Paspalas CD. Neuromodulation of thought: flexibilities and vulnerabilities in prefrontal cortical network synapses. Neuron. 2012;76:223–239. doi: 10.1016/j.neuron.2012.08.038. [DOI] [PMC free article] [PubMed] [Google Scholar]
- Bartus RT, Dean RL, Fleming DL. Aging in the rhesus monkey: effects on visual discrimination learning and reversal learning. J Gerontol. 1979;34:209–219. doi: 10.1093/geronj/34.2.209. [DOI] [PubMed] [Google Scholar]
- Benavides-Piccione R, Fernaud-Espinosa I, Robles V, Yuste R, Defelipe J. Age-based comparison of human dendritic spine structure using complete three-dimensional reconstructions. Cereb Cortex. 2013;23:1798–1810. doi: 10.1093/cercor/bhs154. [DOI] [PMC free article] [PubMed] [Google Scholar]
- Bourne JN, Kirov SA, Sora KE, Harris KM. Warmer preparation of hippocampal slices prevents synapse proliferation that might obscure LTP-related structural plasticity. Neuropharmacology. 2007;52:55–59. doi: 10.1016/j.neuropharm.2006.06.020. [DOI] [PubMed] [Google Scholar]
- Chang YM, Rosene DL, Killiany RJ, Mangiamele LA, Luebke JI. Increased action potential firing rates of layer 2/3 pyramidal cells in the prefrontal cortex are significantly related to cognitive performance in aged monkeys. Cereb Cortex. 2005;15:409–418. doi: 10.1093/cercor/bhh144. [DOI] [PubMed] [Google Scholar]
- Divac I, Warren JM. Delayed response by frontal monkeys in the Nencki testing situation. Neuropsychologia. 1971;9:209–217. doi: 10.1016/0028-3932(71)90045-5. [DOI] [PubMed] [Google Scholar]
- Duan H, Wearne SL, Rocher AB, Macedo A, Morrison JH, Hof PR. Age-related dendritic and spine changes in corticocortically projecting neurons in macaque monkeys. Cereb Cortex. 2003;13:950–961. doi: 10.1093/cercor/13.9.950. [DOI] [PubMed] [Google Scholar]
- Dumitriu D, Hao J, Hara Y, Kaufmann J, Janssen WG, Lou W, Rapp PR, Morrison J. Selective changes in thin spine density and morphology in monkey prefrontal cortex correlate with aging-related cognitive impairment. J Neurosci. 2010;30:7507–7515. doi: 10.1523/JNEUROSCI.6410-09.2010. [DOI] [PMC free article] [PubMed] [Google Scholar]
- Dumitriu D, Rodriguez A, Morrison J. High-throughput, detailed, cell-specific neuroanatomy of dendritic spines using microinjection and confocal microscopy. Nat Protocols. 2011;6:1391–1411. doi: 10.1038/nprot.2011.389. [DOI] [PMC free article] [PubMed] [Google Scholar]
- Elston GN. Cortex, Cognition and the Cell: New Insights into the Pyramidal Neuron and Prefrontal Function. Cereb Cortex. 2003;13:1124–1138. doi: 10.1093/cercor/bhg093. [DOI] [PubMed] [Google Scholar]
- Gilbert CD, Li W. Adult visual cortical plasticity. Neuron. 2012;75:250–264. doi: 10.1016/j.neuron.2012.06.030. [DOI] [PMC free article] [PubMed] [Google Scholar]
- Gross C, Weiskrantz L. Evidence for dissociation of impairment on auditory discrimination and delayed response following lateral frontal lesions in monkeys. Exper Neurol. 1962;476:453–476. doi: 10.1016/0014-4886(62)90057-2. [DOI] [PubMed] [Google Scholar]
- Grutzendler J, Kasthuri N, Gan WB. Long-term dendritic spine stability in the adult cortex. Nature. 2002;420:812–816. doi: 10.1038/nature01276. [DOI] [PubMed] [Google Scholar]
- Hao J, Rapp PR, Janssen WGM, Lou W, Lasley BL, Hof PR, Morrison JH. Interactive effects of age and estrogen on cognition and pyramidal neurons in monkey prefrontal cortex. PNAS. 2007;104:11465–11470. doi: 10.1073/pnas.0704757104. [DOI] [PMC free article] [PubMed] [Google Scholar]
- Hao J, Rapp PR, Leffler AE, Leffler SR, Janssen WG, Lou W, McKay H, Roberts JA, Wearne SL, Hof PR, Morrison J. Estrogen alters spine number and morphology in prefrontal cortex of aged female rhesus monkeys. J Neurosci. 2006;26:2571–2578. doi: 10.1523/JNEUROSCI.3440-05.2006. [DOI] [PMC free article] [PubMed] [Google Scholar]
- Hara Y, Punsoni M, Yuk F, Park C, Janssen WG, Rapp PR, Morrison J. Synaptic distributions of GluA2 and PKMζ in the monkey dentate gyrus and their relationships with aging and memory. J Neurosci. 2012;32:7336–7344. doi: 10.1523/JNEUROSCI.0605-12.2012. [DOI] [PMC free article] [PubMed] [Google Scholar]
- Holtmaat A, Wilbrecht L, Knott GW, Welker E, Svoboda K. Experience-dependent and cell-type-specific spine growth in the neocortex. Nature. 2006;441:979–983. doi: 10.1038/nature04783. [DOI] [PubMed] [Google Scholar]
- Kabaso D, Coskren PJ, Henry BI, Hof PR, Wearne SL. The electrotonic structure of pyramidal neurons contributing to prefrontal cortical circuits in macaque monkeys is significantly altered in aging. Cereb Cortex. 2009;19:2248–2268. doi: 10.1093/cercor/bhn242. [DOI] [PMC free article] [PubMed] [Google Scholar]
- Kasai H, Fukuda M, Watanabe S, Hayashi-Takagi A, Noguchi J. Structural dynamics of dendritic spines in memory and cognition. TINS. 2010a;33:121–129. doi: 10.1016/j.tins.2010.01.001. [DOI] [PubMed] [Google Scholar]
- Kasai H, Hayama T, Ishikawa M, Watanabe S, Yagishita S, Noguchi J. Learning rules and persistence of dendritic spines. Europ J Neurosci. 2010b;32:241–249. doi: 10.1111/j.1460-9568.2010.07344.x. [DOI] [PubMed] [Google Scholar]
- Kasai H, Matsuzaki M, Noguchi J, Yasumatsu N, Nakahara H. Structure-stability-function relationships of dendritic spines. TINS. 2003;6:360–368. doi: 10.1016/S0166-2236(03)00162-0. [DOI] [PubMed] [Google Scholar]
- Kirov SA, Petrak LJ, Fiala JC, Harris KM. Dendritic spines disappear with chilling but proliferate excessively upon rewarming of mature hippocampus. Neuroscience. 2004;127:69–80. doi: 10.1016/j.neuroscience.2004.04.053. [DOI] [PubMed] [Google Scholar]
- Kirov SA, Sorra KE, Karris KM. Slices have more synapses than perfusion-fixed hippocampus from both young and mature rats. J Neurosci. 1999;19:2876–2886. doi: 10.1523/JNEUROSCI.19-08-02876.1999. [DOI] [PMC free article] [PubMed] [Google Scholar]
- Landis SC, Amara SG, Asadullah K, Austin CP, Blumenstein R, Bradley EW, Crystal RG, Darnell RB, Ferrante RJ, Fillit H, Finkelstein R, Fisher M, Gendelman HE, Golub RM, Goudreau JL, Gross RA, Gubitz AK, Hesterlee SE, Howells DW, Huguenard J, Kelner K, Koroshetz W, Krainc D, Lazic SE, Levine MS, Macleod MR, McCall JM, Moxley RT, 3rd, Narasimhan K, Noble LJ, Perrin S, Porter JD, Steward O, Unger E, Utz U, Silberberg SD. A call for transparent reporting to optimize the predictive value of preclinical research. Nature. 2012;490:187–191. doi: 10.1038/nature11556. [DOI] [PMC free article] [PubMed] [Google Scholar]
- Luebke J, Barbas H, Peters A. Effects of normal aging on prefrontal area 46 in the rhesus monkey. Brain Res Rev. 2010;62:212–232. doi: 10.1016/j.brainresrev.2009.12.002. [DOI] [PMC free article] [PubMed] [Google Scholar]
- Luebke JI, Medalla M, Amatrudo JM, Weaver CM, Crimins JL, Hunt B, Hof PR, Peters A. Age-related changes to layer 3 pyramidal cells in the rhesus monkey visual cortex. Cereb Cortex. 2013 doi: 10.1093/cercor/bht336. [DOI] [PMC free article] [PubMed] [Google Scholar]
- Matsuzaki M, Ellis-Davies GC, Nemoto T, Miyashita Y, Iino M, Kasai H. Dendritic spine geometry is critical for AMPA receptor expression in hippocampal CA1 pyramidal neurons. Nat Neurosci. 2001;4:1086–1092. doi: 10.1038/nn736. [DOI] [PMC free article] [PubMed] [Google Scholar]
- Morrison JH, Baxter MG. The ageing cortical synapse: hallmarks and implications for cognitive decline. Nat Rev Neurosci. 2012;13:240–250. doi: 10.1038/nrn3200. [DOI] [PMC free article] [PubMed] [Google Scholar]
- Morrison JH, Hof PR. Life and Death of Neurons in the Aging Brain. Science. 1997;278:412–419. doi: 10.1126/science.278.5337.412. [DOI] [PubMed] [Google Scholar]
- Nagahara A, Bernot T, Tuszynski M. Age-related cognitive deficits in rhesus monkeys mirror human deficits on an automated test battery. Neurobiol Aging. 2010;31:1020–1031. doi: 10.1016/j.neurobiolaging.2008.07.007. [DOI] [PMC free article] [PubMed] [Google Scholar]
- Nimchinsky E, Sabatini B, Svoboda K. Structure and function of dendritic spines. Ann Rev Physiol. 2002;64:313–353. doi: 10.1146/annurev.physiol.64.081501.160008. [DOI] [PubMed] [Google Scholar]
- Ohm DT, Bloss EB, Janssen WG, Dietz KC, Wadsworth S, Lou W, Gee Na, Lasley BL, Rapp PR, Morrison JH. Clinically relevant hormone treatments fail to induce spinogenesis in prefrontal cortex of aged female rhesus monkeys. J Neurosci. 2012;32:11700–11705. doi: 10.1523/JNEUROSCI.1881-12.2012. [DOI] [PMC free article] [PubMed] [Google Scholar]
- Pakkenberg B, Gundersen HJ. Neocortical neuron number in humans: effect of sex and age. J Comp Neurol. 1997;384:312–320. [PubMed] [Google Scholar]
- Peters A, Kemper T. A review of the structural alterations in the cerebral hemispheres of the aging rhesus monkey. Neurobiol Aging. 2012;33:2357–2372. doi: 10.1016/j.neurobiolaging.2011.11.015. [DOI] [PMC free article] [PubMed] [Google Scholar]
- Peters A, Leahu D, Moss MB, McNally KJ. The effects of aging on area 46 of the frontal cortex of the rhesus monkey. Cereb Cortex. 1994;4:621–635. doi: 10.1093/cercor/4.6.621. [DOI] [PubMed] [Google Scholar]
- Peters A, Moss MB, Sethares C. The effects of aging on layer 1 of primary visual cortex in the rhesus monkey. Cereb Cortex. 2001;11:93–103. doi: 10.1093/cercor/11.2.93. [DOI] [PubMed] [Google Scholar]
- Peters A, Moss MB, Sethares C. Effects of aging on myelinated nerve fibers in monkey primary visual cortex. J Comp Neurol. 2000;419:364–376. doi: 10.1002/(sici)1096-9861(20000410)419:3<364::aid-cne8>3.0.co;2-r. [DOI] [PubMed] [Google Scholar]
- Peters A, Sethares C, Luebke JI. Synapses are lost during aging in the primate prefrontal cortex. Neuroscience. 2008;152:970–981. doi: 10.1016/j.neuroscience.2007.07.014. [DOI] [PMC free article] [PubMed] [Google Scholar]
- Peters A, Sethares C, Moss MB. The effects of aging on layer 1 in area 46 of prefrontal cortex in the rhesus monkey. Cereb Cortex. 1998;8:671–684. doi: 10.1093/cercor/8.8.671. [DOI] [PubMed] [Google Scholar]
- Rapp PR. Visual discrimination and reversal learning in the aged monkey (Macaca mulatta) Behav Neurosci. 1990;104:876–884. doi: 10.1037//0735-7044.104.6.876. [DOI] [PubMed] [Google Scholar]
- Rapp PR, Amaral DG. Evidence for task-dependent memory dysfunction in the aged monkey. J Neurosci. 1989;9:3568–3576. doi: 10.1523/JNEUROSCI.09-10-03568.1989. [DOI] [PMC free article] [PubMed] [Google Scholar]
- Rapp PR, Amaral DG. Recognition memory deficits in a subpopulation of aged monkeys resemble the effects of medial temporal lobe damage. Neurobiol Aging. 1991;12:481–486. doi: 10.1016/0197-4580(91)90077-w. [DOI] [PubMed] [Google Scholar]
- Rapp PR, Morrison J, Roberts JA. Cyclic estrogen replacement improves cognitive function in aged ovariectomized rhesus monkeys. J Neurosci. 2003;23:5708–5714. doi: 10.1523/JNEUROSCI.23-13-05708.2003. [DOI] [PMC free article] [PubMed] [Google Scholar]
- Roberts JA, Gilardi KV, Lasley B, Rapp PR. Reproductive senescence predicts cognitive decline in aged female monkeys. Neuroreport. 1997;8:2047–2051. doi: 10.1097/00001756-199705260-00048. [DOI] [PubMed] [Google Scholar]
- Rodriguez A, Ehlenberger DB, Dickstein DL, Hof PR, Wearne SL. Automated three-dimensional detection and shape classification of dendritic spines from fluorescence microscopy images. PloS One. 2008;3:e1997. doi: 10.1371/journal.pone.0001997. [DOI] [PMC free article] [PubMed] [Google Scholar]
- Shamy JL, Habeck C, Hof PR, Amaral DG, Fong SG, Buonocore MH, Stern Y, Barnes CA, Rapp PR. Volumetric correlates of spatiotemporal working and recognition memory impairment in aged rhesus monkeys. Cereb Cortex. 2011;21:1559–1573. doi: 10.1093/cercor/bhq210. [DOI] [PMC free article] [PubMed] [Google Scholar]
- Trachtenberg JT, Chen BE, Knott GW, Feng G, Sanes JR, Welker E, Svoboda K. Long-term in vivo imaging of experience-dependent synaptic plasticity in adult cortex. Nature. 2002;420:788–794. doi: 10.1038/nature01273. [DOI] [PubMed] [Google Scholar]
- Wang M, Gamo NJ, Yang Y, Jin LE, Wang XJ, Laubach M, Mazer JA, Lee D, Arnsten AF. Neuronal basis of age-related working memory decline. Nature. 2011;476:210–213. doi: 10.1038/nature10243. [DOI] [PMC free article] [PubMed] [Google Scholar]
- Yuste R. Dendritic spines and distributed circuits. Neuron. 2011;71:772–781. doi: 10.1016/j.neuron.2011.07.024. [DOI] [PMC free article] [PubMed] [Google Scholar]
- Zuo Y, Lin A, Chang P, Gan WB. Development of long-term dendritic spine stability in diverse regions of cerebral cortex. Neuron. 2005;46:181–189. doi: 10.1016/j.neuron.2005.04.001. [DOI] [PubMed] [Google Scholar]