

Abstract
Lead (Pb) is a heavy metal that is toxic to numerous physiological processes. Its use in industrial applications is widespread and results in an increased risk of human environmental exposure. The central nervous system (CNS) is most sensitive to Pb exposure during early development due to rapid cell proliferation and migration, axonal growth, and synaptogenesis. One of the key components of CNS development is the Gamma-aminobutyric acid (GABA)ergic system. GABA is the primary inhibitory neurotransmitter in the adult brain. However, during development GABA acts as an excitatory neurotrophic factor which contributes to these cellular processes. Multiple studies report effects of Pb on GABA in the mature brain; however, little is known regarding the adverse effects of Pb exposure on the GABAergic system during embryonic development. To characterize the effects of Pb on the GABAergic system during development, zebrafish embryos were exposed to 10, 50, or 100 ppb Pb or a control treatment. Tissue up-take, gross morphological alterations, gene expression, and neurotransmitter levels were analyzed. Analysis revealed that alterations in gene expression throughout the GABAergic system and GABA levels were dose and developmental time point specific. These data provide a framework for further analysis of the effects of Pb on the GABAergic system during the excitatory phase and as GABA transitions to an inhibitory neurotransmitter during development.
Keywords: developmental toxicity, GABA, gene expression, lead, neurotoxicity, zebrafish
1.0 Introduction
Lead (Pb) is a toxic heavy metal that induces numerous and wide-ranging adverse health effects that are dose-dependent. Pb targets multiple organ systems; however, the developing central nervous system (CNS) is particularly vulnerable. Susceptibility to the effects of Pb toxicity is increased in children in comparison to adults due to an increase in hand to mouth activity and intestinal absorption, and the rapid development of the CNS (Needleman, 2004). The reference blood lead level (BLL) was revised by the Centers of Disease Control and Prevention (CDC) in January of 2012 from 10 μg/dL to 5 μg/dL (CDC.gov). This revised value is based on evidence that low dose Pb exposure causes neurodevelopmental alterations in children (Canfield et al., 2003; Lanphear et al., 2000, 2005). Pb neurotoxicity has been investigated in numerous studies and is caused by a variety of mechanisms including the disruption of neurotransmitter systems (Fortune et al., 2009; Neal et al., 2010).
γ-aminobutaryic acid (GABA) is the primary inhibitory neurotransmitter in the adult CNS. However, during early CNS development, GABA functions as an excitatory neurotrophic factor. It is this excitatory action that allows GABA to have a predominate role in cell proliferation, neuronal migration, neurite growth, axonal growth, and synaptogenesis (Zhang et al., 2010). The GABAergic system is comprised of multiple components that are functionally regulated by a subset of genes. These genes include but are not limited to GABA synthesizers, transporters, and receptors. Studies investigating the effects of Pb exposure on the GABAergic system began during the late 1970's and early 1980's. However, much attention was focused on adult Pb exposure and was performed on adult male rats. Studies that were conducted varied in dose and exposure time; however, changes in the GABAergic system were evident. These results demonstrated Pb's ability to decrease glutamic acid decarboxylase (GAD) protein along with a parallel increase in GABA and GABA-T, perhaps as a potential compensatory mechanism for the increase in GABA (Strużyńska et al., 2004). It has also been demonstrated that Pb has an effect on the GABA receptors through channel modification. Pb has the ability to reduce binding affinity and capacity (Waśkiewicz, 1996). A study proposed that the response of the GABAergic system due to Pb exposure exhibits a non-monotonic or U-shaped dose response (Lasley et al., 2002).
There are few studies that aim to investigate the effects of Pb on the GABAergic system specifically during development. One study exposed pregnant female Sprague-Dawley rats beginning 13-15 days after impregnation and continued exposing their pups to 13.18 or 26.36 mM Pb acetate in their drinking water for thirty days. This study demonstrated a dose-response with an increase in Pb exposure causing a decrease in GABA levels and an increase in GAD in these rat pups (Silbergeld et al., 1979). A second study performed by Silbergeld and colleagues, exposed female Sprague-Dawley rats beginning on approximately their fourteenth day of gestation and their pups following birth to 26.36 mM Pb acetate in their drinking water for 45-60 days. The developmental exposure to Pb caused a decrease in GABA, an increase in GAD, a decrease in GABA uptake, and a decrease in GABA receptor binding (Silbergeld et al., 1980). A study in which pregnant Sprague-Dawley rats and their pups were exposed to 18.3 mM Pb acetate in their drinking water from gestational through post-natal brain development indicates that Pb exposure can alter GABA receptor binding and density at varying developmental time points (Drew et al., 1990). It is important to remember that in all aforementioned studies, samples were taken from rodents when GABA was inhibitory in nature as the excitatory function of GABA ceases at approximately postnatal day 7 (Marty et al., 2000). Therefore, the actions of Pb on the GABAergic system during its excitatory period are virtually unexplored and are the focus of the current investigation.
The zebrafish is becoming an increasingly popular model in developmental neurotoxicity studies (e.g., Chen et al., 2012; Peterson et al., 2011, 2013; Rice et al., 2011; Zhang et al., 2011). There are considerable strengths in utilizing the zebrafish model to assess developmental neurotoxicity including ex utero embryonic development, high fecundity rate therefore increasing sample size and biological replicates, a transparent chorion allowing for easy observation of gross morphological changes, and a fully sequenced genome which exhibits high homology to humans (Barbazuk et al., 2000; de Esch et al., 2012; Howe et al., 2013). The zebrafish also exhibits brain regions that are structurally homologous to humans which include the hypothalamus, optic tracts, olfactory system, and spinal cord. Additionally, the cerebellum of the zebrafish is similar to the cerebellar cortex in humans due to the similar cellular layers (molecular, Purkinje, and granule) and neurons (GABAergic and glutamatergic) (Bae et al., 2009). Along with the conserved structures between zebrafish and humans, zebrafish also express similar neurotransmitters but with some differences in expression and distribution patterns (de Esch et al., 2012).
In zebrafish, GABA is also an excitatory neurotrophic factor during early development of the CNS. GABA exerts it excitatory function as the primary source of neural activity and is reported to make its excitatory-inhibitory switch at approximately 60 hours post fertilization (hpf) (Reynolds et al., 2008; Zhang et al., 2010). GAD is the rate limiting enzyme that is responsible for the synthesis of GABA. There are two isoforms of this enzyme; GAD65 and GAD67. In zebrafish these two GAD isoforms are generated by the genes gad2 and gad1b, respectively. The two most predominate GABA receptors are the GABAA and GABAB receptors. Each receptor is composed of multiple subunits. These two receptors each contain critical subunits which are responsible for high ligand binding affinity. These are the alpha1 and R1 subunit within the GABAA and GABAB receptors, respectively. In zebrafish the genes that produce these subunits are gabra1 and gabbr1a, respectively (Jelitai et al., 2005). The last group of genes selected for analysis is the three primary GABA transporters: gat-1, gat-3, and vgat. These three genes are responsible for encoding the proteins for the GAT-1, GAT-3, and VGAT transporters. GABA transporters are responsible for the high affinity Na+/Cl- dependent uptake of GABA into presynaptic neurons and glial cells as well as the release GABA into extracellular spaces (Minelli et al., 1995).
Multiple studies are completed addressing the effects of developmental Pb exposure in zebrafish. Our laboratory reported neuronal and genetic alterations associated with a developmental Pb exposure in the zebrafish (Peterson et al., 2011, 2013; Zhang et al., 2011). Following an acute toxicity test, the highest dose used for global gene analysis was 100 ppb. This dose was well below a dose that caused overt toxicity and did not cause an increase in mortality, alterations in hatching rate, an increase in gross malformations, or an increase in apoptotic cells (Peterson et al., 2011, 2013). From this study 55 genes involved in neurological development (synaptic transmission, long-term potentiation, guidance of axons, and branching of neurites) and function were identified to be altered at 72 hpf following the embryonic 100 ppb Pb exposure (Peterson et al., 2011). An additional study in our laboratory determined that developmental Pb exposure causes a decrease in axonal density at 18, 20, and 24 hpf in the mid and forebrain (Zhang et al., 2011). Genetic analysis was performed on genes associated with axonogenesis and corresponding decreases reported in sonic hedgehog a (shha) and ephrin type-A receptor 4b (epha4b) (Zhang et al., 2011). It was also shown that exposure to 100 ppb Pb caused a decrease in reln expression at 60 hpf in developing zebrafish (Peterson et al., 2013). A primary goal of defining genetic alterations caused by toxicant exposure is the ability to link the genetic alteration to phenotypic and behavioral changes. Indeed, other laboratories are reporting behavioral changes caused by a developmental Pb exposure including hyperactivity in the zebrafish as seen by hyper-swimming at levels as low as 25 ppb (Chen et al., 2012). In addition, behavioral changes were observed in response to a tap stimulus on zebrafish aged 7 days exposed to 10 or 30 nM Pb chloride through 24 hpf (Rice et al., 2011).
To further our understanding on the genetic mechanisms of developmental Pb neurotoxicity on the GABAergic system, it is hypothesized that low dose developmental Pb exposure will alter the genetic expression of targeted GABAergic genes and GABA levels during GABAs excitatory period. To test this hypothesis, the expression of seven target GABAergic genes (gad2, gad1b, gabra1, gabbr1a, gat-1, gat-3, vgat) were assessed at four developmental time points during zebrafish embryogenesis (24, 48, 60, and 72 hpf) following exposure to 10, 50, or 100 ppb Pb or to a control treatment (concentrations previously used in experiments in our laboratory; Peterson et al., 2011, 2013; Zhang et al., 2011). These four developmental stages were chosen based on specific developmental events occurring at these time points. At 24 hpf primary neurogenesis occurs with the first differentiated neurons developing along with the early axonal scaffolding (Mueller et al., 2005). At 48 hpf secondary neurogenesis occurs in which axons grow at a high rate along with an abundance of cellular proliferation and migration. 60 hpf was selected due to association with the transition period of GABA from excitatory to inhibitory in the zebrafish (Zhang et al., 2010). The final developmental time point of 72 hpf signifies the completion of embryogenesis as well as the beginning of neurons releasing neurotransmitters (Kimmel et al., 1995; Mueller et al., 2006). Tissue uptake, morphology, and GABA levels were also assessed and linked to the gene expression changes observed at the different developmental time points.
2.0 Materials and Methods
2.1 Zebrafish husbandry
Zebrafish (Danio rerio) wild-type AB strain were housed in a Z-mod system (Aquatic Habitats, Apopka, FL) on a 14:10 hour light:dark cycle. Water quality was maintained at 28°C, pH of 7.0-7.2, and conductivity range of 470-550 μS. Adult fish were bred in cages and embryos were collected and staged following established protocols (Westerfield, 2007). Based on previous studies from our laboratory (Peterson et al., 2011, 2013; Zhang et al., 2011) and the new blood lead reference value (5 μg/dL or 50 ppb) as stated from the CDC, zebrafish embryos were treated with 10, 50, or 100 ppb Pb (Pb acetate, Sigma, St. Louis, MO) or a control treatment (fish water) beginning at 1 hpf. Embryos/larvae were collected at numerous developmental stages ranging from 24 to 72 hpf for experimental procedures. The highest treatment concentration of 100 ppb is 50 times below that which caused mortality and alterations in hatching (Peterson et al., 2011). All protocols were approved by Purdue University's Institutional Animal Care and Use Committee with all fish treated humanely and with regard for alleviation of suffering.
2.2 Morphological assessment following developmental Pb exposure
Zebrafish embryos were dosed with 10, 50, or 100 ppb Pb or a control treatment from 1 to 72 hpf in groups of 50 in a petri dish. Upon completion of exposure at 72 hpf, embryos were washed with system water and collected for analysis. Twenty larvae from each dish (considered subsamples) were analyzed with light microscopy using a Nikon SMZ1500 dissecting microscope with NIS Elements imaging software (Melville, NY) to attain head length, head width, and total larvae length (measured snout to tail). This analysis was repeated with two more clutches to result in three biological replicates (n=3).
2.3 Inductively coupled plasma-mass spectrometry (ICP-MS)
Zebrafish embryos were dosed with 10, 50, or 100 ppb Pb or a control treatment in groups of 50 embryos per petri dish shortly after fertilization. Larvae in each dish were collected at 72 hpf, pooled, washed, weighed, and digested for Pb analysis by ICP-MS (ELEMENT-2, ThermoFinnigan, Bremen, Germany). Four biological replicates were completed per treatment (n=4). The digestion procedure was performed by digesting the larvae overnight in 200 μL 50% nitric acid (HNO3) in a 65°C water bath. Samples were diluted with deionized water to a final 1% HNO3 concentration. Lead standard (ULTRA Scientific, North Kingstown, RI) was used as an internal standard. The concentration of Pb in zebrafish tissue was calculated in ng/g as previously described (Zhang et al., 2011).
2.4 Quantitative Polymerase Chain Reaction (qPCR)
Similar to above, 50 zebrafish embryos were exposed to a 0, 10, 50, or 100 ppb Pb treatment beginning at 1 hpf in petri dishes and collected at four developmental time points: 24, 48, 60, or 72 hpf. At each developmental time point, embryos/larvae in a petri dish were pooled and homogenized in TRIzol (Life Technologies, Carlsbad, CA) and flash frozen in liquid nitrogen. Four to six biological replicates were completed (n=4-6) per time point. Samples were stored at -80°C until total RNA isolation and cDNA synthesis was performed as described in Peterson and Freeman (2009). qPCR was performed on seven target genes: gad2, gad1b, gabra1, gabbr1a, gat-1, gat-3, and vgat. Gene expression was normalized to gapdh. Several housekeeping genes were assessed for lack of change following Pb exposure and gapdh was found to be most consistent. Probes specific to gene targets were designed using the Primer3 Website (Table 1). qPCR was performed following similar methods as described previously (Peterson et al., 2011; Zhang et al., 2011) following MIQE guidelines. The BioRad CFX Connect™ Real Time PCR Detection System was used with the SSOAdvance SYBR Green Supermix according to manufacturer recommendations (Bio-Rad, Hercules, CA).
Table 1. qPCR Primer Sequences.
| Gene Name | Primer Sequence | GenBank ID |
|---|---|---|
| gad2 | Forward: CAA GAA GCA TGA CGT CTG GA Reverse: CTG CAT CAG TCC CTC CTC TC |
NM_001017708.2 |
| gad1b | Forward: GCC CCA GCA CAC TAA TGT TT Reverse: GAG ACC ACC ATT CGG AAG AA |
NM_194419.1 |
| gabra1 | Forward: TAA GCT GCG CTC TTC TCC TC Reverse: CGC ACG GAT GTG TAT TTT TG |
NM_001077326.1 |
| gabbr1a | Forward: GTT CAC GTA TGG CCT GGA CT Reverse: TGA ATG AGA GGC AGA CGA TG |
XM_689405.4 |
| gat-1 | Forward: CAT CAC AAA GAG ACC CAT TGA A Reverse: AGC ATC ATG AGC ATT GAG AAG A |
NM_001007362.1 |
| gat-3 | Forward: TCG CTT CTT TAA ATT GCT CAC A Reverse: GTT ATA TCA GCC TGC TGG TTC C |
NM_001098387.1 |
| vgat | Forward: GCC ACT ACC GTC ACC AAT AAG T Reverse: CCT GTG GTC ATA GTC CAG ATC A |
NM_001080701.1 |
| gapdh | Forward: TCT GAC AGT CCG TCT TGA GAA A Reverse: ACA AAG TGA TCG TTG AGA GCA A |
NM_001115114.1 |
2.5 High Performance Liquid Chromatography (HPLC) with electrochemical detection
GABA analysis on zebrafish was conducted similar to previously reported by our group (Milanese et al., 2012). Groups of zebrafish embryos were exposed to a Pb treatment (10, 50, 100 ppb) or a control treatment beginning at 1 hpf in petri dishes. At 48 and 72 hpf 30 zebrafish embryos/larvae were collected, pooled, and submerged in 500 μL of 0.4M perchloric acid (HClO4). Samples were then sonicated (Power 40%, Pulse 2 seconds and stop for 1 second; Fisher Scientific, Model FB120, 120W) for 45 seconds per sample and centrifuged at 16,000 rcf for 35 minutes at 4°C. The supernatant was then placed in a 0.22 μM Spin-X tube (Bio-Rad) and centrifuged at 1,000 rcf for 15 minutes at 4°C. The lysate was stored at -80°C until HPLC analysis. Samples were combined with a derivatization agent (o-Phthalaldehyde, methanol, and 2-Mercaptoethanol) and injected with the sample at 4°C. The HPLC isocratic mobile phase consisted of disodium hydrogen phosphate anhydrous, water, 22% methanol, 3.5% acetonitrile, pH 6.75. The flow rate was 0.450 mL/min. Neurotransmitters were separated on a MD-150 column with a 3.2 internal diameter and a 3 μm particle size and detected on an UltiMate 3000 HPLC system (ThermoScientific). Electrochemical potential of cells 1 and 2 were 150 and 550 mV, respectively. Neurotransmitter separation and detection occurred at 40 °C with a sample time of 40 minutes. Neurotransmitter levels were quantified using a standard curve generated by high purity standards. Neurotransmitter amounts were reported as ng/zebrafish. Six biological replicates were completed (n=6).
2.6 Statistical analysis
For the morphological alterations, tissue up-take analysis, qPCR, and HPLC data, Pb treatments and the control treatment were analyzed for statistical differences with a one-way Analysis of Variance (ANOVA). A post hoc least significant difference (LSD) test was completed when a significant ANOVA was observed (p<0.05) to determine groups that were significantly different from each other.
3.0 Results
3.1 Morphological assessment of zebrafish exposed to Pb during embryogenesis
In order to test whether a developmental Pb exposure at 10, 50, or 100 ppb resulted in morphological alterations, zebrafish embryos were exposed to a control or the Pb treatments from 1-72 hpf (completion of embryogenesis). Three biological replicates of 20 subsamples each were collected, imaged, and specific developmental endpoints including head length, head width, and total larval length measured. There were no significant difference in any of the developmental measurements (head length: p=0.222; head width: p=0.11; total larval length: p=0.111) (Table 2).
Table 2. Morphological analysis at 72 hpf.
| Treatment | Head Length (μm)a | Head Width (μm)a | Total Body Length (μm)a |
|---|---|---|---|
| Control | 633.59 ± 22.59 | 583.53 ± 26.33 | 3618.87 ± 113.55 |
| 10 ppb | 646.90 ± 38.20 | 593.32 ± 21.39 | 3592.18 ± 104.98 |
| 50 ppb | 636.85 ± 37.46 | 598.54 ± 22.59 | 3604.07 ± 128.46 |
| 100 ppb | 643.01 ± 30.12 | 597.02 ± 29.19 | 3637.75 ± 131.78 |
Data are representative of three biological replicates of 20 subsamples ± standard deviation
3.2 Dose-response absorption of Pb in zebrafish larvae
In order to identify a relationship between Pb exposure and tissue up-take, ICP-MS was utilized to measure the amount of Pb in the zebrafish larvae at the end of embryogenesis (72 hpf). Tissue uptake of Pb exhibited a significant dose-response increase (p<0.0001) with each concentration statistically different from each other (Fig. 1). Pb was undetectable in control samples. Pb levels in tissues from zebrafish in the 10 ppb treatment were 295.61 ± 236.38 ng/g, in the 50 ppb treatment were 611.52 ± 204.38 ng/g, and in the 100 ppb treatment were 1139.49 ± 217.07 ng/g.
Fig. 1. Pb absorption in zebrafish tissue after embryonic exposure.

Pb concentration in zebrafish tissue after exposure through 72 hpf to 0 (ND), 10 (295.61 ± 236.38 ng/g), 50 (611.52 ± 204.38 ng/g), or 100 (1139.49 ± 217.07 ng/g) ppb. Pb was undetectable in the control samples and significantly increased in a dose-response manner among the increasing Pb treatments (p<0.0001). (n=4; Different letters indicate that concentrations are significantly different from each other; Error bars depict standard deviation)
3.3 GABA gene expression alterations following an embryonic Pb exposure
To investigate gene expression alterations induced by a developmental Pb exposure during embryogenesis, qPCR was performed on seven target genes (gad2, gad1b, gabra1, gabbr1a, gat-1, gat-3, and vgat) associated with the GABAergic pathway. Analysis was conducted at four developmental time points (24, 48, 60, and 72 hpf) on embryos exposed to 0, 10, 50, or 100 ppb Pb.
At 24 hpf, significant alterations occurred in each of the selected pathways encompassing five out of the seven target genes studied. Gene expression patterns were similar for both GABA synthesizers (gad2 and gad1b), which were significantly increased at 50 ppb Pb (p=0.0143 and p=0.0025, respectively). Gene expression alterations occurred in the GABA transporter gabbr1a with a significant decrease at 10 and 100 ppb Pb (p=0.0081). No significant changes occurred with the expression of gabra1 (p=0.12). The GABA transporter gat-1 had a strong dose-response with significant reduction in each of the three Pb concentrations (p=0.0091). Gene expression alterations for gat-3 showed a significant decrease at the 10 ppb Pb exposure (p=0.02). No significant changes occurred with the expression of vgat (p=0.144) (Fig. 2a).
Fig. 2. GABA gene expression alterations following an embryonic Pb exposure.
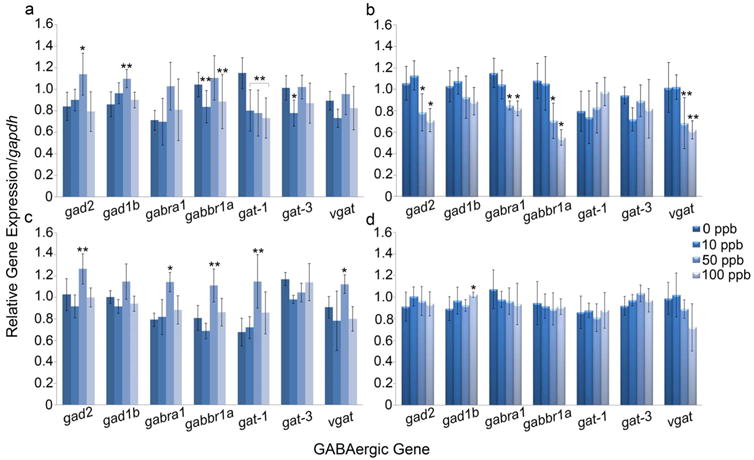
Results show the relative quantity of gene expression of all seven target genes at 24 (a), 48 (b), 60 (c), and 72 (d) hpf which were quantitatively compared between control embryos and those exposed to 10, 50, or 100 ppb Pb. Gene expression was normalized to gapdh. Pb exposure of 50 and 100 ppb caused the most significant alterations in gene expression at 24, 48, and 60 hpf. Minimal alterations occurred in gene expression at 72 hpf which agreed with our previous study (Peterson et al., 2011). (n=5-6; *p<0.05 **p<0.01; Error bars depict standard deviation)
At 48 hpf, alterations in gene expression demonstrated the most traditional dose-response in four out of the seven genes studied (Fig. 2b). Gene expression patterns were similar for gad2 and gad1b, but a significant decrease was only observed for gad2 at 50 and 100 ppb (p=0.0007). Results for gabra1 and gabbr1a also showed a significant decrease in gene expression in the 50 and 100 ppb treatments (p=0.0002 and p=0.0018, respectively). A significant decrease was also seen in vgat at 50 and 100 ppb Pb (p=0.0011). There was no significant change in expression of gat-1 (p=0.53) or gat-3 (p=0.13).
Gene expression patterns at 60 hpf showed a non-traditional dose-response (Fig. 2c). The expression of gad2 and gad1b were similar; however, only a significant increase in gad2 occurred at 50 ppb Pb (p=0.0018). Alterations in the GABA receptors, gabra1 and gabbr1a, exhibited an increase in expression at 50 ppb Pb (p=0.015 and p=0.004, respectively) with no changes occurring at the 10 or 100 ppb Pb treatment. The GABA transporters gat-1 and vgat showed similar results as the GABA receptors (gabra1 and gabbr1a) with an increase in gene expression at 50 ppb Pb (p=0.0056 and p=0.0355, respectively). No significant change occurred in the expression of gat-3 (p=0.2858).
There were minimal changes in gene expression at the end of embryogenesis (72 hpf; Fig. 2d). No significant alterations occurred in gad2 (p=0.49); however, alterations in gad1b gene expression was significantly increased at 100 ppb Pb (p=0.0404). No significant changes in gene expression of the GABA receptors (gabra1 and gabbr1a) occurred (p=0.47 and p=0.159, respectively) nor in the three GABA transporters (gat-1, gat-3, vgat) (p=0.8801, p=0.2048, and p=0.12, respectively).
3.4 Alteration in GABA levels following embryonic Pb exposure
To investigate the alterations in GABA levels followed by a developmental Pb exposure, HPLC was performed at 48 and 72 hpf. At 48 hpf, an increase in GABA levels occurred in the 10 ppb (88.43 ± 3.32 ng/fish) and 50 ppb (103.87 ± 8.18 ng/fish) treatments as compared to the control group (78.31 ± 2.26) (p=0.0001; Fig. 3a). The 100 ppb Pb treatment group (83.14 ± 4.72) was not statistically different from the control group; however, an increasing trend was noted. Analysis at the 72 hpf developmental time point revealed a significant decrease in GABA levels in all three Pb treatments (p=0.0002; Fig. 3b). As compared to the control treatment (99.17 ± 6.54 ng/fish), the greatest reduction in GABA levels occurred in the 10 ppb Pb treatment (74.86 ± 5.00 ng/fish) followed by the 100 ppb (78.12 ± 4.69 ng/fish) and 50 ppb treatments (83.18 ± 8.17 ng/fish).
Fig. 3. Alteration in GABA levels following embryonic Pb exposure.
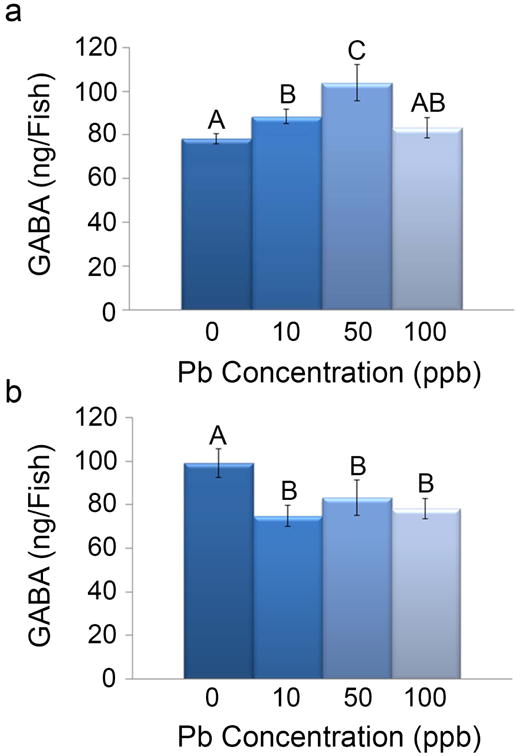
At 48 hpf (a), GABA levels were significantly different among the treatments (p<0.05). GABA levels in zebrafish in the control treatment were 78.31 ± 2.26 ng/fish and significantly increased in the 10 ppb treatment (88.43 ± 3.32 ng/fish). GABA levels in the 50 ppb treatment were 103.87 ± 8.18 ng/fish and were significantly increased compared to the control and the other Pb treatments. GABA levels in the 100 ppb treatment were not significantly different from the control treatment (83.14 ± 4.76 ng/fish). At 72 hpf (b), GABA levels in zebrafish in the control treatment were 79.17 ± 6.54 ng/fish. A significant decrease in GABA levels in all three Pb treatments was observed (p<0.05; 10 ppb: 74.86 ± 5.00 ng/fish, 50 ppb: 83.18 ± 8.17 ng/fish, and 100 ppb: 78.12 ± 4.69 ng/fish). (n=5; Different letters indicate Pb treatments that are significantly different from each other; Error bars depict standard deviation)
4.0 Discussion
Developmental and childhood Pb exposure poses a significant health risk due to the vulnerability of the developing CNS and its abundance of cellular processes. While many studies have investigated developmental Pb neurotoxicity, the mechanisms of toxicity are not yet completely understood. In previous studies in our laboratory, we reported that exposure to the highest Pb treatment used in the current study (100 ppb) did not result in overt toxicity and had no effects on mortality, hatching rate, or apoptosis (Peterson et al., 2011, 2013), but we did find that this exposure level resulted in a decrease in axonal density (Zhang et al., 2011). The morphological assessments in the current study found no significant differences in head length, head width, or total larval length and further define the toxicity of these Pb concentrations in the zebrafish model system.
ICP-MS analysis revealed a dose-response relationship between an increase in Pb concentration and tissue up-take in zebrafish larvae. These results extended our previous investigations (Zhang et al., 2011) by expanding the exposure period to the end of embryogenesis and with the addition of lower Pb treatments (10 and 50 ppb) to provide a more complete analysis of dose throughout embryogenesis for these three Pb treatments.
Overall gene expression analysis revealed that alterations were dose and time point specific. Specifically, gene expression analysis at 24 hpf exhibited an increase in expression of both gad2 and gad1b at the 50 ppb Pb treatment along with a decrease in gat-1 at the 10, 50, and 100 ppb Pb treatment. An increase in the expression of the GABA synthesizing genes might be expected to result in an increase in the expression of the genes responsible for the removal of GABA; however, this was not observed. Regarding GABA levels at this developmental time point, it can be hypothesized that there would be a potential decrease in GABA levels at this time (Silbergeld et al., 1979, 1980; Drew et al., 1990) causing the observed decrease in GABA uptake, but the up-regulation of gad2 and gad1b at 50 ppb is an attempt to return GABA levels back to baseline.
Gene expression analysis at 48 hpf exhibited the most traditional dose-response across the 50 and 100 ppb Pb treatment. There was a decrease in the expression of the two GABA synthesizing genes gad2 and gad1b. There was also a significant decrease in expression of the two receptor genes gabra1 and gabbr1a. A previous study identified that exposure to Pb acetate has an effect on GABA receptors through channel modification therefore decreasing GABA binding affinity and capacity (Waśkiewicz, 1996). Changes in gene expression could be a potential mechanism; however, this study was performed on adult male Wistar rats at an age where GABA was inhibitory in nature. Determination if Pb exposure decreases GABA binding affinity during development requires further investigation.
One of the most interesting responses observed in comparing gene expression across the four developmental time points is the difference that occurred between 48 and 60 hpf. The genes that were statistically reduced at 48 hpf (gad2, gabra1, gabbr1a, and vgat) at 50 and 100 ppb Pb were significantly increased at 60 hpf, but only in the 50 ppb treatment. From these data the GABAergic system appears to increase its gene expression to counteract the decrease generated at 48 hpf in the 50 ppb treatment. A similar response at the 100 ppb Pb treatment was not observed and could be an indication of overloading the system preventing self-repair.
At 72 hpf Pb exposure did not cause a wide array of significant changes in gene expression throughout the GABAergic pathway. The only gene which showed a significant increase in expression was gad1b at the 100 ppb Pb treatment. These results were expected due to a previous study conducted in our laboratory that did not observe these genes being altered at this particular time point (Peterson et al., 2011).
The overall findings from the gene expression data are that expression changes caused by Pb exposure is dependent on dose, but does not appear to affect the GABAergic genes in a dose response manner (Fig. 4). Instead, throughout development of the GABAergic system, Pb appears to elicit its effects in a cyclical pattern allowing for the system to react and attempt a return to a state of homeostasis. The GABA synthesizing genes (gad2 and gad1b) and receptor genes (gabra1 and gabbr1a) appear to be the most sensitive targets of Pb exposure during the excitatory neurotrophic actions of GABA, therefore potentially being responsible for the regulation of GABA levels. The most sensitive developmental time point in alterations of gene expression was 48 hpf where Pb exposure resulted in its most negative effects. As stated above during this developmental time point in the zebrafish, there is rapid axonal growth and migration along with cellular proliferation. These cellular processes are all previously identified to be key targets of developmental Pb neurotoxicity.
Fig. 4. Summary of GABAergic gene expression alterations following embryonic Pb exposure.
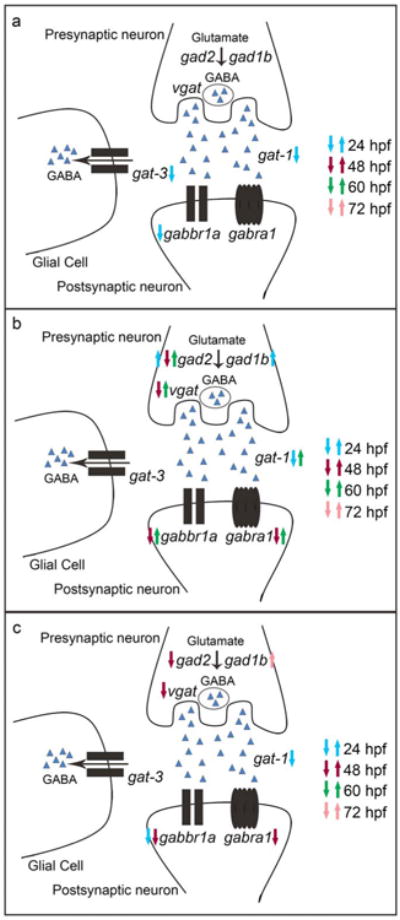
Schematic representation of altered GABAergic gene expression at 10 (a), 50 (b), and 100 (c) ppb Pb at four developmental time points (24, 48, 60, and 72 hpf). Figures demonstrate the neuronal location and/or function of each gene throughout the GABAergic pathway. Arrows indicate direction of alterations in gene expression.GABA is represented by blue triangles
To compare the gene expression alterations to changes in GABA levels, analysis of GABA levels was performed at 48 and 72 hpf following the same Pb treatment as used for the gene expression analysis. Gene expression alterations at the 10 ppb treatment were only observed at 24 hpf with a decrease in gabbr1a, gat-1, and gat-3. These gene expression changes can be compared to a significant increase in GABA at 48 hpf in this treatment. A significant decrease in GABA was observed at 72 hpf in larvae exposed to 10 ppb Pb indicating a potential compensatory mechanism, but this increase was not linked to any gene expression alterations at the later developmental stages. One hypothesis for Pb's ability to cause a significant change in GABA levels while causing minimal changes in gene expression during embryogenesis is that Pb exposure at 48 hpf when GABA is excitatory causes excitotoxicity, leading to increased GABA levels. Whereas at 72 hpf GABA has transitioned to its traditional inhibitory role and while still sensitive to Pb exposure now reacts in the opposite direction resulting in a decrease in GABA levels. GABA's function whether excitatory or inhibitory appears to play a role in Pb developmental neurotoxicity at this treatment level.
In the 50 ppb treatment an increase in gene expression was observed for the GABA synthesizers gad2 and gad1b at 24 hpf. This over expression can be linked to a compensation event leading to a significant increase in GABA at 48 hpf. While at 48 hpf a significant decrease in expression of gad2, gabra1, gabbr1a, and vgat was observed, a significant increase in gad2, gabra1, gabbr1a, gat-1, and vgat was observed at 60 hpf. From this data, it appears that continuous compensation and adjustment events different than that observed at 10 ppb are occurring, but ultimately with the similar result of a significant decrease in GABA at 72 hpf.
A significant difference in GABA levels was not detected at 48 hpf in the 100 ppb treatment and only a significant decrease in gabbr1a and gat-1 was observed at 24 hpf. At 48 hpf a decrease in expression was observed for the GABA synthesizer gad2, for the two GABA receptors, and for vgat. No significant differences in gene expression were observed in the 100 ppb treatment at 60 hpf, but a significant decrease in GABA was observed at 72 hpf. From this data it seems a compensation event is not occurring at these time points resulting in the decrease in GABA levels at 72 hpf. Overall when integrating the gene expression data with GABA levels it can be concluded that although all three Pb treatments ultimately result in a significant decrease in GABA levels at 72 hpf these changes appear to be occurring through different genetic mechanisms with only some treatments indicating compensatory events. In addition, gene expression alterations were observed prior to corresponding changes in GABA levels at treatments of 50 and 100 ppb Pb. The outcome of this study also shows that at the lowest treatment of 10 ppb, Pb may be acting as a direct toxicant to GABAergic neurotransmission, and that mRNA expression changes may not underlie alterations in GABA levels. Previous studies that investigated developmental Pb exposure and its effects on GABA levels report that Pb decreases GABA levels in rat pups; however, as noted in the introduction GABA was inhibitory at the time point of analysis in these studies (Leret et al., 2002; Silbergeld et al., 1979, 1980). As a result comparison between studies that were also previously conducted during development is limited.
5.0 Conclusions
These new data provide evidence that lower dose Pb exposure affects the developing CNS with a specific focus on the GABAergic system. The excitatory function of the GABAergic system is highly regulated during development and its proper functioning is important in maintaining normal neuronal function. Currently, the literature examining the effects of Pb on the GABAergic system focuses on effects during later developmental stages and adulthood when GABA is inhibitory. The current study begins to shed light on how Pb exposure affects GABA during its role as an excitatory neurotrophic factor in early developmental stages and furthers our understanding on mechanisms of Pb developmental neurotoxicity.
Highlights.
Dose-response relationship between developmental Pb exposure and tissue-uptake
Pb treatments up to 100 ppb do not cause morphological alterations in zebrafish
GABA gene expression alterations are dose and time point specific
Alterations in GABA levels are observed with exposure to 10, 50, and 100 ppb Pb
Acknowledgments
The authors thank Dr. Maria S. Sepúlveda for the use of the Nikon SMZ1500 dissecting microscope and Dr. Karl Wood for his assistance with ICP-MS analysis. The authors also thank Kelly Schlotman for her assistance in obtaining the Pb morphological measurements.
Funding Information: This work was supported by start-up funding from Purdue University [J.L.F. and J.R.C. and the National Institute of Environmental Health Sciences at the National Institutes [R00ES019879 to J.R.C].
Footnotes
Conflict of Interest: The authors declare that they have no conflict of interest.
Publisher's Disclaimer: This is a PDF file of an unedited manuscript that has been accepted for publication. As a service to our customers we are providing this early version of the manuscript. The manuscript will undergo copyediting, typesetting, and review of the resulting proof before it is published in its final citable form. Please note that during the production process errors may be discovered which could affect the content, and all legal disclaimers that apply to the journal pertain.
References
- Bae YK, Kani S, Shimizu T, Tanabe K, Nojima H, Kimura Y, Higashijima S, Hibi M. Anatomy of zebrafish cerebellum and screen for mutations affecting its development. Develop biol. 2009;330:406–426. doi: 10.1016/j.ydbio.2009.04.013. [DOI] [PubMed] [Google Scholar]
- Barbazuk W, Korf I, Kadavi C, Heyen J, Tate S, Wun E, Bedell J, McPherson J, Johnson S. The syntenic relationship of the zebrafish and human genomes. Genome Res. 2000;10:1351–1358. doi: 10.1101/gr.144700. [DOI] [PMC free article] [PubMed] [Google Scholar]
- Canfield R, Henderson C, Jr, Cory-Slechta D, Cox C, Jusko T, Lanphear B. Intellectual impairment in children with blood lead concentrations below 10 μg per deciliter. N Engl J Med. 2003;348:1517–1526. doi: 10.1056/NEJMoa022848. [DOI] [PMC free article] [PubMed] [Google Scholar]
- Centers for Disease Control and Prevention. Lead Home Page. Atlanta: CDC.gov; [Google Scholar]
- Chen J, Chen Y, Liu W, Bai C, Liu X, Liu K, Li R, Zhu JH, Huang C. Developmental lead acetate exposure induces embryonic toxicity and memory deficit in adult zebrafish. Neurotoxicol Teratol. 2012;34:581–586. doi: 10.1016/j.ntt.2012.09.001. [DOI] [PubMed] [Google Scholar]
- Connaughton VP, Behar TN, Liu WLS, Massey SC. Immunocytochemical localization of excitatory and inhibitory neurotransmitters in the zebrafish retina. Vis Neurosci. 1999;16:483–490. doi: 10.1017/s0952523899163090. [DOI] [PubMed] [Google Scholar]
- Darrah SD, Miller MA, Ren D, Hoh NZ, Scanlon JM, Conley YP, Wagner AK. Genetic variability in glutamic acid decarboxylase genes: Associations with post-traumatic seizures after severe TBI. Epilepsy Res. 2012;103:180–194. doi: 10.1016/j.eplepsyres.2012.07.006. [DOI] [PMC free article] [PubMed] [Google Scholar]
- de Esch C, Slieker R, Wolterbeek A, Woutersen R, De Groot D. Zebrafish as potential model for developmental neurotoxicity testing: A mini review. Neurotoxicol Teratol. 2012;34:545–553. doi: 10.1016/j.ntt.2012.08.006. [DOI] [PubMed] [Google Scholar]
- Delgado L, Schmachtenberg O. Immunohistochemical Localization of GABA, GAD65, and the Receptor Subunits GABAAα1 and GABAB1 in the Zebrafish Cerebellum. Cerebellum. 2008;7:444–450. doi: 10.1007/s12311-008-0047-7. [DOI] [PubMed] [Google Scholar]
- Drew C, Spence I, Johnston G. Effect of chronic exposure to lead on GABA binding in developing rat brain. Neurochem Int. 1990;17:43–51. doi: 10.1016/0197-0186(90)90066-3. [DOI] [PubMed] [Google Scholar]
- Fortune T, Lurie D. Chronic low-level lead exposure affects the monoaminergic system in the mouse superior olivary complex. J Comp Neurol. 2009;513:542–558. doi: 10.1002/cne.21978. [DOI] [PMC free article] [PubMed] [Google Scholar]
- Howe K, Clark M, Torroja C. The zebrafish reference genome sequence and its relationship to the human genome. Nature. 2013;7446:498–503. doi: 10.1038/nature12111. [DOI] [PMC free article] [PubMed] [Google Scholar]
- Jelitai M, Madarasz E. The role of GABA in the early neuronal development. Int Rev Neurobiol. 2005;71:27–62. doi: 10.1016/s0074-7742(05)71002-3. [DOI] [PubMed] [Google Scholar]
- Kimmel C, Ballard W, Kimmel S, Ullmann B, Schilling T. Stages of embryonic development of the zebrafish. Dev Dyn. 1995;203:253–310. doi: 10.1002/aja.1002030302. [DOI] [PubMed] [Google Scholar]
- Lanphear B, Dietrich K, Cox C. Cognitive Deficits associated with blood lead concentrations <10 ug/dL in US children and adolescence. Public Health Rep. 2000;115:521–529. doi: 10.1093/phr/115.6.521. [DOI] [PMC free article] [PubMed] [Google Scholar]
- Lanphear B, Hornung R, Khoury J, Yolton K, Baghurst P, Bellinger D, Canfield R, Dietrich K, Bornschein R, Greene T, Rothenberg S, Needleman H, Schnaas L, Wasserman G, Graziano J, Roberts R. Low-level environmental lead exposure and children's intellectual function: an international pooled analysis. Environ Health Perspect. 2005;113:894–899. doi: 10.1289/ehp.7688. [DOI] [PMC free article] [PubMed] [Google Scholar]
- Lasley SM, Gilbert ME. Rat hippocampal glutamate and GABA release exhibit biphasic effects as a function of chronic lead exposure level. Tox Sci. 2002;66:139–147. doi: 10.1093/toxsci/66.1.139. [DOI] [PubMed] [Google Scholar]
- Leret M, Garcia-Uceda F, Antonio M. Effects of maternal lead administration on momoaminergic, GABAergic and glutamatergic systems. Brain Res Bull. 2002;58:469–473. doi: 10.1016/s0361-9230(02)00819-5. [DOI] [PubMed] [Google Scholar]
- Marty S, Wehrlé R, Sotelo C. Neuronal activity and brain-derived neurotrophic factor regulate the density of inhibitory synapses in organotypic slice cultures of postnatal hippocampus. J Neurosci. 2000;20:8087–8095. doi: 10.1523/JNEUROSCI.20-21-08087.2000. [DOI] [PMC free article] [PubMed] [Google Scholar]
- Martyniuk CJ, Awad R, Hurley R, Finger TE, Trudeau VL. Glutamic acid decarboxylase 65, 67, and GABA-transaminase mRNA expression and total enzyme activity in the goldfish (Carassius auratus) brain. Brain Res. 2007;1147:154–166. doi: 10.1016/j.brainres.2007.02.010. [DOI] [PubMed] [Google Scholar]
- Milanese C, Sager J, Bai Q, Farrell T, Cannon J, Greenamyre J, Burton E. Hypkinesia and reduced dopamine levels in zebrafish lacking β- and γ1-synucleins. J Biol Chem. 2012;287:2971–2983. doi: 10.1074/jbc.M111.308312. [DOI] [PMC free article] [PubMed] [Google Scholar]
- Minelli A, Brecha N, Karschin C, DeBiasi S, Conti F. GAT-1, a high-affinity GABA plasma membrane transporter, is localized to neurons and astroglia in the cerebral cortex. J Neurosci. 1995;15:7734–7746. doi: 10.1523/JNEUROSCI.15-11-07734.1995. [DOI] [PMC free article] [PubMed] [Google Scholar]
- Mueller T, Vernier P, Wullimann M. A phylotypic stage in vertebrate brain development: GABA cell patterns in zebrafish compared with mouse. J Comp Neurol. 2006;494:620–634. doi: 10.1002/cne.20824. [DOI] [PubMed] [Google Scholar]
- Mueller T, Wullimann M. Atlas of early zebrafish brain development: A tool for molecular neurogenetics. Amsterdam, The Netherlands: 2005. [Google Scholar]
- Neal A, Stansfield K, Worley P, Thompson R, Guilarte T. Lead exposure during synaptogenesis alters vesicular proteins and impairs vesicular release: potential role of NMDA receptor–dependent BDNF signaling. Tox Sci. 2010;116:249–263. doi: 10.1093/toxsci/kfq111. [DOI] [PMC free article] [PubMed] [Google Scholar]
- Needleman H. Lead poisoning. Annu Rev Med. 2004;55:209–222. doi: 10.1146/annurev.med.55.091902.103653. [DOI] [PubMed] [Google Scholar]
- Peterson S, Freeman J. RNA isolation from embryonic zebrafish and cDNA synthesis for gene expression analysis. Journal of visualized experiments JoVE. 2009;30 doi: 10.3791/1470. [DOI] [PMC free article] [PubMed] [Google Scholar]
- Peterson S, Zhang J, Weber G, Freeman J. Global Gene Expression Analysis Reveals Dynamic and Developmental Stage-Dependent Enrichment of Lead-Induced Neurological Gene Alterations. Environ health perspect. 2011;119:615–621. doi: 10.1289/ehp.1002590. [DOI] [PMC free article] [PubMed] [Google Scholar]
- Peterson S, Zhang J, Freeman J. Developmental reelin expression and time point-specific alterations from lead exposure in zebrafish. Neurotoxicol and Teratol. 2013;38:53–60. doi: 10.1016/j.ntt.2013.04.007. [DOI] [PubMed] [Google Scholar]
- Rice C, Ghorai JK, Zalewski K, Weber DN. Developmental lead exposure causes startle response deficits in zebrafish. Aquat Toxicol. 2011;105:600–608. doi: 10.1016/j.aquatox.2011.08.014. [DOI] [PMC free article] [PubMed] [Google Scholar]
- Reynolds A, Brustein E, Liao M, Mercado A, Babilonia E, Mount D, Drapeau P. Neurogenic role of the depolarizing chloride gradient revealed by global overexpression of KCC2 from the onset of development. J Neurosci. 2008;28:1588–1597. doi: 10.1523/JNEUROSCI.3791-07.2008. [DOI] [PMC free article] [PubMed] [Google Scholar]
- Silbergeld E, Hruska R, Miller L, Eng N. Effects of lead in vivo and in vitro on GABAergic neurochemistry. J Neurochem. 1980;34:1712–1718. doi: 10.1111/j.1471-4159.1980.tb11265.x. [DOI] [PubMed] [Google Scholar]
- Silbergeld E, Miller L, Kennedy S, Eng N. Lead, GABA, and seizures: effects of subencephalopathic lead exposure on seizure sensitivity and GABAergic function. Environ Res. 1979;19:371–382. doi: 10.1016/0013-9351(79)90062-8. [DOI] [PubMed] [Google Scholar]
- Strużyńska L, Sulkowski G. Relationships between glutamine, glutamate, and GABA in nerve endings under Pb-toxicity conditions. Journal of inorganic biochemistry. 2004;98:951–958. doi: 10.1016/j.jinorgbio.2004.02.010. [DOI] [PubMed] [Google Scholar]
- Waśkiewicz J. Alterations of GABA B binding caused by acute and chronic lead administration. Acta neurobiologiae experimentalis. 1996;56:227–231. doi: 10.55782/ane-1996-1124. [DOI] [PubMed] [Google Scholar]
- Westerfield M. The zebrafish book: a guide for the laboratory use of zebrafish (Danio rerio) 5th. Eugene, Oregon: 2007. [Google Scholar]
- Zhang J, Peterson S, Weber G, Zhu X, Zheng W, Freeman J. Decreased axonal density and altered expression profiles of axonal guidance genes underlying lead (Pb) neurodevelopmental toxicity at early embryonic stages in the zebrafish. Neurotoxicol Teratol. 2011;33:715–720. doi: 10.1016/j.ntt.2011.07.010. [DOI] [PMC free article] [PubMed] [Google Scholar]
- Zhang R, Wei H, Xia Y, Du J. Development of light response and GABAergic excitation-to-inhibition switch in zebrafish retinal ganglion cells. J physiol. 2010;588:2557–2569. doi: 10.1113/jphysiol.2010.187088. [DOI] [PMC free article] [PubMed] [Google Scholar]
- Zhao C, Driessen T, Gammie SC. Glutamic acid decarboxylase 65 and 67 expression in the lateral septum is up-regulated in association with the postpartum period in mice. Brain Research. 2012;1470:35–44. doi: 10.1016/j.brainres.2012.06.002. [DOI] [PMC free article] [PubMed] [Google Scholar]