

Summary
White adipose tissue (WAT) morphology characterized by hypertrophy (i.e. fewer but larger adipocytes) associates with increased adipose inflammation, lipolysis, insulin resistance and risk of diabetes. However, the causal relationships and the mechanisms controlling WAT morphology are unclear. Herein, we identified EBF1 as an adipocyte-expressed transcription factor with decreased expression/activity in WAT hypertrophy. In human adipocytes, the regulatory targets of EBF1 were enriched for genes controlling lipolysis and adipocyte morphology/differentiation and in both humans and murine models, reduced EBF1 levels associated with increased lipolysis and adipose hypertrophy. Although EBF1 did not affect adipose inflammation, TNFα reduced EBF1 gene expression. High fat diet-intervention in Ebf1+/− mice resulted in more pronounced WAT hypertrophy and attenuated insulin sensitivity compared with wild-type littermate controls. We conclude that EBF1 is an important regulator of adipose morphology and fat cell lipolysis and may constitute a link between WAT inflammation, altered lipid metabolism, adipose hypertrophy and insulin resistance.
Introduction
Disturbances in white adipose tissue (WAT) function, including increased local inflammation and fat cell lipolysis, are linked to insulin resistance, dyslipidemia and atherosclerosis (Rosen and Spiegelman, 2014; Sun et al., 2011). Results in recent years have also highlighted the clinical importance of adipose tissue morphology regardless of body fat mass. Thus, in lean as well as in obese subjects, a phenotype characterized by fewer but larger fat cells (adipose hypertrophy) correlates closely with WAT dysfunction and insulin resistance, while many small adipocytes (adipose hyperplasia) is protective (Arner et al., 2010b; Arner et al., 2011; Hoffstedt et al., 2010; Weyer et al., 2000). Furthermore, adipose hypertrophy confers an increased risk for the development of type 2 diabetes (Lonn et al., 2010; Weyer et al., 2000).
Although human adipocyte turnover (i.e. adipocyte birth/death rate) is significantly reduced in adipose hypertrophy (Arner et al., 2010b), the mechanisms promoting differences in adipose morphology are still largely unknown. In addition, while adipose morphology co-varies with in vitro and in vivo insulin resistance as well as changes in WAT inflammation and lipolysis, the causal relationship between these factors is not known. Using an unbiased approach, we set out to identify transcription factors (TFs) associated with altered adipose morphology, to dissect their mechanism of action and evaluate their clinical relevance. This resulted in the identification of early B-cell factor 1 (EBF1), a TF previously implicated in adipogenesis (Akerblad et al., 2002; Fretz et al., 2010), which through combined studies in human and murine models was shown to also be an important regulator of adipose morphology, lipolysis and the development of insulin resistance.
Results
Adipose morphology is characterized by distinct functional and transcriptional alterations
The relationship between adipose morphology and metabolic function was investigated in obese and non-obese women (cohort 1, n=322), who were further subdivided into either those having hyperplastic or hypertrophic subcutaneous WAT. In both weight groups, subjects were matched for age, percent body fat and body mass index (BMI) (Table S1). Irrespective of morphology, WAT of obese compared with non-obese subjects, was characterized by increased basal (i.e. non-hormone-stimulated) (Figure 1a and S1a) and attenuated isoprenaline-induced lipolysis (Figure 1b), insulin resistance at the adipocyte level (Figure 1c) and whole body level (Table S1) as well as elevated WAT release of the cyto-/chemokines tumor necrosis factor alpha (TNFα) (Figure 1d), chemokine (C-C motif) ligand 2 (CCL2) (Figure 1e) and interleukin 6 (IL6) (Figure S1b). Adipose morphology had a marked and statistically significant impact on several of these parameters, particularly in the non-obese subjects, where hypertrophy was associated with a more pernicious phenotype. Although cohort 1 consisted only of women, similar findings were also observed in men (cohort 2, n=176, Table S1 and values not shown).
Figure 1. Relationship between adipose morphology, metabolic phenotype and gene expression.

Effects of adipose morphology on in vitro (a) basal lipolysis, (b) isoprenaline-stimulated lipolysis (expressed as the quotient over basal lipolysis), (c) insulin-stimulated lipogenesis, (d) TNFα secretion, (e) CCL2 secretion and (f) overall gene expression (shown as a principal component analysis). For (a–e) results are shown as mean±SEM and were evaluated using ANOVA followed by Fishers PLSD post-hoc test. Statistically significant differences (p<0.05) are denoted as follows: a=different within the weight group, b= different from both measures in the other weight group, c= different both within the weight group and with both measures in the other weight group, d= different from one of the measures in the other weight group. In (f), groups are separated with 95% confidence interval if the circles are not overlapping each other. See also Figure S1 and Table S1–2.
To determine if morphology-associated metabolic profiles were linked to changes in the transcriptome, analyses of global gene expression in WAT from a previously described subset of cohort 1 (cohort 3, n=56) (Arner et al., 2012) were performed. A principal component analysis (PCA) based on overall gene expression, separated the four groups of subjects into three distinct clusters; obese (both with hyperplasia and hypertrophy), non-obese hypertrophy and non-obese hyperplasia (Figure 1f). Further comparisons demonstrated that; 1) 619 genes were altered by morphology in non-obese subjects and 2) this gene set displayed a considerable overlap (88%) with genes perturbed in obese individuals (Figure S1c and Table S2). Gene set enrichment analysis (GSEA) revealed that genes increased in non-obese hypertrophy belonged to pro-inflammatory pathways (Figure S1d, left panel), while genes that were decreased were primarily associated with carbohydrate/lipid metabolism and fat cell morphology (Figure S1d, right panel).
Adipocyte EBF1 expression and activity is linked to adipose morphology
In order to identify TFs potentially causing the gene expression alterations observed in Figure 1f, we performed a Motif Activity Response Analysis (MARA), based on the global transcriptomic data mentioned above and combined it with our previously published MARA-results during human adipocyte differentiation (Arner et al., 2012). This identified seven TFs fulfilling the following criteria; 1) present in in vitro differentiated adipocytes and 2) exhibiting binding site motif activity patterns similar to that observed in the PCA, i.e. altered in obesity and in non-obese subjects with hyperplasia vs. hypertrophy (Table S3). Two out of the seven TFs (EBF1 and hepatic leukemia factor, HLF) displayed alterations in both binding site activity (Fig. 2a and Table S3, respectively) and mRNA levels (Table S3) in non-obese subjects with hyperplasia. However, only EBF1 could be confirmed by qPCR (Figure 2b and S2a) and this was corroborated by increased protein levels in non-obese individuals (Figure 2c–d). Thus, EBF1 mRNA, protein and activity levels were selectively increased in the non-obese subjects with hyperplasia and as a result, further studies were concentrated on this TF. Consistent with previously published data in murine WAT (Jimenez et al., 2007), EBF1 mRNA expression was enriched in the adipocyte fraction of WAT compared with intact adipose tissue or leucocytes and macrophages (Figure 2e–f). A detailed analysis of EBF1 mRNA levels during human adipocyte differentiation, showed an increase 12h after induction of adipogenesis which plateaued at day 4 (Figure 2g). Furthermore, adipocyte volume correlated negatively with EBF1 gene expression in isolated adipocytes (Figure 2h) and mRNA/activity in intact tissue (Figure S2b–c). There was also a significant association between EBF1 mRNA levels/activity and the gene expression of leptin (LEP) and the wnt1 inducible signaling pathway protein 2 (WISP2) (Figure S2d), two previously established markers of adipose hypertrophy (Gustafson et al., 2013; Jernas et al., 2006; Skurk et al., 2007). These results prompted us to functionally evaluate the role of EBF1 in WAT and whether the altered activity/expression of this TF is a cause or a consequence of differences in adipose morphology and/or metabolic function.
Figure 2. Characterization of EBF1 activity, mRNA and protein levels in human subcutaneous adipose tissue.

(a) Activity and (b) mRNA expression in WAT from non-obese and obese subjects with adipose different morphologies. (c) Western blot and (d) quantification of EBF1 protein levels in WAT from non-obese individuals with hyperplasia or hypertrophy. Relative EBF1 mRNA expression in (e) paired samples of isolated adipocytes (Adipo) and intact WAT (n=43), (f) isolated macrophages (Macro), leukocytes (Leuko) and adipocytes (n=10) as well as (g) during adipocyte differentiation in vitro (n=3). (h) Correlation between adipocyte EBF1 mRNA expression and fat cell volume. Results were evaluated using (a, b, f) ANOVA followed by Fishers PLSD post-hoc test, (d, e) Student’s t-test and (h) linear regression analysis. Statistically significant differences (p<0.05) are denoted as follows: a=different in a two-group comparison or within the weight group, b= different from both other measures, d= different from one of the measures in the other weight group. See also Figure S2 and Table S3.
EBF1 regulates genes important for adipocyte lipid metabolism and differentiation
To map direct transcriptional regulatory targets of EBF1, genome-wide EBF1 chromatin immunoprecipitation followed by DNA sequencing (ChIP-sequencing) analysis was performed in human adipocytes differentiated in vitro. Using a stringent approach that intersects two independent peak calling methods, 10428 unique EBF1-binding regions were identified (Table S4). A de novo search for enriched sequence motifs in these sites identified an EBF1-like binding motif as the most significantly enriched motif (Figure 3a), which was present in 78% of the identified binding regions. There was a clear enrichment of EBF1 binding sites in proximity to the transcriptional start site (TSS) of the nearest genes (Figure 3b), a distribution pattern, which is in line with previous findings in B-cells (Treiber et al., 2010) and more recently in 3T3-L1 cells (Griffin et al., 2013). In total, 2501 genes were identified as potential EBF1 target genes (Table S5) with the detected EBF1 binding region close to the respective TSS (±10 kb). Pathway enrichment analysis revealed these genes to be primarily involved in lipid metabolism and WAT morphology (Figure 3c and Table S6).
Figure 3. Identification of genes and pathways regulated by EBF1.

(a) Cis-regulatory sequence motif identified in EBF1-bound sequences identified by ChIP-sequencing data. (b) Histogram displaying the distance of EBF1 binding regions to the transcription start site. (c) Identification of pathways enriched among genes bound by EBF1. Orange and purple bars depict mouse phenotype and gene ontology databases, respectively. (d) Genes bound by EBF1 and/or altered by EBF1 knock-down. According to ChIP-sequencing data, 2501 genes bound EBF1, however only 1989 of these passed the non-specific filter for microarray analysis and were included in this venn-diagram. Details about the filters are in the Experimental procedures. (e) Identification of genes bound by EBF1, altered by EBF1 knockdown and present in several of the enriched pathways. Genes bound and regulated by EBF1 as well as altered by morphology are indicated by red arrows. See also Figure S3 and Tables S4-S8.
Because TF/DNA interactions do not necessarily imply transcriptional regulation, we performed global gene expression profiling in human adipocytes transfected with siRNA targeting EBF1 (knock-down efficiency shown in Figure S3a). A subset of the identified potential EBF1 target genes was also regulated by EBF1 RNAi treatment (Figure 3d and Table S5). A GSEA of the up regulated genes displayed only three significantly enriched gene sets, none of which were related to adipocyte metabolism (Table S7). In contrast, among the down regulated genes, there was a significant enrichment of several gene sets implicated in WAT morphology and adipocyte metabolism (in particular lipid metabolism) (Table S7); 24 genes were considered as key EBF1 target genes because they were included in many of the identified pathways (Figure 3e). Several of these genes are well-established regulators of adipogenesis (e.g. peroxisome proliferator-activated receptor gamma, PPARG and nuclear receptor corepressor 2, NCOR2) and lipolysis (e.g. hormone-sensitive lipase, LIPE; patatin-like phospholipase domain containing 2, PNPLA2; perilipin 1, PLIN1 and cell death-inducing DFFA-like effector c, CIDEC) (Girousse and Langin, 2012; Nofsinger et al., 2008). By overlapping results from our EBF1 ChIP-seq analysis with the global transcriptome data of human WAT with different morphologies, we found that out of the 24 key genes bound and regulated by EBF1 (Figure 3e), seven (PPARG, LIPE, PNPLA2, PLIN1, CIDEC, diacylglycerol O-acyltransferase 1, DGAT1 and adiponectin, ADIPOQ) were also expressed at significantly lower levels in non-obese subjects with adipose hypertrophy vs. hyperplasia (Figure S3b and Table S8). These genes were considered to be of particular interest and are highlighted by red arrows in Figures 3e and S3b.
EBF1 depletion alters adipocyte lipolysis
As evident from our clinical characterization of cohort 1, adipose hypertrophy is associated with altered basal as well as stimulated lipolysis, increased pro-inflammatory cyto-/chemokine secretion and decreased insulin sensitivity both in vivo and in vitro (i.e. at the fat cell level). Although the functional role of EBF1 in controlling adipogenesis is well-established, the effects on other aspects of adipocyte function have not been characterized. To this end, human in vitro differentiated adipocytes were transfected with siRNA targeting EBF1. While no effects were observed on glucose transport (basal and insulin-stimulated, Figure S4a) or secretion of TNFα, CCL2, IL6 and adiponectin (Figure S4b), basal (increased) and isoprenaline-induced (decreased) lipolysis was significantly altered (Figure 4a–b). Quantitative PCR and Western blot confirmed the EBF1 RNAi microarray data, i.e. a significant 30–40% down regulation in the mRNA and protein expression of key lipolytic genes, including PLIN1 and LIPE (Figures 4c and S4c). A combined decrease in the expression of PLIN1 and LIPE can result in increased lipolysis in human adipocytes provided that the ratio between LIPE and PLIN1 is increased at the lipid droplet surface (Stenson et al., 2011). In order to dissect mechanisms by which EBF1 controls basal lipolysis, human adipocytes were transfected with siRNAs targeting EBF1, PLIN1 or both (Figure 4c). While EBF1 and PLIN1 RNAi induced similar, albeit quantitatively slightly different, increases in glycerol release (Figure 4a) and the ratio of LIPE/PLIN1 protein at the lipid droplet surface (Figure 4d–e), there was no additive effect of combining the two treatments. The in vivo relevance of these findings was corroborated by the significant negative association between EBF1 mRNA levels in WAT and in vivo lipolysis (cohort 3, Figure S4d).
Figure 4. Functional evaluation of EBF1 knockdown in human adipocytes.

(a) Basal lipolysis determined in human adipocytes transfected with EBF1, PLIN1, EBF1/PLIN1 or control (non-silencing) siRNAs. (b) Effects of EBF1 gene knockdown on isoprenaline-stimulated lipolysis (expressed as the quotient over basal lipolysis). (c) Messenger RNA expression of the indicated genes following transfection of RNAi oligonucleotides targeting the same genes as in (a). (d) Representative immunofluorescence images of adipocytes transfected as in (a). Cells were incubated with antibodies directed against PLIN1 (left column) and LIPE (middle column) and the obtained images were merged (right column, with PLIN1 in red and LIPE in green). (e) The quotient between LIPE and PLIN1 levels at the lipid droplet surface was determined for each transfection condition. For (a–c), results are based on experiments performed in at least triplicate wells using cells obtained from a minimum of two different donors. Results in (d–e) were obtained as described in Experimental Procedures. Data are shown as mean±SEM and were evaluated using (a, c, d) ANOVA followed by Fishers PLSD post-hoc test or (b) Student’s t-test. Statistically significant differences (p<0.05) are denoted as follows: a=different from control, b= different from both control and siEBF1. See also Figure S4.
EBF1 reduction promotes adipose hypertrophy in mice
In order to determine whether murine Ebf1 expression was regulated by alterations in fat mass in a similar manner as observed in humans, publically available transcriptional data of murine WAT depots were retrieved. The results from this analysis demonstrated that Ebf1 mRNA expression was significantly reduced upon high-fat diet (Hfd) (p=0.0034 for overall difference in five individual studies, Table S9). To directly determine the role of EBF1 in the development of adipose morphology, we used a murine knock-out model. Because Ebf1−/− mice are lipodystrophic (Festa et al., 2011; Fretz et al., 2010) and therefore not suitable for studies of WAT function, Ebf1+/− animals were generated and subjected to Hfd for up to ten weeks. Recent results have highlighted qualitative differences in the expandability between gonadal (gWAT) and inguinal (iWAT) depots (Wang et al., 2013). Assessments were therefore performed in four separate regions; iWAT, gWAT, retroperitoneal (rpWAT) and mesenteric (mWAT). At baseline, compared to wild type (WT), Ebf1+/− mice displayed similar total body weight, total fat mass, lean body mass, brown adipose tissue (BAT) as well as iWAT, gWAT, rpWAT and mWAT depot weights (Figure 5 and S5). During and at the end of the Hfd both genotypes, had to a similar degree, increased their total body weight, total fat mass, lean body mass, BAT and all, but one, WAT depots (the exception being gWAT which was slightly less increased in the Ebf1+/− mice at week ten) (Figs 5 and S5). Analyses of fat cell diameter demonstrated that, compared to WT littermates, heterozygous animals on chow diet displayed consistently larger adipocytes in the studied WAT depots over time (Figure 5c–f). While Hfd in general increased fat cell size, the differences between genotypes persisted in all WAT depots up to seven weeks of hypercaloric intake. At ten weeks of Hfd, the observed differences in adipocyte diameters were no longer evident in gWAT, borderline significant in rpWAT (p=0.061) and remained significant in iWAT and mWAT. Thus, while the fat cell diameter in haploinsufficent mice fed Hfd plateaued at ~115–120 μm after three to seven weeks, WT littermates reached this size only at ten weeks.
Figure 5. Diet and genotype effects on body composition and fat cell diameter.

Wild type and Ebf1+/− mice were fed chow (Cd) or high fat diet (Hfd) for up to ten weeks. Effects on (a) total body weight, (b) total fat mass and adipocyte diameters in (c) inguinal (iWAT), (d) gonadal (gWAT), (e) retroperitoneal (rpWAT) and (f) mesenteric (mWAT) adipose tissue was determined. Results are based on measurements in all available mice (5–10 per group) and are shown as mean±SEM. For Cd at baseline, differences were assessed using Student’s t-test and statistically significant differences (p<0.05) are marked with an a. To evaluate diet- and genotype-specific effects, data were analyzed using ANOVA followed by Fishers PLSD post-hoc test. Statistically significant differences (p<0.05) between groups at three, seven and ten weeks are denoted as follows: a=different between diet within a genotype, b=different from both measures in the other genotype, c= different both between diet within the genotype and with both measures in the other genotype, d= different from one of the measures in the other genotype. See also Figure S5.
Effects of EBF1 reduction on lipolysis and insulin sensitivity in mice
To evaluate the metabolic phenotype of Ebf1 haploinsufficiency, we determined lipolysis in intact iWAT, measured fasting plasma insulin/glucose levels and performed insulin tolerance tests (ITTs). Compared to WT mice, lipolysis was higher in heterozygous animals (Figure 6a) and this was accompanied by reduced mRNA levels of Ebf1, Plin1 and Lipe (Figure 6b). Although Hfd induced a significant increase in fasting insulin and a trend towards higher glucose levels (Figure 6c–d), there were no effects of genotype on these measures. However, when performing ITTs, Ebf1+/− mice at ten, but not baseline, three or seven weeks of Hfd, displayed a significantly attenuated response to insulin between 30 to 150 min compared to pair-fed WT animals (Figure 6e). This was independent of whether the comparisons were made at each time-point, by calculating the area under the curve (p=0.028, graph not shown) or expressing the results as percent of baseline glucose values (graph not shown). In contrast, although WT animals on Hfd displayed slightly higher glucose values at each time points in the ITT curves, they were not statistically different from those of chow fed mice. It should be noted that the mice were generated on a mixed genetic background (C57BL/6-129X1/SvJ) and fed Hfd for a relatively short time period. These aspects may explain why WT littermates did not develop pronounced insulin resistance at the end of the diet intervention.
Figure 6. Diet and genotype effects on lipolysis and measures of insulin resistance.

(a) Lipolysis and (b) mRNA expression of indicated genes in inguinal adipose tissue (iWAT) from WT and Ebf1+/− mice. (c) Insulin and (d) glucose levels as well as (e) insulin tolerance tests (ITTs) at baseline and during Cd or Hfd at three, seven and ten weeks in WT and Ebf1+/− mice. Results are based on measurements in all available mice (5–10 per group) and are shown as mean±SEM. In two-group comparisons in (a–d), i.e. for animals at baseline, differences were assessed using Student’s t-test and statistically significant differences (p<0.05) are marked with an a. To evaluate diet- and genotype-specific effects, data were analyzed using ANOVA followed by Fishers PLSD post-hoc test. Statistically significant differences (p<0.05) between groups were observed at ten weeks and are denoted as follows: a=different between diet within a genotype, c= different both between diet within the genotype and with both measures in the other genotype, d= different from one of the measures in the other genotype. In (e), note that there was no sign of glucose recovery at the 150 min time point. As detailed in the SEP, this could depend on the fact that animals were fasted overnight prior to the assessments.
EBF1 expression is regulated by TNFα
Because adipose morphology and WAT inflammation are closely associated, we hypothesized that pro-inflammatory adipokines could affect EBF1 expression. This notion was corroborated by the observation that EBF1 activity correlated negatively with WAT secretion of TNFα, a cytokine with well-established effects on adipocyte lipolysis, insulin sensitivity and adipogenesis (cohort 3, Figure 7a). This association was independent of BMI (partial r=−0.47, p=0.0001). Furthermore, in vitro experiments in human adipocytes confirmed that recombinant TNFα down regulated EBF1 expression (Figure 7b).
Figure 7. Relationship between EBF1 and TNFα.
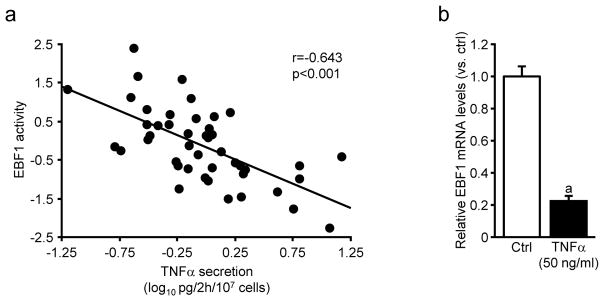
(a) Linear regression analysis between WAT TNFα secretion in vitro and EBF1 activity. After correction for BMI, the correlation remained significant (see main text). (b) EBF1 mRNA expression following incubations with recombinant TNFα in in vitro differentiated human adipocytes. Results are based on experiments performed in duplicate wells using cells obtained from two different donors. Data are shown as mean±SEM and evaluated using Student’s t-test. The statistically significant difference (p<0.05) is marked with an a.
Discussion
In vitro studies have conclusively demonstrated that EBF1 plays a central role in adipogenesis and the in vivo relevance of these findings is evident from the fact that Ebf1−/− mice are lipodystrophic (Fretz et al., 2010). Our unbiased approach identified, among a large number of TFs, adipocyte EBF1 expression and activity to be closely linked to adipose morphology in human WAT. The EBF1 regulatory cistrome included key genes involved in lipid metabolism and adipocyte differentiation/morphology and EBF1 depletion led to altered lipolysis, increased insulin resistance and WAT hypertrophy. Although we cannot exclude the possibility that reduced Ebf1 expression in other tissues may contribute to the observed metabolic phenotype, these data indicate that EBF1 is a central factor controlling the morphologic and metabolic phenotype of WAT as well as whole body insulin sensitivity.
The gene set bound and regulated by EBF1 in primary human adipocytes was determined and validated by combining transcriptional profiling, ChIP-seq and RNAi. Overall, this approach identified genes involved in lipid metabolism and adipogenesis, two processes which are essential for adipocyte function. In support of these observations, EBF1 RNAi resulted in increased basal and attenuated stimulated lipolysis, most probably due to reduced mRNA and protein levels of PLIN1 and LIPE as well as an altered ratio between these two proteins at the lipid droplet surface. This is consistent with the lipolytic phenotype observed in WAT hypertrophy and obesity. Current models posit that the relative expression and the lipid droplet-associated interaction between coating proteins (e.g. PLIN1, CIDEA and CIDEC) and lipases (LIPE and PNPLA2) control the rate of basal and stimulated lipolysis (reviewed in (Girousse and Langin, 2012)). It is therefore conceivable that other factors, such as CIDEA and PNPLA2, may also influence EBF1-mediated effects on lipolysis. In contrast, the specific genes involved in determining adipose morphology are less evident. The observation that WAT hypertrophy is associated with reduced adipocyte turnover (Arner et al., 2010b) suggests that genes involved in controlling adipocyte birth/death rates may be of importance. Moreover, it has been suggested that enlarged adipocyte size may represent a state of impaired WAT expandability due to altered adipogenesis (Tan and Vidal-Puig, 2008; Virtue and Vidal-Puig, 2010). Consistent with this, EBF1, PPARG and CEBPA mRNA levels in WAT were lower in non-obese hypertrophy. As these three TFs cross-talk by regulating the expression of each other as well as similar target genes (Griffin et al., 2013), it is tempting to speculate that EBF1 reduction, with concomitant alterations in PPARγ and CEBPα levels, result in WAT hypertrophy via impaired fat cell differentiation. Because there are no established in vitro techniques to evaluate direct effects on morphology, the causal link between EBF1 down regulation and WAT hypertrophy was studied in Ebf1+/− mice.
Compared with WT littermates, heterozygous animals displayed no significant changes in body composition or WAT/BAT depot sizes. However, analogous with our findings in humans, the expression of lipolytic regulators was decreased, while spontaneous (basal) glycerol release was increased in iWAT. Moreover, fat cell size was significantly larger in all four studied WAT depots, but despite this, there was no difference in insulin sensitivity when animals were fed chow diet. Because both increased lipolysis and adipocyte size confer an increased risk for metabolic complications, these findings prompted us to explore the effects of a Hfd intervention. As expected, irrespective of genotype, ten weeks of high fat feeding induced a significant increase in body weight, WAT depot sizes and circulating insulin concentrations. Heterozygous mice displayed significantly larger fat cell size throughout the observation period as well as attenuated insulin sensitivity (determined by ITT) at the end of the study. Notably, while our assessments in humans were based on WAT from the abdominal subcutaneous region, our murine data demonstrate that Ebf1 haploinsufficiency results in similar alterations in adipose morphology in four different WAT depots, including two visceral regions (gWAT and mWAT). Taken together, these results suggest that reduced Ebf1 expression results in WAT hypertrophy, increased basal lipolysis and confers an increased risk of developing insulin resistance under hypercaloric conditions. To what extent the secondary reductions in Pparg/Cebpa contribute to this phenotype is presently unknown. It would therefore be of interest to study the effects of thiazolidinediones in Ebf1+/− animals as well as to determine the consequences of over expressing Ebf1 in mice with genetically modified levels of Pparg/Cebpa.
Although the current clinical and transcriptomic analyses confirm a tight association between adipose hypertrophy, reduced insulin sensitivity, elevated basal lipolysis and increased local inflammation, the causal relationship between these changes is not known. Even if our data suggest that EBF1 affects adipose morphology and lipolysis, a combination of ChIP-seq, transcriptional profiling, RNAi and ELISA consistently demonstrated that EBF1 reduction did not influence the activity of inflammatory pathways in human adipocytes. In contrast, TNFα down regulated adipocyte EBF1 expression and the levels TNFα secretion correlated negatively with EBF1 activity. Thus, adipose hypertrophy may not be a cause, but rather a consequence of increased local inflammation acting via reduced EBF1 expression/activity. This hypothesis is supported by recent findings demonstrating that subcutaneous WAT from lean and healthy young women display a high correlation between adipose secretion of TNFα and adipose morphology (Arner et al., 2010a).
Recent work explored the effects of Ebf1 depletion by adenoviral shRNA in the immortalized murine cell line 3T3-L1 (Griffin et al., 2013). In analogy with our data, a significant but selective decrease in adipogenic genes such as Pparg and Cebpa was observed, without a global reduction of fat cell-enriched transcripts. These results together with the observation that EBF1 RNAi did not alter insulin sensitivity or adipokine secretion suggest that EBF1 knockdown does not induce significant de-differentiating effects in vitro. However, in clear contrast to our present data, Griffin and co-workers found a significant enrichment in inflammatory signaling (although this was probably regulated via indirect mechanisms), reduced glucose transport and attenuated TLR signaling (including reduced cytokine release and LPS-stimulated lipolysis). These differences imply that the cellular context in which EBF1 is studied impacts strongly on the data, a notion which is supported and discussed by Griffin et al. after comparing their ChIP-seq with similar analyses performed in non-adipose cells.
Several groups have aimed to elucidate the mechanisms underlying the development of adipose hypertrophy/hyperplasia under iso- or hypercaloric conditions in different murine WAT depots (reviewed in (Berry et al., 2014)). Using different techniques to determine adipocyte formation, these studies have come to somewhat divergent conclusions suggesting that upon Hfd, hyperplasia primarily occurs in either iWAT (Joe et al., 2009) or gWAT (Wang et al., 2013). In the latter work, the authors also proposed that large adipocytes, at least under some conditions, may in fact be new adipocytes formed through adipogenesis. Our data, demonstrating similar phenotypes in four different WAT depots of Ebf1+/−, both before and after Hfd, suggest that the effects of Ebf1 on adipocyte formation are region independent and persist at the onset of diet-induced obesity.
Our combined clinical and transcriptomic analyses identified three distinct phenotypes, non-obese with hyperplasia, non-obese with hypertrophy and obese subjects, implying that non-obese with WAT hypertrophy constitute a specific subgroup which, although anthropometrically non-obese, display a metabolic profile which more closely resembles the obese state. In contrast, obesity appears to over-ride the effects of adipocyte size and number, most probably due to several other associated disturbances. These observations together with previous findings demonstrating that WAT hypertrophy confers an increased risk for future development of type 2 diabetes (Lonn et al., 2010; Weyer et al., 2000), suggests that life-style interventions should be commenced early based on assessments of adipose morphology already in the non-obese state.
Taken together, EBF1 is an important regulator of WAT morphology and fat cell lipolysis by controlling distinct gene sets and may therefore constitute a pathophysiological link between adipose hypertrophy and common metabolic disorders. Whether EBF1 is also a suitable therapeutic target remains to be demonstrated.
Experimental Procedures
Subjects
Cohorts 1–3, described in detail in Table S1 and Supplemental Experimental Procedures (SEP), comprised healthy women and men subdivided into obese/non-obese and hyperplastic/hypertrophic WAT. The study was approved by the regional board of ethics and written informed consent was obtained from all participants.
Transcriptional profiling and Motif Activity Response Analysis (MARA)
Gene expression profiling was performed using Affymetrix Human Gene 1.0 (cohort 3, previously presented in (Arner et al., 2012)) and Affymetrix Human Gene 1.1 (EBF1 knockdown vs. control) ST arrays (Affymetrix, Inc., Santa Clara, CA). Data were analyzed with packages available from Bioconductor (www.bioconductor.org). Normalization and calculation of gene expression was performed with the Robust Multichip Average expression measure using oligo package (Carvalho and Irizarry, 2010). Prior to further analysis, a non-specific filter was applied to include genes with expression signal >30 in at least 20% of all samples. Limma package (Smyth, 2004) was used to identify the differentially expressed genes which were ranked in the gene set enrichment analyses and principal component analysis was performed using the FactomineR package. Motif activity response analysis (MARA) was performed exactly as described (Arner et al., 2012; Suzuki et al., 2009) and detailed in SEP.
Chromatin immunoprecipitation (ChIP)
Adipocytes differentiated in vitro were fixed in 1% formaldehyde for 15 min at room temperature and quenched for 5 min by adding glycine to a final concentration of 0.125 M. Cells were harvested and nuclear fractions were enriched by a brief sonication in lysis buffer A ( 10mM Tris/Hcl (pH7.5), 10 mM NaCl, 3mM MgCl2, 10mM KCl2, 0.05% Nonidet P-40, 1 x protease inhibitors (Roche Complete® EDTA-free cocktail tablets) followed by centrifugation at 5000g for 5 minutes. The collected pellets were suspended in 1000 μl cell lysis buffer B (50 mM Tris (pH 8.0); 1 mM EDTA; 0.5 mM EGTA; 1% TritonX-100; 0.1% Na-deoxycholate; 150 mM NaCl; protease inhibitor). ChIP assays were then performed following the protocol described in (Gao et al., 2008). Samples were immunoprecipitated with 5 μg custom-made EBF1 antibody (Abmart, P.R. China) or rabbit IgG (Santa Cruz Biotechnology) at 4°C overnight.
Chromatin Immunoprecipitation-sequencing (ChIP-sequencing)
ChIP-sequencing libraries were prepared using NEBnext chip-seq library Prep master mix set (New England Biolabs, USA) from 5 ng of anti-EBF1 and anti-IgG ChIP DNA, respectively. Sequence data were generated with Illumina HiSeq 2000 single-read sequencing and aligned against the human genome (hg19, NCBI) using Burrows-Wheeler Aligner (Li and Durbin, 2009) with default parameters. The uniquely mapped reads were analyzed to identify EBF1 binding regions (with anti-IgG DNA as a control) by two different approaches, MACS( Zhang et al., 2008) and Homer (Heinz et al., 2010), using default settings. Regions that were detected by both methods were considered as EBF1-binding regions. An independent EBF1 ChIP-seq experiment, demonstrated a high reproducibility of the identified regions (Pearson correlation r=0.89) when comparing the normalized tag counts between replicates.
Gene annotation analysis
Genomic Regions Enrichment of Annotations Tool (GREAT) (McLean et al., 2010) was employed to perform the enrichment analysis of gene annotation in the proximity of EBF1 binding regions against the whole genome background. In the GREAT analysis, association of EBF1 genomic regions with nearby genes was determined by the “basal plus extension”-rule with the parameter of 5+1 kb basal promoter and a more limited 10 kb extension. Significantly enriched gene sets were selected by FDR q-value <0.05 for both Binomial and Hypergeometric tests. Significantly enriched gene sets between 15 and 600 genes were included.
Gene Set Enrichment Analysis (GSEA)
GSEA (Subramanian et al., 2005) was employed to analyze the altered gene expression profiles following EBF1 knock-down in adipocytes and between the human WAT with different morphologies. In order to identify core EBF1 target genes/pathways affected by altered EBF1 mRNA/protein levels in human adipocytes, 207 gene sets were compiled. These gene sets were derived from the significantly enriched terms identified in the GREAT analysis described above and contained only the genes associated with EBF1 binding regions identified by ChIP-seq (Table S5).
Mice
Ebf1−/− mice were originally generated and supplied by Dr. Rudy Grosschedel (Lin and Grosschedl, 1995). C57BL/6 and 129X1/SvJ mice were obtained from the National Cancer Institute and The Jackson Laboratory (Bar Harbor, ME), respectively, and housed at Yale University School of Medicine. Ebf1+/− and age-matched WT littermate control mice were generated and characterized as described in the SEP. The Yale Medical School Institutional Animal Care and Use Committee approved the purchase and use of all animals.
Cell culture
Cell culture experiments were performed on human WAT adipocytes and mesenchymal stem cells differentiated in vitro. The isolation procedure and culture/differentiation conditions have been described previously (Ehrlund et al., 2013; van Harmelen et al., 2005). In vitro differentiated adipocytes were stimulated with human recombinant TNFα (50 ng/ml, Sigma-Aldrich) for six hours upon which effects on EBF1 mRNA levels were measured.
RNA interference
Human adipocytes differentiated in vitro were transfected with ON-TARGETplus SMARTpool (Thermo Fisher Scientific, Lafayette, CO) targeting EBF1 (L-011848-01) or Non-targeting Control Pool (D-001810-10) siRNA and HiPerfect Transfection Reagent (Qiagen, Hilden, Germany) as described (Kulyte et al., 2013). The cells were incubated for 48–72 hours upon which functional assays were performed and/or RNA/protein and culture media were collected.
RNA isolation, cDNA synthesis and qPCR
Total RNA was extracted using RNeasy Lipid Tissue Mini Kit/miRNeasy mini kit (Qiagen, Hilden, Germany) or NucleoSpin RNA II kit (Macherey-Nagel, Düren, Germany) according to the manufacturers’ instructions. Subsequently, RNA concentration and quality were measured using Nanodrop 2000 spectrophotometer (Thermo Fisher Scientific, Lafayette, CO) and Agilent 2100 Bioanalyzer (Agilent Technologies, Palo Alto, CA) respectively. Messenger RNA was reverse transcribed to cDNA using Omniscript First-strand cDNA synthesis kit (Qiagen) and random hexamer primers (Invitrogen, Carlsbad, CA). Assessment of mRNA expression was performed as described (Pettersson et al., 2011) and relative levels were calculated using a comparative Ct-method, i.e. 2ΔCt-target gene/2ΔCt-reference gene. 18S rRNA and LRP10 (human samples) as well as ACTB (murine samples) were used to normalize the expression of all analyzed genes. TaqMan and SYBR Green assays used in this study are listed in the SEP.
Immunofluorescence and imaging
All analyses were performed in human in vitro differentiated adipocytes as described in detail in the SEP.
Fractionation of WAT
The stroma-vascular fraction of subcutaneous WAT from ten subjects was washed in PBS/0.5%BSA/2mM EDTA buffer and stained with anti-CD45 Pacific blue clone T29/33 (DakoCytomation, Glostrup, Denmark) and anti-CD14 PE (BD Biosciences, New Jersey, USA) antibodies. After washing, cells were re-suspended in PBS/0.1%BSA/2mM/1mMgCl2/25μM DNase buffer, passed through a 70 μm cell mesh (BD Biosciences) and sorted using a FACSAria III cell sorter (BD Biosciences). Leucocytes were defined as CD45+/CD14− while CD45+/CD14+ cells corresponded to the macrophage/monocyte fraction. Cell purity was investigated after each sorting and constituted 95.1 ± 2.9% for the monocyte/macrophage and 98.8 ± 0.87% for the leucocyte fraction.
Glycerol release and glucose transport
The effects of EBF1 knock-down on basal/insulin-stimulated glucose uptake and basal or isoprenaline-stimulated lipolysis in human adipocytes differentiated in vitro were determined as described previously (Dicker et al., 2009; Mejhert et al., 2010).
Protein secretion and Western blot
Protein levels of human IL6, CCL2, TNFα (D6050, DCP00 and QTA00B, R&D Systems, Minneapolis, MN) and adiponectin (10-1193-01, Mercodia, Uppsala, Sweden) in conditioned media were measured using ELISA according to the manufacturer’s instructions. Western blot was performed as described previously (Mejhert et al., 2013). Primary antibodies were PLIN1 (Progen, Heidelberg, Germany), LIPE (Cell Signalling Technologies, Beverly, MA) and βactin (Sigma-Aldrich).
Statistical analyses
Analyses were performed using standard software packages and relevant statistical methods are detailed in the figure legends and under the respective subheadings in the Experimental Procedures. When performing analysis of variance (ANOVA), post-hoc tests were only performed if the overall ANOVA p-value was <0.05. To facilitate the overview of statistical differences in multigroup comparisons, a uniform lettering system was adopted and is explained in detail under each Figure legend. For datasets displaying non-normal distribution, non-parametric statistical tests or log transformed values were used. Error bars in Figure 1 and 4–7 represent standard error of the mean (SEM).
Materials and data
Trancriptional profiles are accessible using Gene Expression Omnibus (GEO) accession number GSE25402 and GSE42680. For ChIP-seq results, both raw and mapped data are available using GEO accession number GSE54889.
Supplementary Material
Highlights.
EBF1 mRNA, protein and activity is reduced in human hypertrophic adipose tissue
The EBF1 regulatory cistrome includes genes controlling lipolysis and adipogenesis
Ebf1+/− mice display WAT hypertrophy and become insulin resistant on high fat diet
TNFα reduces and correlates negatively with EBF1 levels in vitro and in vivo
Acknowledgments
We thank Dr. Rudy Grosschedel (Department of Cellular and Molecular Immunology, Max Planck Institute of Immunobiology and Epigenetics, Germany) for the Ebf1 deficient mice and Elisabeth Dungner, Eva Sjölin, Kerstin Wåhlén, Gaby Åström, Britt-Marie Leijonhufvud, Katarina Hertel and Yvonne Widlund (Department of Medicine (H7), Karolinska Institutet, Sweden) for excellent technical assistance. We also thank Dr. Sylvie Le Guyader (Department of Biosciences and Nutrition, Karolinska Institutet, Sweden) for assistance in microscopic imaging analyses. This work was supported by grants from the Swedish Research Council, the NovoNordisk Foundation, the European Association on the Study of Diabetes together with Eli-Lilly, the Swedish Diabetes Foundation, Diabetes Wellness Fund, the Strategic Research Program in Diabetes at Karolinska Institutet, the National Institute of Diabetes and Digestive and Kidney Diseases; and the National Institute of Arthritis and Musculoskeletal and Skin Diseases/National Institutes of Health grants R24DK092759, RO1AR052690, 1K99DK093711, the Yale Core Center for Musculoskeletal Disorders P30AR046032, the Yale Diabetes Endocrinology Research Center P30DK045735, the Department of Orthopaedics and Rehabilitation, Yale University School of Medicine, the Ministry of Education, Culture, Sports, Science & Technology in Japan and the EU-FP7-Systems microscopy Network of Excellence. Microscopic imaging was performed at the Live Cell Imaging unit at the Department of Biosciences and Nutrition at Karolinska Institutet, supported by grants from The Knut & Alice Wallenberg Foundation, the Center for Biosciences at Karolinska Institutet and the Jonasson donation. H.G., N.M., M.R. and P.A. designed the study, analysed the data and N.M. and M.R. wrote the first version of the manuscript. All authors read, gave input and approved the final version of the manuscript. I.D., M.R. and P.A. generated the clinical data (cohort 1–3). H.G., N.M., X.G., S.S., S.L-C., A.E., Iy.D. and J.L. performed the human adipocyte experiments. J.A.F. M.C.H, P.A., M.R. and N.M. characterized the Ebf1+/− and WT mice. H.G., N.M., E.A., K.D-W. and C.O.D. performed the bioinformatic analyses.
Footnotes
None of the authors declare any competing financial interests.
Publisher's Disclaimer: This is a PDF file of an unedited manuscript that has been accepted for publication. As a service to our customers we are providing this early version of the manuscript. The manuscript will undergo copyediting, typesetting, and review of the resulting proof before it is published in its final citable form. Please note that during the production process errors may be discovered which could affect the content, and all legal disclaimers that apply to the journal pertain.
References
- Akerblad P, Lind U, Liberg D, Bamberg K, Sigvardsson M. Early B-cell factor (O/E-1) is a promoter of adipogenesis and involved in control of genes important for terminal adipocyte differentiation. Mol Cell Biol. 2002;22:8015–8025. doi: 10.1128/MCB.22.22.8015-8025.2002. [DOI] [PMC free article] [PubMed] [Google Scholar]
- Arner E, Mejhert N, Kulyte A, Balwierz PJ, Pachkov M, Cormont M, Lorente-Cebrian S, Ehrlund A, Laurencikiene J, Heden P, et al. Adipose tissue microRNAs as regulators of CCL2 production in human obesity. Diabetes. 2012;61:1986–1993. doi: 10.2337/db11-1508. [DOI] [PMC free article] [PubMed] [Google Scholar]
- Arner E, Ryden M, Arner P. Tumor necrosis factor alpha and regulation of adipose tissue. N Engl J Med. 2010a;362:1151–1153. doi: 10.1056/NEJMc0910718. [DOI] [PubMed] [Google Scholar]
- Arner E, Westermark PO, Spalding KL, Britton T, Ryden M, Frisen J, Bernard S, Arner P. Adipocyte turnover: relevance to human adipose tissue morphology. Diabetes. 2010b;59:105–109. doi: 10.2337/db09-0942. [DOI] [PMC free article] [PubMed] [Google Scholar]
- Arner P, Arner E, Hammarstedt A, Smith U. Genetic predisposition for Type 2 diabetes, but not for overweight/obesity, is associated with a restricted adipogenesis. PLoS One. 2011;6:e18284. doi: 10.1371/journal.pone.0018284. [DOI] [PMC free article] [PubMed] [Google Scholar]
- Berry R, Jeffery E, Rodeheffer MS. Weighing in on adipocyte precursors. Cell Metab. 2014;19:8–20. doi: 10.1016/j.cmet.2013.10.003. [DOI] [PMC free article] [PubMed] [Google Scholar]
- Carvalho BS, Irizarry RA. A framework for oligonucleotide microarray preprocessing. Bioinformatics. 2010;26:2363–2367. doi: 10.1093/bioinformatics/btq431. [DOI] [PMC free article] [PubMed] [Google Scholar]
- Dicker A, Astrom G, Wahlen K, Hoffstedt J, Naslund E, Wiren M, Ryden M, Arner P, van Harmelen V. Primary differences in lipolysis between human omental and subcutaneous adipose tissue observed using in vitro differentiated adipocytes. Horm Metab Res. 2009;41:350–355. doi: 10.1055/s-0028-1112135. [DOI] [PubMed] [Google Scholar]
- Ehrlund A, Mejhert N, Lorente-Cebrian S, Astrom G, Dahlman I, Laurencikiene J, Ryden M. Characterization of the Wnt Inhibitors Secreted Frizzled-Related Proteins (SFRPs) in Human Adipose Tissue. J Clin Endocrinol Metab. 2013 doi: 10.1210/jc.2012-3416. [DOI] [PubMed] [Google Scholar]
- Festa E, Fretz J, Berry R, Schmidt B, Rodeheffer M, Horowitz M, Horsley V. Adipocyte lineage cells contribute to the skin stem cell niche to drive hair cycling. Cell. 2011;146:761–771. doi: 10.1016/j.cell.2011.07.019. [DOI] [PMC free article] [PubMed] [Google Scholar]
- Fretz JA, Nelson T, Xi Y, Adams DJ, Rosen CJ, Horowitz MC. Altered metabolism and lipodystrophy in the early B-cell factor 1-deficient mouse. Endocrinology. 2010;151:1611–1621. doi: 10.1210/en.2009-0987. [DOI] [PMC free article] [PubMed] [Google Scholar]
- Gao H, Falt S, Sandelin A, Gustafsson JA, Dahlman-Wright K. Genome-wide identification of estrogen receptor alpha-binding sites in mouse liver. Mol Endocrinol. 2008;22:10–22. doi: 10.1210/me.2007-0121. [DOI] [PMC free article] [PubMed] [Google Scholar]
- Girousse A, Langin D. Adipocyte lipases and lipid droplet-associated proteins: insight from transgenic mouse models. Int J Obes (Lond) 2012;36:581–594. doi: 10.1038/ijo.2011.113. [DOI] [PubMed] [Google Scholar]
- Griffin MJ, Zhou Y, Kang S, Zhang X, Mikkelsen TS, Rosen ED. Early B-cell factor-1 (EBF1) is a key regulator of metabolic and inflammatory signaling pathways in mature adipocytes. J Biol Chem. 2013;288:35925–35939. doi: 10.1074/jbc.M113.491936. [DOI] [PMC free article] [PubMed] [Google Scholar]
- Gustafson B, Hammarstedt A, Hedjazifar S, Smith U. Restricted adipogenesis in hypertrophic obesity: the role of WISP2, WNT, and BMP4. Diabetes. 2013;62:2997–3004. doi: 10.2337/db13-0473. [DOI] [PMC free article] [PubMed] [Google Scholar]
- Heinz S, Benner C, Spann N, Bertolino E, Lin YC, Laslo P, Cheng JX, Murre C, Singh H, Glass CK. Simple combinations of lineage-determining transcription factors prime cis-regulatory elements required for macrophage and B cell identities. Mol Cell. 2010;38:576–589. doi: 10.1016/j.molcel.2010.05.004. [DOI] [PMC free article] [PubMed] [Google Scholar]
- Hoffstedt J, Arner E, Wahrenberg H, Andersson DP, Qvisth V, Lofgren P, Ryden M, Thorne A, Wiren M, Palmer M, et al. Regional impact of adipose tissue morphology on the metabolic profile in morbid obesity. Diabetologia. 2010;53:2496–2503. doi: 10.1007/s00125-010-1889-3. [DOI] [PubMed] [Google Scholar]
- Jernas M, Palming J, Sjoholm K, Jennische E, Svensson PA, Gabrielsson BG, Levin M, Sjogren A, Rudemo M, Lystig TC, et al. Separation of human adipocytes by size: hypertrophic fat cells display distinct gene expression. Faseb J. 2006;20:1540–1542. doi: 10.1096/fj.05-5678fje. [DOI] [PubMed] [Google Scholar]
- Jimenez MA, Akerblad P, Sigvardsson M, Rosen ED. Critical role for Ebf1 and Ebf2 in the adipogenic transcriptional cascade. Mol Cell Biol. 2007;27:743–757. doi: 10.1128/MCB.01557-06. [DOI] [PMC free article] [PubMed] [Google Scholar]
- Joe AW, Yi L, Even Y, Vogl AW, Rossi FM. Depot-specific differences in adipogenic progenitor abundance and proliferative response to high-fat diet. Stem Cells. 2009;27:2563–2570. doi: 10.1002/stem.190. [DOI] [PubMed] [Google Scholar]
- Kulyte A, Belarbi Y, Lorente-Cebrian S, Bambace C, Arner E, Daub CO, Heden P, Ryden M, Mejhert N, Arner P. Additive effects of miRNAs and transcription factors on CCL2 production in human white adipose tissue. Diabetes. 2013 doi: 10.2337/db13-0702. [DOI] [PubMed] [Google Scholar]
- Li H, Durbin R. Fast and accurate short read alignment with Burrows-Wheeler transform. Bioinformatics. 2009;25:1754–1760. doi: 10.1093/bioinformatics/btp324. [DOI] [PMC free article] [PubMed] [Google Scholar]
- Lin H, Grosschedl R. Failure of B-cell differentiation in mice lacking the transcription factor EBF. Nature. 1995;376:263–267. doi: 10.1038/376263a0. [DOI] [PubMed] [Google Scholar]
- Lonn M, Mehlig K, Bengtsson C, Lissner L. Adipocyte size predicts incidence of type 2 diabetes in women. Faseb J. 2010;24:326–331. doi: 10.1096/fj.09-133058. [DOI] [PubMed] [Google Scholar]
- McLean CY, Bristor D, Hiller M, Clarke SL, Schaar BT, Lowe CB, Wenger AM, Bejerano G. GREAT improves functional interpretation of cis-regulatory regions. Nat Biotechnol. 2010;28:495–501. doi: 10.1038/nbt.1630. [DOI] [PMC free article] [PubMed] [Google Scholar]
- Mejhert N, Laurencikiene J, Pettersson AT, Kaaman M, Stenson BM, Ryden M, Dahlman I. Role of Receptor-Interacting Protein 140 in human fat cells. BMC Endocr Disord. 2010;10:1. doi: 10.1186/1472-6823-10-1. [DOI] [PMC free article] [PubMed] [Google Scholar]
- Mejhert N, Wilfling F, Esteve D, Galitzky J, Pellegrinelli V, Kolditz CI, Viguerie N, Tordjman J, Naslund E, Trayhurn P, et al. Semaphorin 3C is a novel adipokine linked to extracellular matrix composition. Diabetologia. 2013 doi: 10.1007/s00125-013-2931-z. [DOI] [PubMed] [Google Scholar]
- Nofsinger RR, Li P, Hong SH, Jonker JW, Barish GD, Ying H, Cheng SY, Leblanc M, Xu W, Pei L, et al. SMRT repression of nuclear receptors controls the adipogenic set point and metabolic homeostasis. Proc Natl Acad Sci U S A. 2008;105:20021–20026. doi: 10.1073/pnas.0811012105. [DOI] [PMC free article] [PubMed] [Google Scholar]
- Pettersson AT, Mejhert N, Jernas M, Carlsson LM, Dahlman I, Laurencikiene J, Arner P, Ryden M. Twist1 in human white adipose tissue and obesity. J Clin Endocrinol Metab. 2011;96:133–141. doi: 10.1210/jc.2010-0929. [DOI] [PubMed] [Google Scholar]
- Rosen ED, Spiegelman BM. What we talk about when we talk about fat. Cell. 2014;156:20–44. doi: 10.1016/j.cell.2013.12.012. [DOI] [PMC free article] [PubMed] [Google Scholar]
- Skurk T, Alberti-Huber C, Herder C, Hauner H. Relationship between adipocyte size and adipokine expression and secretion. J Clin Endocrinol Metab. 2007;92:1023–1033. doi: 10.1210/jc.2006-1055. [DOI] [PubMed] [Google Scholar]
- Smyth GK. Linear models and empirical bayes methods for assessing differential expression in microarray experiments. Stat Appl Genet Mol Biol. 2004;3:Article3. doi: 10.2202/1544-6115.1027. [DOI] [PubMed] [Google Scholar]
- Stenson BM, Ryden M, Venteclef N, Dahlman I, Pettersson AM, Mairal A, Astrom G, Blomqvist L, Wang V, Jocken JW, et al. Liver X receptor (LXR) regulates human adipocyte lipolysis. J Biol Chem. 2011;286:370–379. doi: 10.1074/jbc.M110.179499. [DOI] [PMC free article] [PubMed] [Google Scholar]
- Subramanian A, Tamayo P, Mootha VK, Mukherjee S, Ebert BL, Gillette MA, Paulovich A, Pomeroy SL, Golub TR, Lander ES, et al. Gene set enrichment analysis: a knowledge-based approach for interpreting genome-wide expression profiles. Proc Natl Acad Sci U S A. 2005;102:15545–15550. doi: 10.1073/pnas.0506580102. [DOI] [PMC free article] [PubMed] [Google Scholar]
- Sun K, Kusminski CM, Scherer PE. Adipose tissue remodeling and obesity. J Clin Invest. 2011;121:2094–2101. doi: 10.1172/JCI45887. [DOI] [PMC free article] [PubMed] [Google Scholar]
- Suzuki H, Forrest AR, van Nimwegen E, Daub CO, Balwierz PJ, Irvine KM, Lassmann T, Ravasi T, Hasegawa Y, de Hoon MJ, et al. The transcriptional network that controls growth arrest and differentiation in a human myeloid leukemia cell line. Nat Genet. 2009;41:553–562. doi: 10.1038/ng.375. [DOI] [PMC free article] [PubMed] [Google Scholar]
- Tan CY, Vidal-Puig A. Adipose tissue expandability: the metabolic problems of obesity may arise from the inability to become more obese. Biochem Soc Trans. 2008;36:935–940. doi: 10.1042/BST0360935. [DOI] [PubMed] [Google Scholar]
- Treiber T, Mandel EM, Pott S, Gyory I, Firner S, Liu ET, Grosschedl R. Early B cell factor 1 regulates B cell gene networks by activation, repression, and transcription-independent poising of chromatin. Immunity. 2010;32:714–725. doi: 10.1016/j.immuni.2010.04.013. [DOI] [PubMed] [Google Scholar]
- van Harmelen V, Skurk T, Hauner H. Primary culture and differentiation of human adipocyte precursor cells. Methods Mol Med. 2005;107:125–135. doi: 10.1385/1-59259-861-7:125. [DOI] [PubMed] [Google Scholar]
- Wang QA, Tao C, Gupta RK, Scherer PE. Tracking adipogenesis during white adipose tissue development, expansion and regeneration. Nat Med. 2013;19:1338–1344. doi: 10.1038/nm.3324. [DOI] [PMC free article] [PubMed] [Google Scholar]
- Weyer C, Foley JE, Bogardus C, Tataranni PA, Pratley RE. Enlarged subcutaneous abdominal adipocyte size, but not obesity itself, predicts type II diabetes independent of insulin resistance. Diabetologia. 2000;43:1498–1506. doi: 10.1007/s001250051560. [DOI] [PubMed] [Google Scholar]
- Virtue S, Vidal-Puig A. Adipose tissue expandability, lipotoxicity and the Metabolic Syndrome--an allostatic perspective. Biochim Biophys Acta. 2010;1801:338–349. doi: 10.1016/j.bbalip.2009.12.006. [DOI] [PubMed] [Google Scholar]
- Zhang Y, Liu T, Meyer CA, Eeckhoute J, Johnson DS, Bernstein BE, Nusbaum C, Myers RM, Brown M, Li W, et al. Model-based analysis of ChIP-Seq (MACS) Genome Biol. 2008;9:R137. doi: 10.1186/gb-2008-9-9-r137. [DOI] [PMC free article] [PubMed] [Google Scholar]
Associated Data
This section collects any data citations, data availability statements, or supplementary materials included in this article.