Abstract
A major objective of brain science research is to model and quantify functional interaction patterns among neural networks, in the sense that meaningful interaction patterns reflect the working mechanisms of neural systems and represent their relationships with the external world. Most current research approaches in the neuroimaging field, however, focus on pair-wise functional/effective connectivity and are thus unable to handle high-order, network-scale functional interactions. In this paper, we propose a novel structurally-weighted LASSO (SW-LASSO) regression model to represent the functional interaction among multiple regions of interests (ROIs) based on resting state fMRI (rsfMRI) data. In particular, the structural connectivity constraints derived from diffusion tenor imaging (DTI) data are used to guide the selection of the weights, thus adaptively adjusting the penalty levels of different coefficients which correspond to different ROIs. The robustness and accuracy of our models are evaluated and demonstrated via a series of carefully designed experiments. In an application example, the generated regression graphs show different assortative mixing patterns between Mild Cognitive Impairment (MCI) patients and normal controls (NC). Our results indicate that the proposed model has promising potential to enable the construction of high-order functional networks and their applications in clinical datasets.
Keywords: High-order functional interaction, LASSO
1 Introduction
One of the major research objectives of brain science is to model and quantify the functional interaction patterns among neural networks at different spatial and temporal scales, in that meaningful interaction patterns reflect the working mechanisms of neural systems and represent their relationships with the external world. However, inferring robust and meaningful interaction patterns from high-dimensional neuroimaging datasets impose significant challenges from computational perspectives. For instance, so far, many previous studies have been focused on the pairwise functional connectivity analyses of networks of brain regions [1–3] based on resting state fMRI (rsfMRI) data. Though these pairwise functional connectivity analyses could provide useful information regarding neural systems, their descriptive power is limited. The major reason is that higher-order functional interactions among brain nodes cannot be captured in pair-wise connectivity analysis. The characterizing difference between functional interaction and connectivity, from a computational perspective, is that functional interaction models the relationship among multiple (n>=3) brain regions, while functional connectivity considers the temporal relationship between only two regions. Fig. 1 shows an example of functional pairwise connectivities (Fig. 1a) and high-order interactions (Fig. 1b) proposed in this paper. In Fig. 1, red and green bubbles represent the target Region of Interest (ROI) and other ROIs we want to study, respectively. With pair-wise analysis, each time we may only examine the functional relationship between the target ROI with one single ROI and obtain a single correlation, no matter what the overall interactions are like within the network. Through our proposed higher-order regression model in this work, however, all other ROIs (green bubbles in Fig. 1b) will be considered simultaneously and those ROIs which have genuine functional interactions with the target ROI would stand out (deep pink bubbles).
Fig. 1.
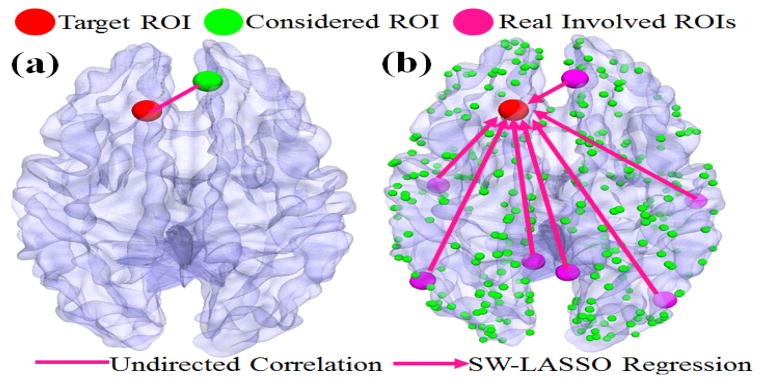
Illustration of pair-wise functional connectivity (a) and high-order interaction (b). Green bubbles represent the candidate ROIs we considered and the deep pink ones are those really involved in our SW-LASSO regression procedure. Undirected line in (a) refers to traditional correlation; Arrows in (b) indicate the direction of the regression.
Intuitively, there are two major advantages of studying higher-order interactions using our methods instead of pair-wise connectivity analysis. First, the latter only focuses on the relationship between two regions. Using Fig. 1a as an example, it can be seen that a pair-wise functional connectivity analysis, e.g., Pearson correlation, will have to examine the correlation between one ROI (red) and other ROIs separately, limiting the information that can be extracted. By using our proposed method (Fig. 1b), though, all ROIs could be simultaneously characterized and those have genuine functional interactions with the target ROI can be identified. Second, our method makes it possible to consider “directionality” when studying functional interactions. Traditional pair-wise functional correlation methods have been limited because of no directional information is available, which is critically important to brain network analysis. In comparison, high-order regression model could compensate to some extent such that the direction of regression will provide an informative reference for further inferring of genuine functional interaction directions among the brain network.
In the literature, there have been several existing methods which attempted to deal with the functional interactions among multiple ROIs such as Independent Component Analysis (ICA) [4], Granger Causality Mapping (GCM) [5–6], dynamic causal modeling (DCM) [7], multivariate autoregressive model (MAR) [8], structural equation modeling (SEM) [9], joint MAR-SEM model [10], and Bayesian graphical models [11–12]. Compared with those published approaches [4–12], our method is novel in the following aspects. First, we used the method in [13] to define 358 cortical ROIs at the connectome scale which encode the most consistent structural connectivities of the human brain. In comparison with the traditional ways for defining ROIs such as those relying on Brodmann brain atlas and image registration methods, these 358 ROIs will offer substantially finer granularity, much better functional homogeneity, much more accurate functional localization, and automatically-established cross-subjects correspondences [13]. In comparison with those methods that are intrinsically limited to brain networks of small sizes [7, 11, 12], our methods can deal with large-scale (e.g., hundreds of) brain ROIs. Second, we propose a novel structurally-weighted LASSO (SW-LASSO) regression model and use it to represent the functional interactions based on rsfMRI data. The LASSO properties ensure that the truly involved ROIs will be effectively selected and structural connectivity constraint will guide the regression process. The neuroscience basis of using structural connectivity information as the weight to constrain the regression process is that if two brain regions have strong structural connections, they tend to have strong functional dependence between each other [14–17]. Our experimental results indicate that the regressed coefficients are relatively robust and reproducible (Section 3.1, 3.2). Moreover, the functional interactions based on the regression result have shown promising potential to enable constructing high-order brain functional networks and studying their dynamic changes (Section 3.3).
2 Methods
The main steps in our proposed framework are outlined in Fig. 2. First, by maximizing the consistency of structural connectivity profiles [13], we predicted the 358 cortical ROIs in the new datasets. Then the structural connectivity patterns among the ROIs were derived from DTI data and used as prior knowledge in our SW-LASSO regression model, along with the rsfMRI BOLD signals. At last, the learned coefficients matrix were normalized and reorganized as series of directed graphs according to their temporal order for further analysis.
Fig. 2.
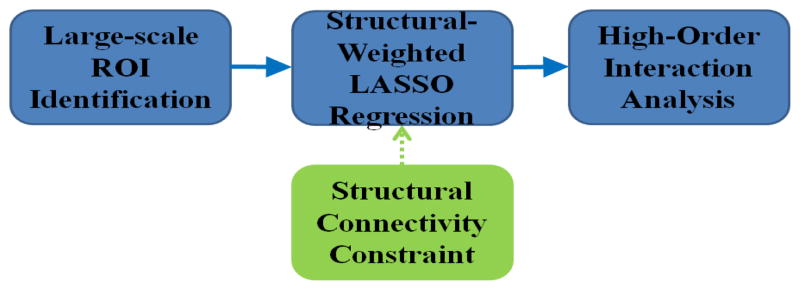
The flowchart of our proposed computational framework
2.1 Dataset Acquisition
We used two independent multimodal DTI/rsfMRI datasets to develop, evaluate and apply the proposed computational framework in Fig. 2.
Dataset 1
Sixteen participants (8 Mild Cognitive Impairment (MCI) patients and 8 normal controls (NC)) were recruited to participate in this study. FMRI and DTI scans were acquired on a GE 3T Signa scanner using an 8-channel head coil. Acquisition parameters were as follows: rsfMRI: 64×64 matrix, 4mm slice thickness, 256×256 FOV, TR=5s, TE=25ms, flip angle = 90°; DTI: 128×128 matrix, 2mm slice thickness, 256mm FOV, 60 slices, TR=17000ms, TE= min-full, 30 optimized gradient directions, b-value=1000. All scans were aligned to the AC-PC line beforehand.
Dataset 2
Twenty participants (10 MCI patients and 10 NC) were recruited and scanned in a 3.0 Tesla scanner (GE Signa EXCITE, GE Healthcare). For rsfMRI, 34 slices were acquired in the same plane (as the low resolution T1-weighted images) using a SENSE inverse-spiral pulse sequence with echo time (TE) = 32 ms, repetition time (TR) = 2 s, FOV = 25.6 cm2, matrix = 64 × 64 × 34, 3.8 mm3. For DTI, 25 direction diffusion-weighted whole-brain volumes were acquired axially parallel to the AC-PC line using diffusion weighting values, b = 0 and 1000 s/mm2, flip angle = 90°, TR = 17 s and TE = 78 ms. The imaging matrix was 256 × 256 with a rectangular FOV of 256 × 256 mm2 and 72 slices with a slice thickness of 2.0 mm.
Preprocessing steps of these two DTI/rsfMRI datasets are similar to those in [13].
2.2 Cortical ROI Identification
Recently, we developed and validated an effective data-driven strategy that discovered 358 consistent cortical ROIs with correspondence in over 240 brains [13]. Each identified ROI was optimized to possess maximal group-wise consistency of DTI-derived fiber shape patterns. In this work, the 358 cortical ROIs are predicted in each of the subjects in section 2.1 and are then used as the network nodes for rsfMRI signal extraction and functional interaction modeling.
It should be noted here that the 358 cortical ROIs are originally constructed on healthy brains. Even though some previous works suggested that structural atrophy can be seen in MCI patients [18], no reports indicate the large scale alternations of structural connectivity exist in MCI patients so far. Therefore we adopted the prediction procedure in [13] and transferred the 358 ROIs to the two MCI datasets described in section 2.1. Briefly, the prediction is similar to the cortical ROI optimization process [13]: the consistency of the structural profiles between the new brain and the ROI models will be maximized as showed in Eq. (1).
| (1) |
where SM represent the cortical ROI models, SN is the new brain that needs to be predicted, DMN is defined as the DTI-derived fiber shape distance [13]. The details of the algorithm can be found in [13].
2.3 LASSO and Weighted LASSO
The LASSO [19] is one of the most commonly used high-dimensional regression models for variable selection, feature prediction, and sparse learning. The LASSO estimates are defined as:
| (2) |
The second term in Eq. (2) is known as the “ℓ1 penalty” which makes the LASSO continuously shrink the coefficients toward zero as λ increases. If λ is large enough, some coefficients will be exactly zero and thus the feature selection is achieved automatically. But the LASSO shrinkage produces biased estimates for those large coefficients, and hence it could be suboptimal considering the estimation risk [20]. Many improved LASSO methods have been proposed in the literature including the adaptive LASSO [20], which tends to assign each covariate different penalty parameters to avoid having larger coefficients penalized more heavily than small coefficients. However, we still face two problems in practice: variable selection is highly unstable and some preferred features are not selected. To alleviate this, we propose to adjust the regression procedure using external or domain constraints.
In this paper, we introduce a novel weighted LASSO model that uses structural connectivity information derived from DTI tractography data as the constraint to construct the weight. The major difference between our method and the adaptive LASSO [20] is that the latter uses ℓ2 initial estimation to adjust and reweight ℓ1 penalty in an iterative algorithm, while our method will decide the weight directly according to the structural brain connectivity analysis based on DTI data. The neuroscience basis of our method is that axonal fiber connections are the structural substrates of functional interactions, and a variety of neuroscience research studies have reported this strong correlation [1, 14–16, 21]. That is, stronger structural connections among ROIs indicate higher functional interactions, and this principle can be used as the biologically meaningful guidance in the search of functional interaction patterns during LASSO regression. Another advantage of introducing the structural connectivity constraint is the consideration of computational complexity: the regression space grows exponentially as the number of ROIs increases [11, 12]. By using meaningful structural information, one can efficiently and effectively reducing the search space, which is grounded on sound neuroscience principle [1, 14–16, 21]. Therefore, in comparison with previous models [4–12], the major methodological advantage of our SW-LASSO model is that it achieves high-order functional interaction modeling while being computationally treatable in dealing with large-scale brain networks.
2.4 Construction of Weights Using Structural Connectivity Constraint
After we predicted the 358 cortical ROIs, we came up with the structural connectivity matrix based on the number of fibers connecting one ROI to the others. As shown in Fig. 3a, the line colors encode the number of fibers between any pair of ROIs (green bubbles). Fig. 3b shows the structural connectivity matrix constructed based on Fig. 3a. Then, for each ROI, we calculated the percentages of the fibers connecting to the other ROIs: fi,j represents the ratio of the number of fibers connecting the i-th and j-th ROI over the total number of fibers connecting to the i-th ROI. Thus, we have , i≠j i≠j and here n=358. In our weighted LASSO regression model, a lower weight value represents a smaller penalty to the corresponding variable, making it more likely to be included in the selected regression model. So we define the weight as:
| (3) |
Fig. 3.

Illustration of constructing weight constraint. (a) Structural connectivity patterns among 358 cortical ROIs. The color of lines encodes the number of fibers between any pair of ROIs. (b) The corresponding structural connectivity matrix of (a). (c) The generated weight matrix based on Eq. (3) when p equals 2.
Fig. 3(c) shows the corresponding weight matrix (p=2), and we can see that stronger structural connectivity will have a lower weight value. Another issue that needs to be noted is that the weight matrix is not symmetric, since fi,j and fj,i are not necessarily equal.
2.5 SW_LASSO Regression
In this section, we will formally define the structural weighted LASSO (SW-LASSO) regression model used in this paper. Suppose we have response yr and k regressors Xr:{x1, x2, …, xk} (k=357). For both responses and regressors, we have N (N=10000) (N=10000) sample values. yr(j) and xr(j) represent the j-th sample value of response and the i-th regressor xi respectively, i=1, 2, …, k and j=1,2, …, N. Then, we perform weighted ℓ1 constrained regression of yr on Xr:
| (4) |
Eq. (4) is similar in concept to the adaptive LASSO [20], but the major difference is that the weight term comes from the DTI-derived structural connectivity, instead of learning from the dataset.
Since we are trying to infer every ROI by the other ROIs, we must make sure that the number of samples is large enough, compared with the 357 regressors. In this paper, we proposed a novel combined spatial-temporal sampling strategy as illustrated in Fig. 4: 1) we divide the rsfMRI BOLD signals into a series of time windows and each time window contains ten time points (represented as T1 to T10 in Fig. 4). The SW-LASSO regression process will be executed for each time window separately; 2) at each time point, we have 1000 groups of regressor samples and in each group the 357 samples (green dots) will be randomly selected from the neighborhood (27 neighbors) of the original ROI (red dots) in the volumetric image space. Hence, we totally achieve ten thousand samples for each round of regression.
Fig. 4.
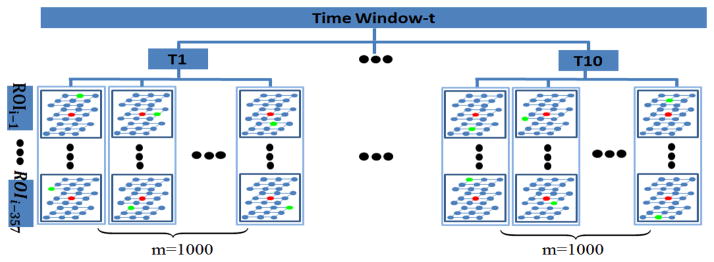
Combined spatial-temporal sampling. As an example, one time window is showed here. Each time window contains ten time points, which are from T1 to T10 (temporal sampling). At each time point, we have 1000 groups of regressor samples and in each group the 357 samples will be randomly selected from the neighborhood of the original ROI in the volumetric image space. The red and green dots represent the original ROI and the real sampling locations, respectively.
In comparison with traditional pair-wise functional connectivity analysis that only considers the temporal correlation of two ROIs [1–3], here, we considered that one ROI is functionally interacting with multiple ROIs in the network, and thus its time series can be regressed by other rsfMRI time series via the optimally weighted linear regression model in Eq. (4). Since the structural connectivity mapping already demonstrated that one ROI could be structurally connected to multiple other ROIs (Figs. 3a–3b), it is reasonable to assume that one ROI may functionally interact with multiple ROIs. During the regression, we fixed p=2 as an experimentally determined value while λ was determined by fivefold cross-validation. It is evident that Eq. (4) is essentially a ℓ1 penalization problem which can be solved very efficiently [20]. In this this work, we adopted the LARS algorithm [22] to computationally solve Eq. (4) based on the widely used SPAMS sparse learning package [23].
3 Experimental Results
This result section includes three parts as follows. Sections 3.1 and 3.2 focus on the evaluation of reproducibility and regression accuracy of the proposed SW-LASSO model. Section 3.3 provides an assortativity analysis based on the learned coefficient matrix which displayed interesting difference between MCI subjects and normal controls.
3.1 Reproducibility of SW-LASSO
In section 2.5, we adopted a novel combined spatial-temporal strategy to achieve enough regression samples. Here, we evaluate the effect of sampling to the final regression result. We randomly picked one subject and repeated the sampling process for three times. The SW-LASSO regression procedure was applied to each round of sampling separately, and the result was shown in Fig. 5(a): four ROIs are displayed on the top two rows of the figure and the regression results are consistent through visual inspection. To quantitatively measure the robustness of proposed sampling method, we define the measure of consistence (MOC) as follows:
| (5) |
where M1 and M2 are two regression matrices; i and j are the indices of row and column. We calculated the MOC between any two rounds and the result is shown in Fig. 5(b). We can clearly see that the MOCs are below 0.1 for all 358 ROIs and most of them are in the range from 0.06 to 0.08, which is very small considering the information loss during the regression process. Notably, we achieved similar experimental results in Fig. 5 for other subjects, suggesting the robustness and reproducibility of the SW-LASSO model.
Fig. 5.
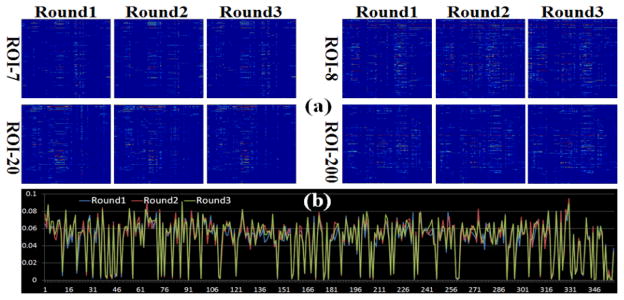
Reproducibility of combined spatial-temporal sampling. The regression results of four ROIs in three independent sampling rounds are shown in (a). (b) shows the MOC (vertical axis) of all 358 ROIs (horizontal axis).
3.2 Accuracy of SW-LASSO
To measure how well the proposed structurally-weighted LASSO regression model fits the rsfMRI signals, or how well each of the cortical ROI’s rsfMRI signal can be predicted by other 357 ROIs’ rsfMRI signals, we employed the coefficient of determination (COD) [24] as a quantitative metric, and the results are shown in Fig. 6. From the figure, we can see that the fMRI BOLD signals of most cortical ROIs can be explained or represented by the other ROIs with more than 60%. Considering the low SNR of fMRI signals, the average COD value is 70%, which is quite satisfactory. This result suggests that the SW-LASSO can reasonably model high-order functional interactions among brain ROIs. One possible reason that might lead to the fact that around 30% fMRI signals are unpredictable is that some interacting functional regions are still not covered by the current 358 cortical ROIs. Once denser cortical ROIs are included in the future, the average COD value by the SW-LASSO could be improved.
Fig. 6.

Evaluation of accuracy for 358 cortical ROIs. COD values are shown in the vertical direction and the horizontal axis shows the cortical ROI index.
3.3 Assortative Analysis
Because the learned coefficients cannot be directly compared across different subjects, we need to normalize them before further analysis. Thus, we reorganized the data according to the temporal order, and for each time window we had a 358*358 matrix as shown in Fig. 7. Actually, this matrix describes the overall regression dependency within a specific small time period. By doing this, we acquired a series of directed graphs automatically, each of which encodes the high-order interactions among 358 cortical ROIs.
Fig. 7.
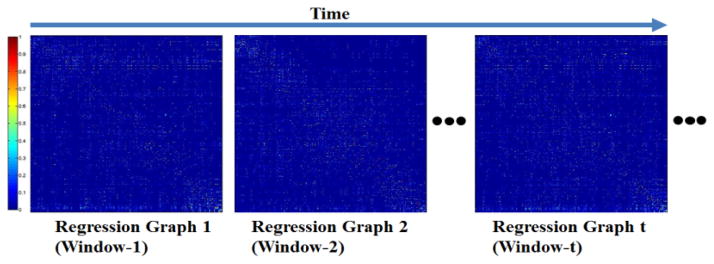
Generated regression graphs along with the temporal order. Each regression graph is a 358*358 matrix which encodes the high-order functional interactions among the 358 cortical ROIs.
In this paper, we adopted the assortative [25] analysis on the generated graphs of two independent MCI datasets. Nodes in a network might show preference of connecting to other nodes that either have the similar (assortative mixing) or opposite properties (disassortative mixing), and in most cases the properties refer to the degree of the node. The type of mixing can be determined by assortativity coefficient which is defined as below:
| (6) |
where j, k represent the degree of two ends of edge and q, ejk are the distribution of remaining degree and joint probability distribution of the remaining degrees of the two nodes, respectively. Put simply, the assortativity coefficient reflects the Pearson correlation between the degrees of pairs of linked nodes. R ranges from −1 to 1, which correspond to complete disassortative and perfect assortative.
We calculated the assortativity coefficient for both MCI datasets and found a very interesting result, as shown in Fig. 8. Specifically, the regression graphs of normal controls showed obvious disassortative mixing. MCI patients, however, tend to display assortative mixing. Remarkably, this observation is reproducible in two independent multimodal MCI datasets, as shown in Figs. 8a and 8b. This suggests that in healthy brains, the active regions which often functionally interact with many other regions tend to communicate with those regions with little interactions. On the contrary, in MCI patients, the active regions tend to interact with other active regions as well. Notably, this result has supporting evidence from the literature report [26] on the default mode network (DMN): the DMN ROIs in Alzheimer’s disease subjects tend to functionally interact with more other DMN ROIs than healthy controls. That is, Alzheimer’s disease might initially involve DMN regions, which results in Alzheimer’s patients demonstrating higher-functional activity in the DMN than healthy controls.
Fig. 8.

(a) and (b) display the results of assortative mixing analysis on two separate MCI datasets. Horizontal axis shows the assortativity coefficient and the vertical axis represents the number of regression graphs.
4 Discussion and Conclusion
In this paper, we proposed a novel SW-LASSO regression model to represent the higher-order functional interactions among large-scale cortical ROIs in brain networks. Our major methodological contribution is that by introducing meaningful structural connectivity constraint, we can effectively examine the functional dependences of ROIs within the large-scale brain network. Since the search space grows exponentially with the increment of the number of brain ROIs we are considering, using the structural connectivity constraint to prune the ROI candidates is an efficient and effective strategy, considering the close relationship between the brain’s structural connection and function. Therefore, the SW-LASSO model achieves a desirable trade-off between modeling high-order functional interaction and being computationally efficient in dealing with large-scale brain networks. Our experimental evaluation results have demonstrated the reasonably good robustness and accuracy of the proposed SW-LASSO model in characterizing high-order functional interactions. Importantly, the application of the SW-LASSO regression model in two separate MCI datasets revealed interesting findings, lending further support to the effectiveness and usefulness of the proposed methods.
Notably, the SW-LASSO regression model also has limitations, partly due to several key challenges in modeling high-order functional interactions. First, as pointed out in the literature [11], a major challenge in modeling multivariate functional interactions stems from the astronomical size of the possible space of alternative graph models. If represented as a graph, the number of possible directed interaction graph structures relating N brain regions or regions of interest (ROIs) is 4((N−1)*N)/2. However, the current SW-LASSO regression model in Eq.(4) only considers a small portion of possible alternative graph structures. In the future, more types of graph structures such as the chain-dependency structures [27] should be considered. Second, the current SW-LASSO regression model cannot deal with the temporal dynamics of functional interactions. Essentially, there is growing evidence from the literature [28–29] indicating that functional connectivities/interactions are under dynamic state changes at different time scales, even in resting state. It is still largely unknown how frequently high-order functional interactions within brain networks temporally transit and what the underlying principles are. In the future, the SW-LASSO regression model should be extended to account for temporal dynamics, in order to investigate those dynamic phenomena and principles.
References
- 1.Honey CJ, Sporns O, Cammoun L, Gigandet X, Thiran JP, Meuli R, Hagmann P. Predicting human resting-state functional connectivity from structural connectivity. PNAS. 2009;106(6):2035–2040. doi: 10.1073/pnas.0811168106. [DOI] [PMC free article] [PubMed] [Google Scholar]
- 2.Fox MD, Raichle ME. Spontaneous fluctuations in brain activity observed with functional magnetic resonance imaging. Nat Rev Neurosci. 2007;8:700–711. doi: 10.1038/nrn2201. [DOI] [PubMed] [Google Scholar]
- 3.Bullmore E, Sporns O. Complex brain networks: graph theoretical analysis of structural and functional systems. Nat Rev Neurosci. 2009;186(10) doi: 10.1038/nrn2575. [DOI] [PubMed] [Google Scholar]
- 4.Calhoun VD, Adali T, Pearlson GD, Pekar JJ. A method for making group inferences from functional MRI data using independent component analysis. Hum Brain Mapping. 2001;14(3):140–151. doi: 10.1002/hbm.1048. [DOI] [PMC free article] [PubMed] [Google Scholar]
- 5.Roebroeck A, Formisano E, Goebel R. Mapping directed influence over the brain using Granger Causality and fMRI. NeuroImage. 2005;25:230–242. doi: 10.1016/j.neuroimage.2004.11.017. [DOI] [PubMed] [Google Scholar]
- 6.Deshpande G, Santhanam P, Hu X. Instantaneous and causal connectivity in resting state brain networks derived from functional MRI data. NeuroImage. 2011;54(2):1043–1052. doi: 10.1016/j.neuroimage.2010.09.024. [DOI] [PMC free article] [PubMed] [Google Scholar]
- 7.Friston KJ, Harrison L, Penny W. Dynamic causal modelling. NeuroImage. 2003;19(3):1273–1302. doi: 10.1016/s1053-8119(03)00202-7. [DOI] [PubMed] [Google Scholar]
- 8.Harrison L, Penny WD, Friston K. Multivariate autoregressive modeling of fMRI time series. NeuroImage. 2003;19:1477–1491. doi: 10.1016/s1053-8119(03)00160-5. [DOI] [PubMed] [Google Scholar]
- 9.Protzner AB, McIntosh AR. Testing effective connectivity changes with structural equation modeling: what does a bad model tell us? Hum Brain Mapp. 2006;27:935–947. doi: 10.1002/hbm.20233. [DOI] [PMC free article] [PubMed] [Google Scholar]
- 10.Kim J, Zhu W, Chang L, Bentler PM, Ernst T. Unified Structural Equation Modeling Approach for the Analysis of Multisubject, Multivariate Functional MRI Data. Human Brain Mapping. 2007;28:85–93. doi: 10.1002/hbm.20259. [DOI] [PMC free article] [PubMed] [Google Scholar]
- 11.Ramsey J, Hanson S, Hanson C, Halchenko Y, Poldrack R, Glymour C. Six problems for causal inference from fMRI. NeuroImage. 2010;49(2):1545–1558. doi: 10.1016/j.neuroimage.2009.08.065. [DOI] [PubMed] [Google Scholar]
- 12.Ramsey JD, Hanson SJ, Glymour C. Multi-subject search correctly identifies causal connections and most causal directions in the DCM models of the Smith et al. simulation study. NeuroImage. 2011;58(3):838–848. doi: 10.1016/j.neuroimage.2011.06.068. [DOI] [PubMed] [Google Scholar]
- 13.Zhu D, Li K, Guo L, Jiang X, Zhang T, Zhang D, Chen H, Deng F, Faraco C, Jin C, Wee C, Yuan Y, Lv P, Yin Y, Hu X, Duan L, Hu X, Han J, Wang L, Shen D, Miller LS, Li L, Liu T. DICCCOL: Dense Individualized and Common Connectivity-based Cortical Landmarks. Cerebral Cortex. 2012;23(4):786–800. doi: 10.1093/cercor/bhs072. [DOI] [PMC free article] [PubMed] [Google Scholar]
- 14.Li K, Guo L, Faraco C, Zhu D, Deng F, Zhang T, Jiang X, Zhang D, Chen H, Hu X, Miller LS, Liu T. NIPS. 2010. Individualized ROI Optimization via Maximization of Group-wise Consistency of Structural and Functional Profiles. [Google Scholar]
- 15.Zhu D, Zhang D, Faraco C, Li K, Deng F, Chen H, Jiang X, Guo L, Miller LS, Liu T. Discovering Dense and Consistent Landmarks in the Brain. In: Székely G, Hahn HK, editors. IPMI 2011 LNCS. Vol. 6801. Springer; Heidelberg: 2011. pp. 97–110. [DOI] [PubMed] [Google Scholar]
- 16.Zhu D, Li K, Faraco C, Deng F, Zhang D, Jiang X, Chen H, Guo L, Miller LS, Liu T. Optimization of Functional Brain ROIs via Maximization of Consistency of Structural Connectivity Profiles. NeuroImage. 2011;59:1382–1393. doi: 10.1016/j.neuroimage.2011.08.037. [DOI] [PMC free article] [PubMed] [Google Scholar]
- 17.Honey CJ, Sporns O, Cammoun L, Gigandet X, Thiran JP, Meuli R, Hagmann P. Predicting human resting-state functional connectivity from structural connectivity. PNAS. 2009;106(6):2035–2040. doi: 10.1073/pnas.0811168106. [DOI] [PMC free article] [PubMed] [Google Scholar]
- 18.Karas G, Sluimer J, Goekoop R, Flier W, Rombouts SARB, Vrenken H, Scheltens P, Fox N, Barkhof F. Amnestic mild cognitive impairment: structural MR imaging findings predictive of conversion to Alzheimer disease. AJNR. 2008;29(5):944–949. doi: 10.3174/ajnr.A0949. [DOI] [PMC free article] [PubMed] [Google Scholar]
- 19.Tibshirani R. Regression shrinkage and selection via the LASSO. Journal of the Royal Statistical Society. 1996;58:267–288. [Google Scholar]
- 20.Zou H. The adaptive lasso and its oracle properties. J Amer Statist Assoc. 2006;101(476):1418–1429. [Google Scholar]
- 21.Passingham RE, Stephan KE, Kötter R. The anatomical basis of functional localization in the cortex. Nat Rev Neurosci. 2002;3(8):606–616. doi: 10.1038/nrn893. [DOI] [PubMed] [Google Scholar]
- 22.Efron B, Hastie T, Johnstone I, Tibshirani R. Least Angle Regression. The Annals of Statistics. 2004;32:407–499. [Google Scholar]
- 23.http://www.di.ens.fr/willow/SPAMS/
- 24.Dougherty ER, Kim S, Chen YD. Coefficient of determination in nonlinear signal processing. Signal Process. 2000;80(10):2219–2235. [Google Scholar]
- 25.Newman MEJ. Assortative Mixing in Networks. Physical Review Letters. 2002;89 doi: 10.1103/PhysRevLett.89.208701. [DOI] [PubMed] [Google Scholar]
- 26.Bero AW, Yan P, Roh JH, Cirrito JR, Stewart FR, Raichle ME, Lee JM, Holtzman DM. Neuronal activity regulates the regional vulnerability to amyloid-beta deposition. Nature Neuroscience. 2011;14:750–756. doi: 10.1038/nn.2801. [DOI] [PMC free article] [PubMed] [Google Scholar]
- 27.Neapolitan RE. Learning Bayesian Networks. Prentice Hall; 2004. [Google Scholar]
- 28.Chang C, Gary GH. Time - frequency dynamics of resting-state brain connectivity measured with fMRI. NeuroImage. 2010;50(1):81–98. doi: 10.1016/j.neuroimage.2009.12.011. [DOI] [PMC free article] [PubMed] [Google Scholar]
- 29.Majeed W, Magnuson M, Hasenkamp W, Schwarb H, Schumacher EH, Barsalou L, Keilholz SD. Spatiotemporal dynamics of low frequency BOLD fluctuations in rats and humans. NeuroImage. 2011;54:1140–1150. doi: 10.1016/j.neuroimage.2010.08.030. [DOI] [PMC free article] [PubMed] [Google Scholar]


