

Summary
Background
Inosine 5′-monophosphate dehydrogenase (IMPDH) is a target of the immunosuppressive drug, mycophenolic acid (MPA). A twelve hour clinical pharmacokinetic and pharmacodynamic study was conducted to study the effects of diabetes on IMPDH type I and -II gene expression, protein level and enzymatic activity.
Methods
The effects were studied on nondiabetic (ND, n=11) and diabetic (D, n=9) kidney transplant recipients as well as on non-transplant nondiabetic (n=10) and diabetic (n=10) volunteers.
Results
Diabetes significantly reduced the gene expression using area under the effect curve of IMPDH-I [ND: 22.1 (13.8-31.3) vs. D: 4.5 (2.3-6.5), P<0.001] and IMPDH-II [ND: 15.3 (11.0-21.7) vs. D: 6.1 (4.6-8.6), P<0.001], protein level [IMPDH-I, ND: 1.0 (0.5-1.3) vs. 0.5 (0.4-0.7), P=0.002; IMPDH-II, ND: 1.0 (0.6-1.6) vs. D: 0.7 (0.6-0.8) P<0.001] and enzymatic activity [ND: 180 (105-245) vs. D: 29.9 (15.3-35.6) μmol/s/mol adenosine monophosphate, P<0.001] in transplant recipients. Similar results were observed in non-transplanted volunteers. Kinetic studies of mycophenolic acid-mediated suppression of IMPDH activity in non-transplanted individuals revealed an approximately 2.5-fold lower half-maximum effective concentration (EC50) for diabetic as compared with nondiabetic [ND: 50.2 (49.8-50.7) vs. D: 15.8 (15.6-16.3) nmol/l, P=0.004] volunteers. The lower IMPDH gene expression or activity in diabetic patients could not be explained by the difference in IMPDH gene polymorphism.
Conclusions
This study clearly indicates a significant downregulation effect of IMPDH gene expression, protein level as well as activity in diabetic patients. Further clinical studies in a larger number of patients are warranted to verify whether MPA dosing require to be optimized for kidney transplant recipients with diabetes mellitus.
Keywords: diabetes mellitus; IMPDH, inosine monophosphate dehydrogenase; MPA, mycophenolic acid; pharmacokinetics; pharmacodynamics
Introduction
Mycophenolic acid (MPA) is an antiproliferative agent that is widely used to prevent rejection after organ transplantation [1]. It inhibits inosine 5′-monophosphate dehydrogenase (IMPDH), an enzyme that is essential for cell proliferation [2]. Both IMPDH type I (IMPDH-I) and type II (IMPDH-II) enzymes catalyze the nicotinamide adenine dinucleotide-dependent oxidation of inosine 5′-monophosphate (IMP) to xanthosine 5′-monophosphate (XMP). This is the rate-limiting step in the de novo pathway for guanine nucleotide biosynthesis in B and T lymphocytes [3]. In addition, IMPDH contributes to the synthesis of membrane glycoproteins and adhesion molecules that are involved in the recruitment and transendothelial infiltration of lymphocytes into a transplanted organ. The inhibition of IMPDH activity by MPA leads to reduced proliferation and recruitment of these cells to areas of inflammation, thus preventing allograft rejection [4].
Human IMPDH enzymes are encoded by IMPDH-I and -II genes, located on two different chromosomes (chromosomes 3 and 7, respectively) with 85% of their amino acid sequence conserved [4] [5]. The two enzymes are similar in size (56 kDa, 514 amino acids) but differ with respect to inhibition rate constants and affinity. Some studies suggest that the IMPDH-I enzyme is constitutive and dominant in most cell types [e.g., retina, spleen, resting peripheral blood mononuclear cells (PBMCs)], whereas the IMPDH-II enzyme is amplified during proliferation and transformation [6, 7]. Mycophenolic acid has been shown to inhibit the activities of both IMPDH enzymes in human lymphocyte [3]. However, IMPDH-II is approximately five times more sensitive to inhibition by MPA, with an inhibition constant (Ki) value of 33 nM for IMPDH-I versus 7 nM for IMPDH-II [2]. Moreover, the values of IMPDH activity measured ex vivo, in peripheral blood mononuclear cells, have been shown to associate with post transplant outcomes including biopsy proven acute rejection [8-11].
Approximately 30 - 40% of all kidney transplant recipients in the United States are diabetic before transplantation [12]. In addition, between 15 - 20% of patients who were not diabetic at the time of transplantation, develop diabetes shortly after the operation; a condition that is known as New Onset Diabetes After Transplant (NoDAT) [1]. We have previously reported significantly lower IMPDH activity in kidney transplant recipients with diabetes mellitus [13]. However, it was not known, whether the reduced IMPDH activity in diabetic transplant recipients is associated with a reduced IMPDH gene and/or protein expression or is present in non-transplanted individuals who have diabetes mellitus. Thus, the aim of the present study was to characterize IMPDH-I and -II gene and protein expression and enzyme activity in nondiabetic and diabetic kidney transplant recipients, as well as, non-transplanted individuals.
Methods
Patients
Demographic information for all subjects is given in Table 1. Subjects participated in this study after providing written informed consent. The study was approved by the Institutional Review Board of Rhode Island Hospital, Providence, RI, USA (CMT#209708) and the University of Rhode Island (HU#0708-040). All subjects underwent physical examinations and provided a medical history. Determination of serum biochemistry and HbA1c levels was performed at LabCorp (Raritan, NJ, USA).
Table 1. Demographic characteristic of kidney transplant recipients (part 1) or non-transplanted individuals (part 2).
| Clinical details of nondiabetic and diabetic kidney transplant recipients | |||
|---|---|---|---|
|
| |||
| Nondiabetic, TxND (n=11) | Diabetic, TxD (n=9) | P value | |
| Gender (male/female) | 6/5 | 5/4 | - |
| Age (years) | 55.0 (51.2-62.2) | 56.0 (47.2-59.7) | P=0.790 |
| Ethnicity | C(7), AA(2), A(1), H(1) | C(7), AA (0), A(1), H(1) | - |
| BMI (kg/m2) | 29.9 ± 5.8 | 30.4 ± 4.1 | P=0.841 |
| Diabetes type (type 1/type 2) | - | 1/8 | - |
| Insulin treatment | - | 7 | - |
| Glycated hemoglobin, HbA1c (%) | 5.2 (4.8-5.6) | 7.1 (6.0-10.2) | P<0.001 |
| Fasting glucose (mg/dl) | 87.0 (79.7-94.0) | 128 (122-227) | P=0.002 |
| Albumin (g/l) | 4.2 ± 0.3 | 4.1 ± 0.3 | P=0.520 |
| Aspartate aminotransferase, AST (units/l) | 23.0 ±8.9 | 34.0 ± 14.7 | P=0.054 |
| Alanine aminotransferase, ALT (units/l) | 17.8 ± 6.3 | 22.2 ± 8.0 | P=0.187 |
| Time post-kidney transplantation (<1 year/1-2 years/> 2 years) | 2/1/8 | 0/1/8 | P=0.403 |
| Serum creatinine (mg/dl) | 1.75 ± 0.86 | 1.78 ± 0.49 | P=0.948 |
| MPA dose (mg/day) | 1363 ± 636 | 1191 ± 467 | P=0.507 |
| Sirolimus daily dose (mg/day) | 2.5 ± 0.8 | 2.0 ± 0.5 | P=0.164 |
| Prednisone dose (mg/day) | 5.1 ± 2.2 | 5.0 ± 2.5 | P=0.933 |
| Clinical details of nondiabetic and diabetic non-transplanted individuals | |||
|---|---|---|---|
|
| |||
| Nondiabetic, ND (n=10) | Diabetic, D (n=10) | P value | |
| Gender (male/female) | 4/6 | 5/5 | - |
| Age (years) | 60.3 ± 5.3 | 57.2 ± 6.5 | P=0.256 |
| Ethnicity | C(10) | C(10) | - |
| BMI (kg/m2) | 29.9 ± 3.5 | 27.7 ± 4.6 | P=0.246 |
| Diabetes type (type 1/type 2) | - | 1/9 | - |
| Glycated hemoglobin, HbA1c (%) | 5.3 (5.1-5.8) | 5.9 (5.6-6.3) | P=0.014 |
| Glucose (mg/dl) | 121 (92.0-131) | 149 (97.0-177) | P=0.151 |
| Serum creatinine (mg/dl) | 0.95 ± 0.15 | 1.04 ± 0.25 | P=0.671 |
A, Asian-American; AA, African-American; C, Caucasian; H, Hispanic. Plus-minus values are mean ± standard deviation; non-normally distributed data are expressed as median and interquartile range.
Transplant recipients included nondiabetic (TxND, n=11) and diabetic (TxD, n=9) kidney allograft recipients >6 months post-transplant. All transplant recipients were on steady-state treatment with MPA (Cellcept®, Roche Pharmaceuticals, Nutley, NJ, USA), sirolimus (Rapamune®, Wyeth Pharmaceuticals, Philadelphia, PA, USA) and prednisone. For determination of MPA concentration, blood samples (5 ml) were collected in EDTA Vacutainer® (Becton Dickinson, Franklin Lakes, NJ, USA) before morning dose and at 0.25, 0.5, 1, 1.5, 2, 3, 5, 7, 9, 10 and 12 hours post-dose; plasma was separated and stored at -80°C until analyzed. For determination of pharmacodynamic indices, blood samples (8 ml) were obtained before the morning dose and at 1, 2, 4 and 12 hour after MPA dose using Sodium Heparin Vacutainer® (Becton Dickinson). The PBMCs were isolated by centrifugation at 1650xg for 25 min over Ficoll-paque gradient on BD Vacutainer®CPT,™ as recommended by the manufacturer. Isolated cells were washed with ice-cold phosphate buffer saline (pH 7.4), resuspended and stored at -80°C as described previously [14]. No significant change in the PBMC count was found between Vacutainer®CPT™ and the classical Ficoll-Paque™ method involving Leucosep™ tubes with porous barriers (Greiner, Frickenhausen, Germany).
Non-transplanted individuals included nondiabetic (ND, n=10) and diabetic (D, n=10) subjects with normal kidney function that had never received an organ transplant or were treated with MPA (MPA naive). A single sodium heparin anti-coagulated blood sample was collected from each patient between 8:00 - 9:00 AM and PBMCs were isolated as described above.
MPA measurement
Plasma concentration of total MPA, MPAG and AcMPAG was quantified by HPLC with ultraviolet detection as described previously [14].
Gene expression of IMPDH
Total RNA was extracted from PBMCs using the High Pure RNA Isolation Kit (Roche Diagnostics Corporation, Indianapolis, IN, USA), as recommended by the manufacturer [15]. Amplification of IMPDH-I and -II cDNA was performed on an ABI 7500 rtPCR instrument (Applied Biosystems, Carlsbad, CA, USA) using the corresponding TaqMan Gene Expression Assay (IMPDH-I, Hs00265302_m1; IMPDH-II, Hs00168417_m1). Relative mRNA levels were estimated using the 2-ΔΔCT method with ribosomal protein L13a (RPL13A, Hs00379921_m1) and pseudogene 17 polymerase (RNA) II (DNA-directed) polymerase A (POLR2A, Hs00172187_m1) as reference genes [16].
Western blot analysis
Relative amounts of IMPDH-I and -II in PBMC lysate were determined by immunoblot analysis [17]. For each lane, 40 μg of total protein was loaded on the gel. Expressed IMPDH-I and -II proteins (Novus Biologicals, LLC, Littleton, CO), were used as reference standards. Rabbit anti-human IMPDH-I and -II was a generous gift from Vertex Pharmaceuticals, Inc. (Cambridge, MA, USA). Antibodies used for IMPDH-I and -II were specific, with no cross-reactivity with each other, as described previously [18]. Beta-actin was used as a housekeeping protein employing rabbit anti-human antibody (Abcam Inc., Cambridge, MA, USA).
Determination of IMPDH activity
The IMPDH activity was measured using an assay described by previously with slight modifications [19]. To improve the sensitivity of the XMP detection method, the concentrations of XMP and intracellular AMP were measured using a LC-MS/MS method in positive ionization mode [20, 21]. The system comprised of a binary pump and autosampler (Shimadzu, Kyoto, Japan) coupled to an API 3200 triple quadruple mass spectrometric detector (AB Sciex, Toronto, Ontario, Canada), equipped with Turbo V source electrospray ionization (ESI) probe. The chromatographic data were collected and analyzed using the Analyst® package (version 1.4.1., AB Sciex). The analytes were separated on a Zorbax SB-Phenyl analytical column (Narrow Bore RR, 2.1×100 mm, 1.80 μm) from Agilent Technologies (Forest City, CA, USA). Analysis was performed using HPLC-grade water (solvent A) and HPLC-grade acetonitrile (solvent B). The mobile phase comprised of the following mixtures (v/v): A:B 98:2 for 0.0-2.5 min; A:B 95:5 for 2.6-3.5 min; A:B 90:10 for 3.6-4.5 min; A:B 25:75 for 4.6-6.0 min; A:B 25:75 for 6.1-7.0 min; A:B 98:2 for 7.0-7.5 min; A:B 98:2 for 7.6-10.0 min. Flow rate was 100 μl/min as shown in the Supplementary material (Figure S1), the retention times for XMP (365→153) and intracellular AMP (348→136) were 3.53 and 4.35 min, respectively.
Before the start of the reaction, total protein concentrations in PBMC lysate were measured using a bicinchoninic acid method (Pierce-Fisher, Rockford, IL, USA) and an aliquot containing 50 μg/ml of total protein was used for each reaction. The rate of XMP production by IMPDH was normalized to incubation time (90 min) and intracellular AMP concentration as reported previously [19]. The calibration curves were linear and the coefficient of determination (r2) was 0.9994 for XMP and 0.9981 for AMP. The lower limit of quantitation (LLOQ) was 2.50 nmol/l for XMP and 1.00 nmol/l for AMP.
Estimation of IMPDH inhibition kinetics in vitro
The inhibition of IMPDH activity, in response to varying concentrations of MPA added to PBMCs, was performed to compare the kinetics of IMPDH inhibition between ND and D MPA naive individuals. Lysate of PBMCs containing 30 μg/ml of total protein were pre-incubated for 10 min at 37 °C with MPA at eight different concentrations (0, 1, 5, 10, 50, 100, 250 and 1000 nmol/l) and were incubated for determination of enzyme activity as described in the previous section. Kinetic parameters were calculated using the empirical maximum-effect model E = E0-(CMPA × Emax)/(CMPA + EC50), where E0 is the baseline value for the biological response, Emax is the asymptotic effect and EC50 is the drug concentration that results in 50% of the maximal effect.
Genotyping of IMPDH
Genomic DNA was extracted from peripheral blood mononuclear cells using QIAamp blood kit (Qiagen, Valencia, CA, USA) and was stored at -80°C until analyzed. Genotyping of five different polymorphisms was performed on an ABI 7500 Real-Time-PCR instrument (Applied Biosystems, Toronto, Ontario, Canada) using a validated TaqMan allelic discrimination assay [IMPDH-I 106 G>A (rs2278294), IMPDH-I 125G>A (rs2278293), IMPDH-I 1572C>T (rs2228075) and IMPDH-II 3624 A>G (rs4974081), IMPDH-II 3757 T>C (rs11706052)].
Data analysis
Non-compartmental pharmacokinetic or pharmacodynamic analysis was performed by the use of WinNonlin version 5.2 (Pharsight Co., Mountain View, CA, USA). The AUC0-12 for MPA was calculated using the linear trapezoidal rule. Five samples were used to calculate AUEC values for gene expression or IMPDH activity. As described previously [22], individual pre-dose value for gene expression or activity was considered a baseline and then area below the baseline was calculated as a measure of repression, whereas the area above the baseline was considered a measure of induction.
Statistical analysis
Statistical analysis was carried out with SPSS software (version 19, IBM SPSS, Chicago, IL, USA). Kolmogorov-Smirnov's method was used to test for normal distribution. The differences between nondiabetic and diabetic groups were determined by using the Mann-Whitney U-test, P values <0.05 were considered statistically significant. Normally distributed data are expressed as mean ± standard deviation (SD); non-normally distributed data are expressed as median and interquartile range.
Results
Table 1 summarizes the demographics of the transplant recipients (part 1) and non-transplanted individuals (part 2). Kidney function, as judged by serum creatinine concentrations, was comparable between TxND and TxD and all non-transplanted individuals had an adequate kidney function. However, for both populations, the levels of serum glucose and glycated hemoglobin (HbA1c) were higher in diabetic individuals. The doses of immunosuppressive agents were not significantly different between TxND and TxD with a trend toward lower MPA or sirolimus doses in the TxD group. Seven out of nine TxD and all non-transplanted individuals with diabetes (D) were on insulin therapy.
MPA pharmacokinetics in transplant recipients
The values of MPA area under the concentration-time curve (AUC0-12) were comparable between TxND and TxD groups (Table 2). Partial AUC values for MPA (AUC0-6 or AUC6-12) as well as AUC values for MPA-glucuronide and MPA-acyl glucuronide metabolites were also comparable (data are not presented).
Table 2. Comparison of mycophenolic acid (MPA) pharmacokinetics and Inosine Monophosphate Dehydrogenase (IMPDH) gene expression and activity in nondiabetic and diabetic kidney transplant recipients (part 1) and non-transplanted individuals (part 2).
| MPA pharmacokinetic and pharmacodynamic parameters in kidney transplant recipients | |||
|---|---|---|---|
|
| |||
| Nondiabetic, TxND (n=11) | Diabetic, TxD (n=9) | P value | |
| MPA AUC0-12 (mg*hr/l) | 29.2 (18.6-54.0) | 27.6 (16.8-38.3) | P=0.640 |
| AUEC IMPDH-I mRNA | |||
| Repression | 0.10 (0.00, 0.41) | 2.95 (1.69, 4.39) | P=0.001 |
| Induction | 12.06 (5.79, 13.53) | 0.00 (0.00, 0.21) | P<0.001 |
| AUEC IMPDH-II mRNA | |||
| Repression | 0.02 (0.00, 0.51) | 0.60 (0.07, 0.78) | P=0.180 |
| Induction | 4.49 (1.29, 8.68) | 0.58 (0.06, 1.62) | P=0.012 |
| AUEC IMPDH activity (μmolXMP/s/mol AMP*hr) | |||
| Repression | 0.18 (0.00, 6.75) | 21.6 (14.1, 34.5) | P<0.001 |
| Induction | 61.6 (29.9, 101.5) | 0.00 (0.00, 0.00) | P<0.001 |
| Markers of IMPDH activity and gene expression in non-transplanted individuals | |||
|---|---|---|---|
|
| |||
| Nondiabetic, ND (n=10) | Diabetic, D (n=10) | P value | |
| IMPDH-I mRNA | 1.00 (0.19-2.40) | 0.14 (0.02-0.38) | P=0.024 |
| IMPDH-II mRNA | 1.00 (0.60-2.36) | 0.10 (0.03-1.75) | P=0.046 |
| IMPDH activity (μmolXMP/s/mol AMP) | 188 (66.3-244) | 60.0 (16.3-81.2) | P=0.031 |
All data are expressed as median and interquartile range AUC, area under the concentration-time curve; AUEC, area under the effect-time curve.
IMPDH gene expression
The gene expression profiles of IMPDH-I and -II, determined in PBMCs, are presented in Figure 1A-1C. High variability in IMPDH-I and -II gene expression was observed in all four groups. Nevertheless, a significant downregulation in IMPDH-I (Figure 1A) and -II (Figure 1B) genes was observed in TxD as compared with TxND subjects. Similarly, in the D group, the expression of both IMPDH I and II genes were significantly lower as compared with ND controls (Figure 1C and Table 2). The values of area under the effect-time curve (AUEC) for IMPDH-I and -II, representing gene expression versus time curves, are summarized in Table 2. As shown in Figures 1A and 1B, the repression and induction patterns for IMPDH-I and -II genes pronouncedly differed between TxND and TxD groups. Area of repression is a measure of reduction in the pharmacodynamic parameters as compared to the baseline/pre-dose levels. Area of induction is a measure of the increase in the pharmacodynamic parameters above the baseline/pre-dose levels. In TxND, IMPDH-I and -II genes were minimally repressed but both genes were pronouncedly induced after the morning dose of MPA. In contrast, in the TxD, IMPDH-I gene was repressed with a minimal degree of induction, whereas the IMPDH-II gene was slightly repressed and then induced at later time points.
Figure 1.
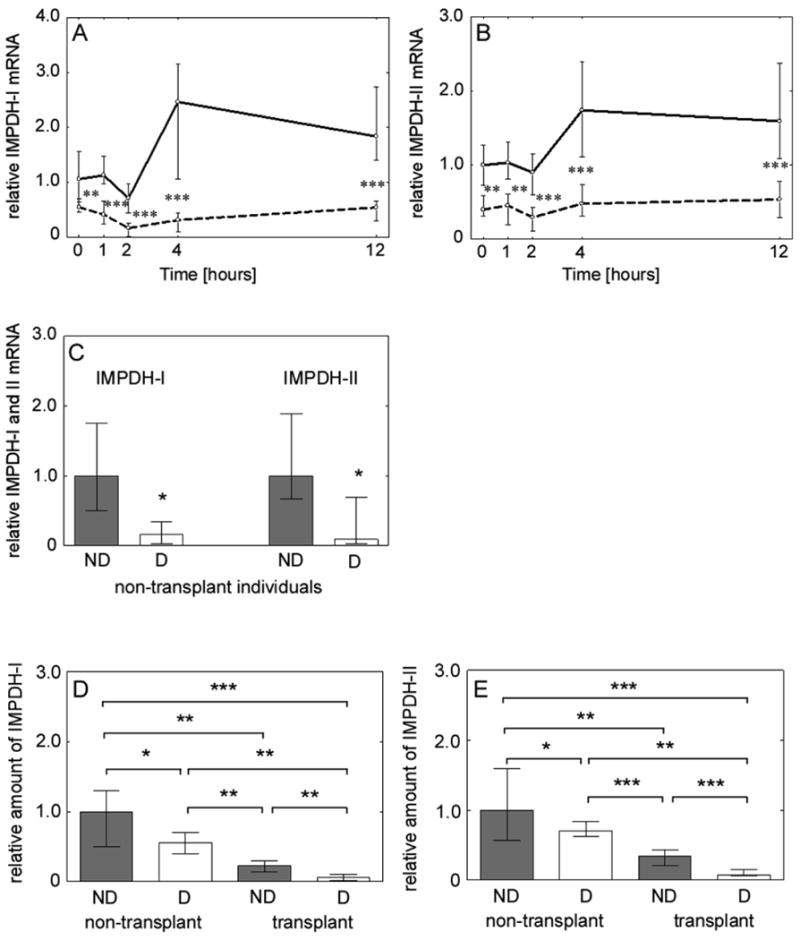
The IMPDH-I and -II gene and protein expression was significantly lower in diabetic kidney transplant recipients or non-transplanted individuals as compared with nondiabetic counterparts. (A) IMPDH-I gene expression in nondiabetic (solid line) and diabetic (dashed line) transplant recipients. (B) IMPDH-II gene expression in nondiabetic (solid line) and diabetic (dashed line) transplant recipients. (C) IMPDH-I and -II gene expression in nondiabetic and diabetic non-transplanted individuals. The values of gene expression are relative to the baseline level in nondiabetic controls. (D) IMPDH-I protein levels in nondiabetic (nondiabetic, ND) and diabetic (diabetic, D) non-transplanted individuals and nondiabetic (nondiabetic, ND) and diabetic (diabetic, D) transplant recipients. (E) IMPDH-II protein levels in nondiabetic (nondiabetic, ND) and diabetic (diabetic, D) non-transplanted individuals and nondiabetic (nondiabetic, ND) and diabetic (diabetic, D) transplant recipients. All data are expressed as median and interquartile range and statistical significance reflects comparison between two different groups (*** P<0.001, ** P<0.01, * P<0.05).
IMPDH protein level
Immunoquantitation of IMPDH protein content in PBMC lysate revealed significantly lower IMPDH-I and -II protein levels in TxD as compared with protein levels from TxND [(IMPDH-I, P=0.002) (Figure 1D) and (IMPDH-II, P<0.001) (Figure 1E)]. Moreover, both IMPDH-I (Figure 1D) and -II (Figure 1E) proteins were significantly lower in D versus ND individuals.
IMPDH activity
The concentration of XMP generated and intracellular adenosine 5′-monophosphate (AMP) were measured using a new, highly sensitive LC-MS/MS method (Figure S1) and IMPDH activity was expressed as μmol XMP/s/mol AMP. Figure 2A depicts median IMPDH activity for TxND and TxD over a 12-hour dosing interval and Figure 2B shows individual profiles for IMPDH activity in transplant recipients. In TxD group, the median values of IMPDH activity were significantly lower in all time points studied (Figure 2A). In addition, the values of IMPDH activity measured in a single sample collected from D non-transplanted individuals were significantly lower than ND individuals (Figure 2C).
Figure 2.
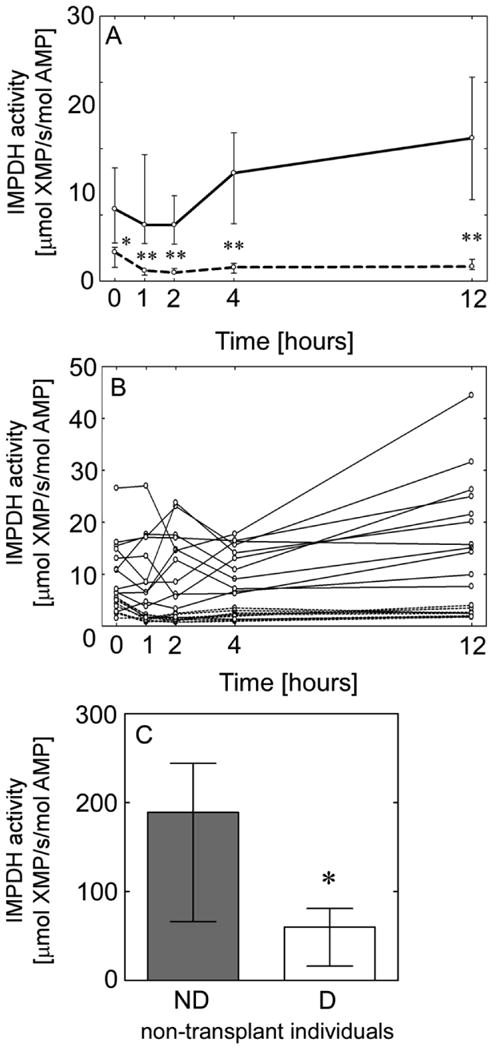
Reduced IMPDH enzyme activity in diabetic kidney transplant recipients or non-transplanted individuals. (A) Median and interquartile range of IMPDH activity in nondiabetic (solid line) and diabetic (dashed line) transplant recipients over a 12-hour dosing interval; level of statistical significance reflects comparison between diabetic and nondiabetic at the same time point. (B) Individual IMPDH activity-time profile in nondiabetic (solid lines) and diabetic (dashed lines) transplant recipients. (C) Median and interquartile range of IMPDH activity in nondiabetic and diabetic non-transplanted individuals. Level of statistical significance reflects comparison to control (** P<0.01, * P<0.05).
The values of AUEC IMPDH activity among TxND and TxD representing areas of repression and induction of IMPDH activity are shown in Table 2. The inhibition of IMPDH activity in transplant recipients after MPA dose was followed by a phase of increased enzyme activity (rebound) but only in TxND. This pattern of repression and induction, in the IMPDH activity, more closely resembled the pattern of IMPDH-I gene expression than IMPDH-II.
IMPDH activity and MPA plasma concentrations
The median values of MPA concentrations over 12-hour after an oral dose is depicted for TxND (Figure 3A) and TxD (Figure 3B) groups. A slight delay in the MPA maximum concentration was observed in the MPA concentration-time profile of diabetic patients. The inverse relationship between IMPDH activity and MPA levels was an expected finding, with the maximal inhibition of IMPDH activity occurring slightly after the peak concentration of MPA. However, the differing levels of IMPDH activity in TxND and TxD were independent of the MPA concentration.
Figure 3.
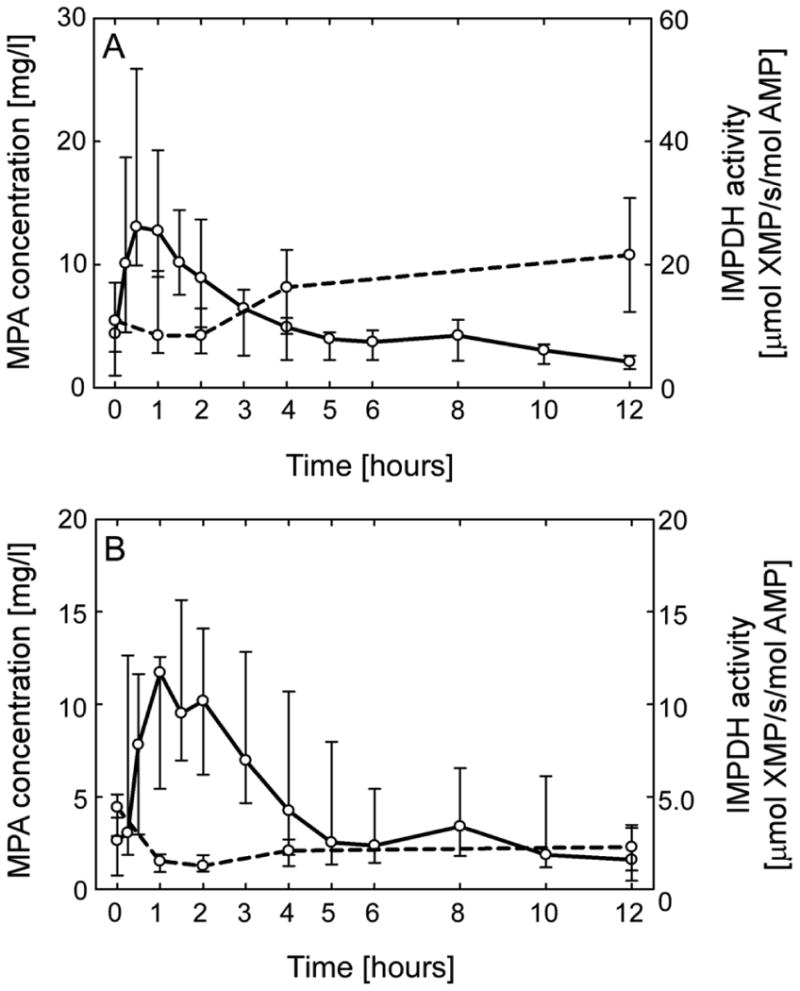
Plasma concentration of mycophenolic acid (MPA) and inosine 5′-monophosphate dehydrogenase (IMPDH) activity (A) MPA plasma levels (solid line) and IMPDH activity (dashed line) in nondiabetic and (B) diabetic transplant recipients. All data are expressed as median and interquartile range.
Inhibition of IMPDH activity by MPA in PBMCs
Mycophenolic acid potently inhibited IMPDH activity when added ex vivo to PBMC lysate of non-transplanted MPA-naive individuals (Figure 4). The values of baseline IMPDH activity (E0) and maximum drug effect (Emax) were almost 50% higher in ND as compared with D individuals but the difference did not reach statistical (P>0.05). In addition, MPA half-maximum effective concentration (EC50) values were significantly higher (P=0.004) in ND subjects, indicating more MPA is needed to suppress IMPDH activity in these individuals. Approximately 50% lower E0 and Emax values between the two groups is in parallel with 44% lower expression of IMPDH-I protein and 29% lower expression of IMPDH-II protein in D as compared with ND non-transplanted individuals (Figures 2D, 2E). However, ∼2.5-fold lower average MPA EC50 in the diabetic group possibly is an indication of altered binding affinity between MPA and IMPDH enzymes in individuals with diabetes mellitus.
Figure 4.
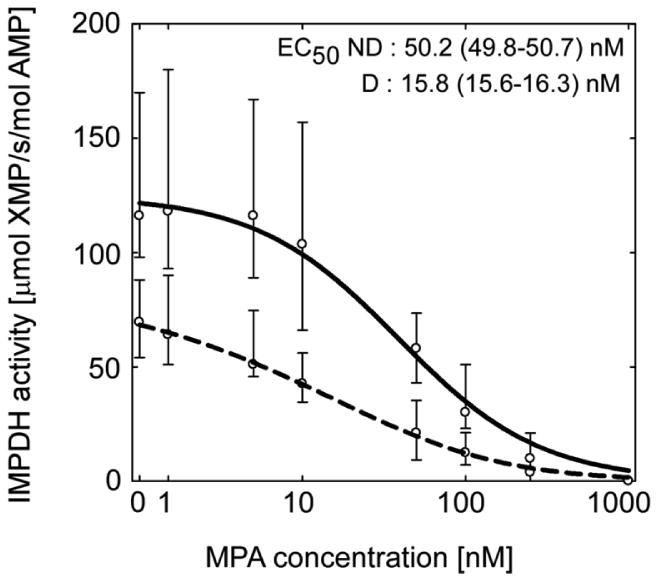
Significantly lower MPA concentration is required to inhibit IMPDH activity in peripheral blood mononuclear cell lysate of non-transplanted diabetic (D, dashed line) than in non-diabetic (ND, solid line) individuals. All data are expressed as median and interquartile range.
Association between IMPDH-I and -II gene polymorphism and IMPDH regulation or activity
Table 3 represents the average IMPDH-I or -II gene expression and IMPDH activity in diabetic and nondiabetic transplant recipients as a function of gene polymorphism of IMPDH-I or -II genes. Among the three IMPDH-I polymorphisms studied (106 G>A, 125 G>A, 1572 C>T), the IMPDH activity was significantly higher in subjects with a variant form of IMPDH-I gene but only in patients without diabetes (TxND). Furthermore, IMPDH-I mRNA levels were significantly higher in diabetic kidney transplant recipients with 125 G>A variant allele (GA+AA) than wild type allele (GG). Between the two IMPDH-II gene polymorphisms characterized (3624 A>G and 3757 T>C), only diabetic patients with a variant form of IMPDH-II 3624 A>G (TxD AG+GG) had significantly higher IMPDH-II mRNA levels. Overall, despite the small sample size, classification of the data according to several clinically important IMPDH-I and IMPDH-II gene polymorphisms showed that the reduced level of IMPDH gene expression or activity in diabetic kidney transplant recipients is independent of the IMPDH polymorphism.
Table 3.
Effect of IMPDH-I or IMPDH-II single nucleotide polymorphism on IMPDH-I, -II mRNA expression or IMPDH activity in diabetic (TxD) and non-diabetic (TxND) kidney transplant recipients.
| N | IMPDH I mRNA | IMPDH II mRNA | IMPDH activity μmol/s/mol AMP | ||
|---|---|---|---|---|---|
| IMPDH-I 106 G>A | TxD GG | 25 | 0.34 ± 0.23 | 0.43 ± 0.15 | 2.17 ± 1.28 |
| TxD GA+AA | 20 | 0.42 ± 0.22 | 0.47 ± 0.15 | 2.37 ± 1.46 | |
| TxND GG | 15 | 1.60 ± 0.82 | 1.34 ± 0.45 | 10.03 ± 5.38* | |
| TxND GA+AA | 40 | 1.49 ± 0.72 | 1.23 ± 0.49 | 15.59 ± 11.52* | |
| IMPDH-I 125 G>A | TxD GG | 15 | 0.28 ± 0.23* | 0.42 ± 0.10 | 2.23 ± 1.37 |
| TxD GA+AA | 30 | 0.42 ± 0.22* | 0.46 ± 0.17 | 2.28 ± 1.37 | |
| TxND GG | 15 | 1.60 ± 0.82 | 1.34 ± 0.45 | 10.03 ± 5.38* | |
| TxND GA+AA | 40 | 1.49 ± 0.72 | 1.23 ± 0.49 | 15.59 ± 11.52* | |
| IMPDH-I 1572 C>T | TxD+CC | 30 | 0.34 ± 0.23 | 0.45 ± 0.15 | 2.31 ± 1.35 |
| TxD+CT | 15 | 0.44 ± 0.21 | 0.43 ± 0.15 | 2.17 ± 1.39 | |
| TxND+CC | 20 | 1.57 ± 0.78 | 1.28 ± 0.42 | 9.38 ± 5.10** | |
| TxND+CT | 35 | 1.49 ± 0.73 | 1.25 ± 0.52 | 16.75 ± 11.79** | |
| IMPDH-II 3624 A>G | TxD AA | 25 | 0.36 ± 0.23 | 0.40 ± 0.15* | 2.45 ± 1.36 |
| TxD AG+GG | 20 | 0.38 ± 0.23 | 0.51 ± 0.12* | 2.02 ± 1.33 | |
| TxND AA | 45 | 1.52 ± 0.74 | 1.28 ± 0.48 | 13.10 ± 6.90 | |
| TxND AG+GG | 10 | 1.52 ± 0.80 | 1.21 ± 0.49 | 18.43 ± 19.96 | |
| IMPDH-II 3757 T>C | TxD TT | 35 | 0.36 ± 0.23 | 0.45 ± 0.16 | 2.26 ± 1.33 |
| TxD CT+CC | 10 | 0.43 ± 0.20 | 0.43 ± 0.12 | 2.26 ± 1.51 | |
| TxND TT | 55 | 1.52 ± 0.74 | 1.26 ± 0.48 | 14.07 ± 10.46 | |
| TxD CT+CC | 0 | NA | NA | NA | |
Data are mean ± SD; N is number of samples included in the analysis with each patient contributing five samples over a 12-hour after mycophenolic acid dose; comparisons were made in either diabetic or non-diabetic groups with respect to variant form of gene; significantly different between the variant and wild-type groups at
P<0.05 and
P<0.005.
Discussion
In the present study, despite the small sample size, we demonstrated that decreased IMPDH activity in PBMCs of diabetic kidney transplant recipients is consistent with reduced IMPDH-I and -II gene expression and protein levels that is independent of genetic polymorphism of IMPDH. We have also observed significantly lower IMPDH gene and protein expression as well as enzyme activity in non-transplanted individuals with diabetes mellitus when compared to nondiabetic controls (none of these non-transplant subjects have ever received MPA treatment). Whereas, considerable variability in IMPDH-I and -II gene expression, protein level and enzyme activity was observed in the non-transplant subjects, thus MPA treatment after transplantation appear to reduce the variability in the IMPDH gene expression or activity.
Patients with diabetes mellitus have greater susceptibility to infections and lower cell mediated immunity [23, 24]. Using data from United States Renal Data System on 29,966 kidney transplant recipients, Lansang et al. [12] compared the incidence of infectious episodes requiring hospitalization between nondiabetic and diabetic patients. The analysis showed the risk of developing such episodes was 43% higher in pre-transplant diabetics and 77% higher in NoDAT patients. The aspects of the immune system that may be impaired by diabetes include reduced leukocyte count, mast cell degranulation and lymph node retention capacity [25]. Furthermore, monocytes from type 2 diabetic patients have significantly lower phagocytotic activity and are less responsive to Toll-like receptor ligands [26]. The IMPDH-I and -II play an important role in the de novo biosynthesis of guanine nucleotides in B and T lymphocytes and downregulation of their activity may potentially lead to a higher rate of infection related morbidity [27]. Although, a clear relationship between increased infections related morbidity and downregulation of IMPDH has not been reported, the present investigation provides novel observations that may partially explain the increased susceptibility to infections in diabetic patients.
In the present study, we have observed that lower IMPDH activity is associated with a decrease in the gene and protein expression of IMPDH-I and -II. Our data demonstrate that reduced IMPDH activity occurs at pre-translational level, which is consistent with previously published data reporting regulation of IMPDH enzymes by altering the gene expression or stability of mRNA [18]. It has also been demonstrated that the regulation of IMPDH does not occur in cytoplasm [28]. Thus, diabetes-mediated downregulation of IMPDH activity may result from a lower level of IMPDH gene expression in the nucleus, probably because of altered RNA processing and/or RNA stability [18]. However, because of the relatively small amount of nuclear RNA, some other regulatory mechanisms may be involved.
To the best of our knowledge, this is the first report showing significantly different regulation of IMPDH by diabetes mellitus. An in vitro study in different cell lines has reported that insulin treatment did not change IMPDH activity [29]. Thus, it is essential to identify and understand the molecular mechanism of the regulation of IMPDH activity as well as the pathophysiological significance of diabetes-mediated downregulation of this activity. Further understanding of these processes may help to explain the higher incidence of infectious diseases, cancer and metabolic disorders in diabetic patients. Significant differences in the MPA EC50 values, in nondiabetic and diabetic non-transplant individuals, suggests that factors other than reduced IMPDH gene/protein expression may have an effect on the activity of IMPDH enzymes e.g. affinity between MPA and active site of the enzymes.
Our study revealed large interindividual variability for both pharmacokinetic and pharmacodynamic parameters that is consistent with previously published studies [16, 30]. This large variation could be attributed to genetic (e.g. polymorphism) and/or non-genetic factors (e.g. infections which can enhance lymphocyte activation) [31]. MPA free fraction was shown to be pharmacologically active portion of mycophenolate mofetil (MMF) or enteric-coated mycophenolate sodium (EC-MPS). Hematological factors such as albumin concentration, hematocrit or composition of blood cell fraction may significantly affect the concentration of unbound fraction of MPA. Thus, unbound fraction could theoretically decrease IMPDH activity in diabetic patients. However, we have previously reported comparable unbound MPA fraction between nondiabetic and diabetic kidney transplant recipients [13].
An inverse correlation has been observed between IMPDH activity and MPA plasma concentration. However, in some transplant recipients, the maximal inhibition of IMPDH activity was observed only at peak MPA concentration, whereas others exhibited longer and more persistent inhibition of the activity. In addition, complete inhibition of IMPDH activity was observed only for a short time, followed by a rebound phenomenon after four hours. This pattern of induction is in agreement with previously published data from Sanquer et al. [16, 22]. Conversely, a greater and more rapid degree of inhibition of IMPDH activity, persisting up to 8 hours, was reported by other researchers [32]. The inhibition of IMPDH activity indicates that MPA effect is retained significantly longer than might be expected from its concentration profile. Several possible explanations for the discrepancy between previously published data could be (i) small numbers of patients enrolled in these studies (ii) differences in the study design and (iii) the different assays used for a quantification of IMPDH enzyme activity. Due to the technical difficulties of the assay, several techniques to characterize IMPDH activity ex vivo have been developed and validated [33]. Thus, high variability in different assays may limit the comparison of results between laboratories. To date, several techniques have been validated and used to measure IMPDH enzyme activity (i) UV-VIS spectrophotometry [34], (ii) radiometric detection [22], (iii) HPLC using total protein level [35], cell count [36] or intracellular AMP concentration [19] to normalize generated XMP. A validated nonradioactive method by Glander et al. [19] was used in our experimental work to measure enzyme activity of IMPDH in PBMCs.
Single nucleotide polymorphisms (SNPs) in IMPDH-I and -II genes have been independently correlated with acute rejection. In this paper, we reported genotyping results from three IMPDH-I SNPs: 106 G>A, 125 G>A and 1572 C>T and two IMPDH-II SNPs: 3624 A>G and 3757 T>C; all of which were previously reported for their potential involvement in the outcomes of MPA treatment [37]. Another study in 456 kidney transplant recipients has only identified the variant form of IMPDH-I (rs2278294, 125G>A) to be associated with a lower risk of rejection and a higher risk of leucopenia [38]. In our study, when the mRNA gene expression and activity was divided into different groups based on the gene polymorphisms, the difference between diabetic and nondiabetic groups was still large and independent of genetic polymorphism. However, within diabetic or nondiabetic groups, some markers were significantly different including IMPDH activity in the TxND group with a variant form of IMPDH-I gene.
In summary, although our study is limited by a small number of patients, we have clearly demonstrated significantly lower IMPDH gene expression, protein level and enzyme activity in diabetic kidney transplant recipients, despite comparable MPA concentrations. Moreover, significantly lower expression and enzyme activity of IMPDH was observed in diabetic non-transplanted individuals who have never received MPA treatment. Although the pathophysiological factors that lead to the development of diabetes-mediated changes in IMPDH activity have not been identified, we believe the findings of this study require further consideration to elucidate the mechanism of diabetes induced IMPDH downregulation. Although measurement of pharmacodynamic effects may provide a more direct insight onto the activity of MPA therapy and may increase the efficacy whereas decrease the side effects of MPA treatment, significant evaluation with a large number of diabetic patients is warranted.
Supplementary Material
Figure S1. A typical LC-MS/MS chromatogram depicting separation of (A) xanthosine-5′monophosphate, XMP and intracellular adenosine monophosphate, AMP (B) XMP and (C) intracellular AMP.
Acknowledgments
The authors are grateful to all the study subjects for their participation in the study. We thank Shripad D. Chitnis (Department of Biomedical and Pharmaceutical Sciences, University of Rhode Island, Kingston, RI) for his assistance with analyzing the concentration of mycophenolic acid and metabolites, and Vertex Pharmaceuticals, Inc. (Cambridge, MA) for the generous donation of IMPDH-I and -II antibodies.
This study was supported by an investigator-initiated grant from Novartis Pharmaceuticals. Use of the RI-INBRE core facility funded by grant P20RR016457 from the NCRR, a component of the NIH in gratefully acknowledged.
Abbreviations
- AMP
adenosine 5′-monophosphate
- AUC
area under the concentration-time curve
- AUEC
area under the effect-time curve
- EC50
half-maximum effective concentration
- Emax
maximum drug effect
- HPLC
high-pressure liquid chromatography
- IMP
inosine 5′-monophosphate
- IMPDH
inosine monophosphate dehydrogenase
- LC-MS/MS
liquid chromatography-mass spectrometry
- MPA
mycophenolic acid
- NoDAT
New Onset Diabetes After Transplant
- PBMCs
peripheral blood mononuclear cells
- SNP
single nucleotide polymorphism
- TxD
kidney transplant recipients with diabetes
- TxND
kidney transplant recipients without diabetes
- XMP
xanthosine 5′-monophosphate
Footnotes
Conflict of Interest: The author indicates no potential conflict of interest exists with any commercial entity whose products are described in the manuscript.
References
- 1.Kasiske BL, Zeier MG, Craig JC, Ekberg H, Garvey CA, Green MD, Jha V, Josephson MA, Kiberd BA, Kreis HA, McDonald RA, Newmann JM, Obrador GT, Chapman JR, Vincenti FG, Balk EM, Wagner M, Raman G, Earley A, Abariga S. KDIGO clinical practice guideline for the care of kidney transplant recipients. Am J Transplant. 2009;(Suppl 3):S1–155. doi: 10.1111/j.1600-6143.2009.02834.x. [DOI] [PubMed] [Google Scholar]
- 2.Carr SF, Papp E, Wu JC, Natsumeda Y. Characterization of human type I and type II IMP dehydrogenases. J Biol Chem. 1993;268:27286–90. [PubMed] [Google Scholar]
- 3.Fulton B, Markham A. Mycophenolate mofetil. A review of its pharmacodynamic and pharmacokinetic properties and clinical efficacy in renal transplantation. Drugs. 1996;51:278–98. doi: 10.2165/00003495-199651020-00007. [DOI] [PubMed] [Google Scholar]
- 4.Raab M, Daxecker H, Karimi A, Markovic S, Cichna M, Markl P, Muller MM. In vitro effects of mycophenolic acid on the nucleotide pool and on the expression of adhesion molecules of human umbilical vein endothelial cells. Clin Chim Acta. 2001;310:89–98. doi: 10.1016/s0009-8981(01)00527-7. [DOI] [PubMed] [Google Scholar]
- 5.Sollinger HW. Mycophenolates in transplantation. Clin Transplant. 2004;18:485–92. doi: 10.1111/j.1399-0012.2004.00203.x. [DOI] [PubMed] [Google Scholar]
- 6.Glesne D, Collart F, Varkony T, Drabkin H, Huberman E. Chromosomal localization and structure of the human type II IMP dehydrogenase gene (IMPDH2) Genomics. 1993;16:274–7. doi: 10.1006/geno.1993.1177. [DOI] [PubMed] [Google Scholar]
- 7.Senda M, Natsumeda Y. Tissue-differential expression of two distinct genes for human IMP dehydrogenase (E.C.1.1.1205) Life Sci. 1994;54:1917–26. doi: 10.1016/0024-3205(94)90150-3. [DOI] [PubMed] [Google Scholar]
- 8.Raggi MC, Siebert SB, Steimer W, Schuster T, Stangl MJ, Abendroth DK. Customized mycophenolate dosing based on measuring inosine-monophosphate dehydrogenase activity significantly improves patients' outcomes after renal transplantation. Transplantation. 2010;90:1536–41. doi: 10.1097/TP.0b013e3182000027. [DOI] [PubMed] [Google Scholar]
- 9.Kamar N, Glander P, Nolting J, Bohler T, Hambach P, Liefeldt L, Rostaing L, Neumayer HH, Budde K. Pharmacodynamic evaluation of the first dose of mycophenolate mofetil before kidney transplantation. Clin J Am Soc Nephrol. 2009;4:936–42. doi: 10.2215/CJN.04860908. [DOI] [PMC free article] [PubMed] [Google Scholar]
- 10.Glander P, Hambach P, Liefeldt L, Budde K. Inosine 5′-monophosphate dehydrogenase activity as a biomarker in the field of transplantation. Clin Chim Acta. 2011 doi: 10.1016/j.cca.2011.08.027. [DOI] [PubMed] [Google Scholar]
- 11.Bremer S, Mandla R, Vethe NT, Rasmussen I, Rootwelt H, Line PD, Midtvedt K, Bergan S. Expression of IMPDH1 and IMPDH2 after transplantation and initiation of immunosuppression. Transplantation. 2008;85:55–61. doi: 10.1097/01.tp.0000296854.68123.03. [DOI] [PubMed] [Google Scholar]
- 12.Lansang MC, Ma L, Schold JD, Meier-Kriesche HU, Kaplan B. The relationship between diabetes and infectious hospitalizations in renal transplant recipients. Diabetes Care. 2006;29:1659–60. doi: 10.2337/dc05-2412. [DOI] [PubMed] [Google Scholar]
- 13.Patel CG, Richman K, Yang D, Yan B, Gohh RY, Akhlaghi F. Effect of diabetes mellitus on mycophenolate sodium pharmacokinetics and inosine monophosphate dehydrogenase activity in stable kidney transplant recipients. Ther Drug Monit. 2007;29:735–42. doi: 10.1097/FTD.0b013e31815d8ace. [DOI] [PMC free article] [PubMed] [Google Scholar]
- 14.Patel CG, Akhlaghi F. High-performance liquid chromatography method for the determination of mycophenolic acid and its acyl and phenol glucuronide metabolites in human plasma. Ther Drug Monit. 2006;28:116–22. doi: 10.1097/01.ftd.0000177664.96726.56. [DOI] [PubMed] [Google Scholar]
- 15.Dostalek M, Court MH, Yan B, Akhlaghi F. Significantly reduced cytochrome P450 3A4 expression and activity in liver from humans with diabetes mellitus. Br J Pharmacol. 2011;163:937–47. doi: 10.1111/j.1476-5381.2011.01270.x. [DOI] [PMC free article] [PubMed] [Google Scholar]
- 16.Sanquer S, Maison P, Tomkiewicz C, Macquin-Mavier I, Legendre C, Barouki R, Lang P. Expression of inosine monophosphate dehydrogenase type I and type II after mycophenolate mofetil treatment: a 2-year follow-up in kidney transplantation. Clin Pharmacol Ther. 2008;83:328–35. doi: 10.1038/sj.clpt.6100300. [DOI] [PubMed] [Google Scholar]
- 17.Guengerich FP, Wang P, Davidson NK. Estimation of isozymes of microsomal cytochrome P-450 in rats, rabbits, and humans using immunochemical staining coupled with sodium dodecyl sulfate-polyacrylamide gel electrophoresis. Biochemistry. 1982;21:1698–706. doi: 10.1021/bi00536a035. [DOI] [PubMed] [Google Scholar]
- 18.Jain J, Almquist SJ, Ford PJ, Shlyakhter D, Wang Y, Nimmesgern E, Germann UA. Regulation of inosine monophosphate dehydrogenase type I and type II isoforms in human lymphocytes. Biochem Pharmacol. 2004;67:767–76. doi: 10.1016/j.bcp.2003.09.043. [DOI] [PubMed] [Google Scholar]
- 19.Glander P, Sombogaard F, Budde K, van Gelder T, Hambach P, Liefeldt L, Lorkowski C, Mai M, Neumayer HH, Vulto AG, Mathot RA. Improved assay for the nonradioactive determination of inosine 5′-monophosphate dehydrogenase activity in peripheral blood mononuclear cells. Ther Drug Monit. 2009;31:351–9. doi: 10.1097/FTD.0b013e31819c3f3d. [DOI] [PubMed] [Google Scholar]
- 20.Cai Z. Ion-pairing LC/MS/MS determination of nucleosides and nucleotides. Analytical Sciences. 2001;17 Supplement:a199–a201. [Google Scholar]
- 21.Qian T, Cai Z, Yang MS. Determination of adenosine nucleotides in cultured cells by ion-pairing liquid chromatography-electrospray ionization mass spectrometry. Anal Biochem. 2004;325:77–84. doi: 10.1016/j.ab.2003.10.028. [DOI] [PubMed] [Google Scholar]
- 22.Sanquer S, Breil M, Baron C, Dhamane D, Astier A, Lang P. Induction of inosine monophosphate dehydrogenase activity after long-term treatment with mycophenolate mofetil. Clin Pharmacol Ther. 1999;65:640–8. doi: 10.1016/S0009-9236(99)90085-1. [DOI] [PubMed] [Google Scholar]
- 23.Geerlings SE, Hoepelman AI. Immune dysfunction in patients with diabetes mellitus (DM) FEMS Immunol Med Microbiol. 1999;26:259–65. doi: 10.1111/j.1574-695X.1999.tb01397.x. [DOI] [PubMed] [Google Scholar]
- 24.Moutschen MP, Scheen AJ, Lefebvre PJ. Impaired immune responses in diabetes mellitus: analysis of the factors and mechanisms involved. Relevance to the increased susceptibility of diabetic patients to specific infections. Diabete Metab. 1992;18:187–201. [PubMed] [Google Scholar]
- 25.Martins JO, Zanoni FL, Martins DO, Coimbra R, Krieger JE, Jancar S, Sannomiya P. Insulin regulates cytokines and intercellular adhesion molecule-1 gene expression through nuclear factor-kappaB activation in LPS-induced acute lung injury in rats. Shock. 2009;31:404–9. doi: 10.1097/SHK.0b013e318186275e. [DOI] [PubMed] [Google Scholar]
- 26.Komura T, Sakai Y, Honda M, Takamura T, Matsushima K, Kaneko S. CD14+ monocytes are vulnerable and functionally impaired under endoplasmic reticulum stress in patients with type 2 diabetes. Diabetes. 2010;59:634–43. doi: 10.2337/db09-0659. [DOI] [PMC free article] [PubMed] [Google Scholar]
- 27.Hedstrom L. IMP dehydrogenase: structure, mechanism, and inhibition. Chem Rev. 2009;109:2903–28. doi: 10.1021/cr900021w. [DOI] [PMC free article] [PubMed] [Google Scholar]
- 28.Gu JJ, Spychala J, Mitchell BS. Regulation of the human inosine monophosphate dehydrogenase type I gene. Utilization of alternative promoters. J Biol Chem. 1997;272:4458–66. doi: 10.1074/jbc.272.7.4458. [DOI] [PubMed] [Google Scholar]
- 29.Whitehead JP, Simpson F, Hill MM, Thomas EC, Connolly LM, Collart F, Simpson RJ, James DE. Insulin and oleate promote translocation of inosine-5′ monophosphate dehydrogenase to lipid bodies. Traffic. 2004;5:739–49. doi: 10.1111/j.1600-0854.2004.00217.x. [DOI] [PubMed] [Google Scholar]
- 30.Glander P, Hambach P, Braun KP, Fritsche L, Giessing M, Mai I, Einecke G, Waiser J, Neumayer HH, Budde K. Pre-transplant inosine monophosphate dehydrogenase activity is associated with clinical outcome after renal transplantation. Am J Transplant. 2004;4:2045–51. doi: 10.1111/j.1600-6143.2004.00617.x. [DOI] [PubMed] [Google Scholar]
- 31.Wieland E, Olbricht CJ, Susal C, Gurragchaa P, Bohler T, Israeli M, Sommerer C, Budde K, Hartmann B, Shipkova M, Oellerich M. Biomarkers as a tool for management of immunosuppression in transplant patients. Ther Drug Monit. 2010;32:560–72. doi: 10.1097/FTD.0b013e3181efb3d2. [DOI] [PubMed] [Google Scholar]
- 32.Budde K, Braun KP, Glander P, Bohler T, Hambach P, Fritsche L, Waiser J, Mai I, Neumayer HH. Pharmacodynamic monitoring of mycophenolate mofetil in stable renal allograft recipients. Transplant Proc. 2002;34:1748–50. doi: 10.1016/s0041-1345(02)03052-x. [DOI] [PubMed] [Google Scholar]
- 33.Weimert NA, Derotte M, Alloway RR, Woodle ES, Vinks AA. Monitoring of inosine monophosphate dehydrogenase activity as a biomarker for mycophenolic acid effect: potential clinical implications. Ther Drug Monit. 2007;29:141–9. doi: 10.1097/FTD.0b013e31803d37b6. [DOI] [PubMed] [Google Scholar]
- 34.McPhillips CC, Hyle JW, Reines D. Detection of the mycophenolate-inhibited form of IMP dehydrogenase in vivo. Proc Natl Acad Sci U S A. 2004;101:12171–6. doi: 10.1073/pnas.0403341101. [DOI] [PMC free article] [PubMed] [Google Scholar]
- 35.Glander P, Braun KP, Hambach P, Bauer S, Mai I, Roots I, Waiser J, Fritsche L, Neumayer HH, Budde K. Non-radioactive determination of inosine 5′-monophosphate dehydrogenase (IMPDH) in peripheral mononuclear cells. Clin Biochem. 2001;34:543–9. doi: 10.1016/s0009-9120(01)00267-3. [DOI] [PubMed] [Google Scholar]
- 36.Daxecker H, Raab M, Muller MM. Influence of mycophenolic acid on inosine 5′-monophosphate dehydrogenase activity in human peripheral blood mononuclear cells. Clin Chim Acta. 2002;318:71–7. doi: 10.1016/s0009-8981(01)00801-4. [DOI] [PubMed] [Google Scholar]
- 37.Wu TY, Peng Y, Pelleymounter LL, Moon I, Eckloff BW, Wieben ED, Yee VC, Weinshilboum RM. Pharmacogenetics of the mycophenolic acid targets inosine monophosphate dehydrogenases IMPDH1 and IMPDH2: gene sequence variation and functional genomics. Br J Pharmacol. 2010;161:1584–98. doi: 10.1111/j.1476-5381.2010.00987.x. [DOI] [PMC free article] [PubMed] [Google Scholar]
- 38.Gensburger O, Van Schaik RH, Picard N, Le Meur Y, Rousseau A, Woillard JB, Van Gelder T, Marquet P. Polymorphisms in type I and II inosine monophosphate dehydrogenase genes and association with clinical outcome in patients on mycophenolate mofetil. Pharmacogenet Genomics. 2010;20:537–43. doi: 10.1097/FPC.0b013e32833d8cf5. [DOI] [PMC free article] [PubMed] [Google Scholar]
Associated Data
This section collects any data citations, data availability statements, or supplementary materials included in this article.
Supplementary Materials
Figure S1. A typical LC-MS/MS chromatogram depicting separation of (A) xanthosine-5′monophosphate, XMP and intracellular adenosine monophosphate, AMP (B) XMP and (C) intracellular AMP.