Abstract
Background: Multiple sclerosis (MS) has been traditionally considered to be more frequent in women and in regions more distant from the equator. However, recent reports suggest that the latitude gradient could be disappearing and that the female-to-male ratio among patients with MS has increased in the last decades. We have conducted a systematic review of incidence studies of MS to assess the overall incidence of MS and explore possible changes in the latitude gradient and the female-to-male ratio over time.
Methods: Systematic review of incidence studies of MS published in Medline between 1966 and February 2007. Age- and sex-specific incidence rates were collected from eligible publications. We computed age-adjusted rates using the world population as standard, and assessed differences in rates according to latitude and period of case ascertainment. Additionally, we evaluated the association between period of case ascertainment and the female-to-male ratio.
Results: The overall incidence rate of MS was 3.6 cases per 100,000 person-years (95% CI 3.0, 4.2) in women and 2.0 (95% CI 1.5, 2.4) in men. Higher latitude was associated with higher MS incidence, though this latitude gradient was attenuated after 1980, apparently due to increased incidence of MS in lower latitudes. The female-to-male ratio in MS incidence increased over time, from an estimated 1.4 in 1955 to 2.3 in 2000.
Conclusion: The latitude gradient present in older incidence studies of multiple sclerosis (MS) is decreasing. The female-to-male MS ratio has increased in the last five decades.
Multiple sclerosis (MS) is a chronic inflammatory disease of the CNS with unknown etiology. It is the most frequent nontraumatic disabling neurologic disease among young adults, with 12,000 new diagnoses per year in the United States alone.1 Early studies of MS established that the incidence of the disease increased with the distance from the equator2–4 and it is widely accepted that the incidence of MS is about twice as high in women compared to men.5 However, these classic tenets of the epidemiology of MS may be questionable.
Recent evidence suggests that the latitude gradient of MS incidence may be decreasing,6–8 or even that it never existed in certain areas,9 and two reports indicate that the female-to-male ratio of MS might have increased over time.10,11 Confirming these trends would offer interesting clues to the etiology of MS. For example, genetic explanations for the latitude gradient and the sex ratio would need to be greatly qualified or rejected, whereas infectious or lifestyle explanations would appear stronger.
Although some systematic reviews on the worldwide and regional incidence of MS have been published,1,9,12,13 none of them studied temporal changes in the latitude gradient or the sex ratio. We conducted a systematic review of published studies that provided age- and sex-specific incidence rates of MS. Our objective was to evaluate temporal changes in the incidence of MS by latitude and sex.
METHODS
Literature search.
We conducted a search in Medline and EMBASE including the period 1966 to February 1, 2007, for the keywords “multipie sclerosis AND incidence” in Medical Subjects Headings and free text. We screened all abstracts from the retrieved articles published in English and obtained the full text of those that could meet the inclusion criteria. We also examined the references in the articles meeting inclusion criteria, as well as previous reviews on the incidence of MS. Studies were included if they provided original data, specified the period of case ascertainment and the criteria for MS diagnosis, defined the study population, and reported age- and sex-specific incidence rates of physician-diagnosed MS. To improve the comparability between reports conducted in populations with different age structure, we excluded studies that did not provide age- and sex-specific incidence rates.
Data collection.
From each individual study, we gathered the following information if available: first author, year of publication, period of case ascertainment, geographic area (Northern Europe, Southern Europe, North America, Australia and New Zealand, or Other), mean latitude for the study area, diagnostic criteria used for MS diagnosis, inclusion of suspect or possible cases, size of the study population, number of MS cases (total and by sex), method of case ascertainment, use of date of first symptoms or diagnosis to define incidence time, and age- and sex-specific incidence rates. In each study, the study period was defined as the mean of the first and last years of case ascertainment, and the sex ratio was calculated as the ratio of MS age-standardized incidence among women divided by that incidence among men. We defined dichotomous variables for study period (<1980, ≥1980) and latitude zone (<50, ≥50 degrees) using the median values as cutoff points.
Statistical analysis.
For each study, we computed age-standardized incidence rates separately in women and men using the world population as reference.14 We computed the mean age-standardized incidence including all studies and by study period and latitude zone. We also summarized incidence rates in each study by calculating the lifetime probability of receiving an MS diagnosis (lifetime risk).15
We used regression analysis to estimate the association of (log) MS incidence with latitude and period of case ascertainment (both considered as continuous variables). Similarly, we regressed the (log) female-to-male ratio on the study year. Each study was weighted by the inverse of the variance of its incidence rate, defined as the number of MS cases over the square of person-years of follow-up.16
RESULTS
Our initial search retrieved 3,313 references in Medline and 1,253 in EMBASE. Of these, 28 articles provided age- and sex-specific incidence rates.6,17–44 Six of them reported MS incidence separately for more than one population or for different periods of time for the same population18,19,21–23,32 so, for the purposes of this analysis, we considered them as separate studies. We excluded one study44 because it provided age-specific incidences that were all lower than the overall incidence. Therefore, our analysis included 38 studies: 19 conducted in northern Europe (Nordic countries and the United Kingdom), 12 in southern Europe, five in Australia, and two in the United States. Three studies (two in the United Kingdom, one in the United States) reported MS incidence only among women.6,25,26 Table 1 lists the studies included in the systematic review, and their corresponding MS incidence rates and lifetime risk.
Table 1 Age-standardized incidence rates (per 100,000 person-years) and lifetime risk of multiple sclerosis (MS) in published studies reporting age- and sex-specific incidence rate of MS
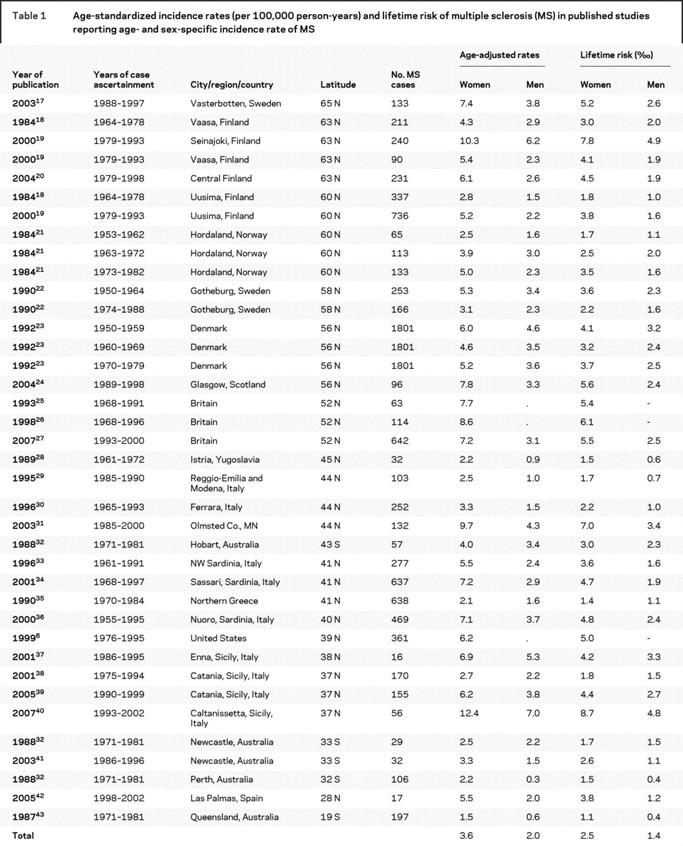
Among women, the weighted mean incidence rate of MS was 3.6 (95% CI 3.0, 4.2) cases per 100,000 person-years (nonweighted: 5.3, 95% CI 4.5, 6.1) and the lifetime risk was 2.5‰ (nonweighted: 3.7‰). Among men, the corresponding figures were 2.0 (95% CI 1.5, 2.4; nonweighted: 2.8, 95% CI 2.3, 3.3) for incidence and 1.4‰ (nonweighted: 2.0‰) for the lifetime risk.
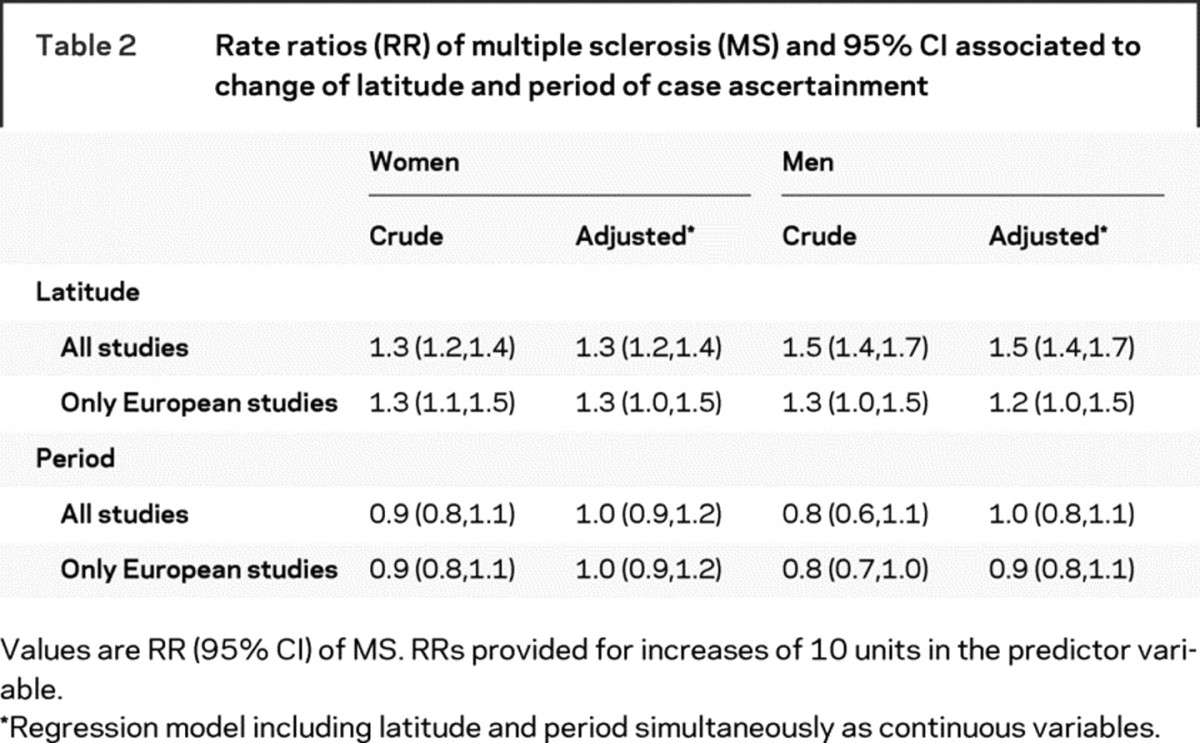
Incidence rates were greater at higher latitudes, both in women and men (figure 1). For each increment in 10 degrees of latitude, MS incidence increased 30% in women and 50% in men (table 2). This latitude gradient was slightly weaker when we restricted our analysis to studies conducted in Europe (31 studies). After adjustment for latitude, we did not observe any significant association between the study year and the incidence of MS (table 2).
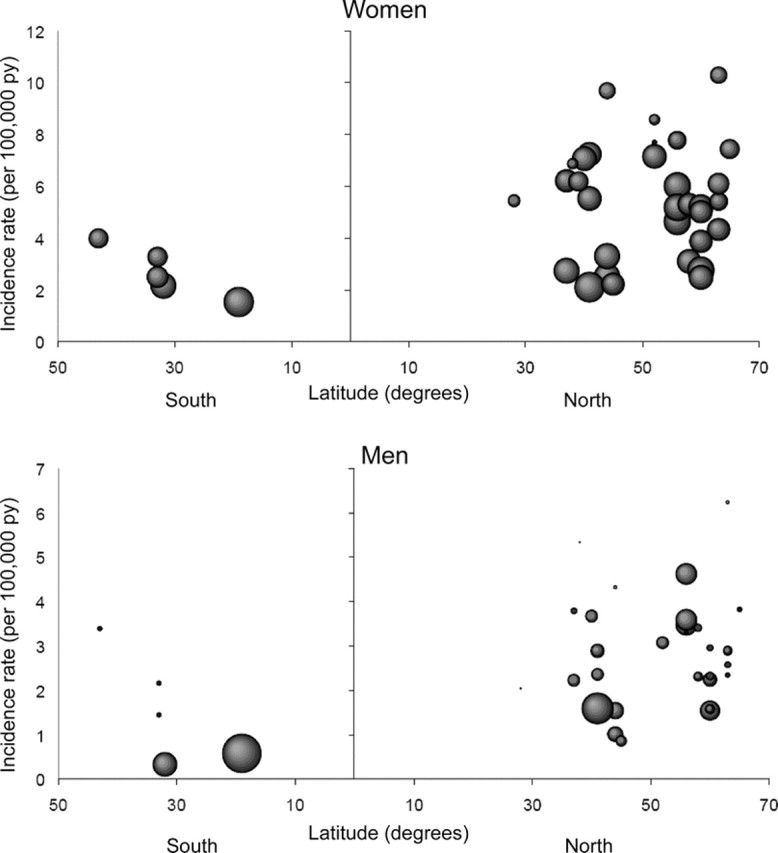
Figure 1 Age-adjusted incidence rate of multiple sclerosis by latitude in 38 different incidence studies
Each observation corresponds to the incidence in one study. Size of each observation is proportional to the inverse of its variance.
Table 2 Rate ratios (RR) of multiple sclerosis (MS) and 95% CI associated to change of latitude and period of case ascertainment
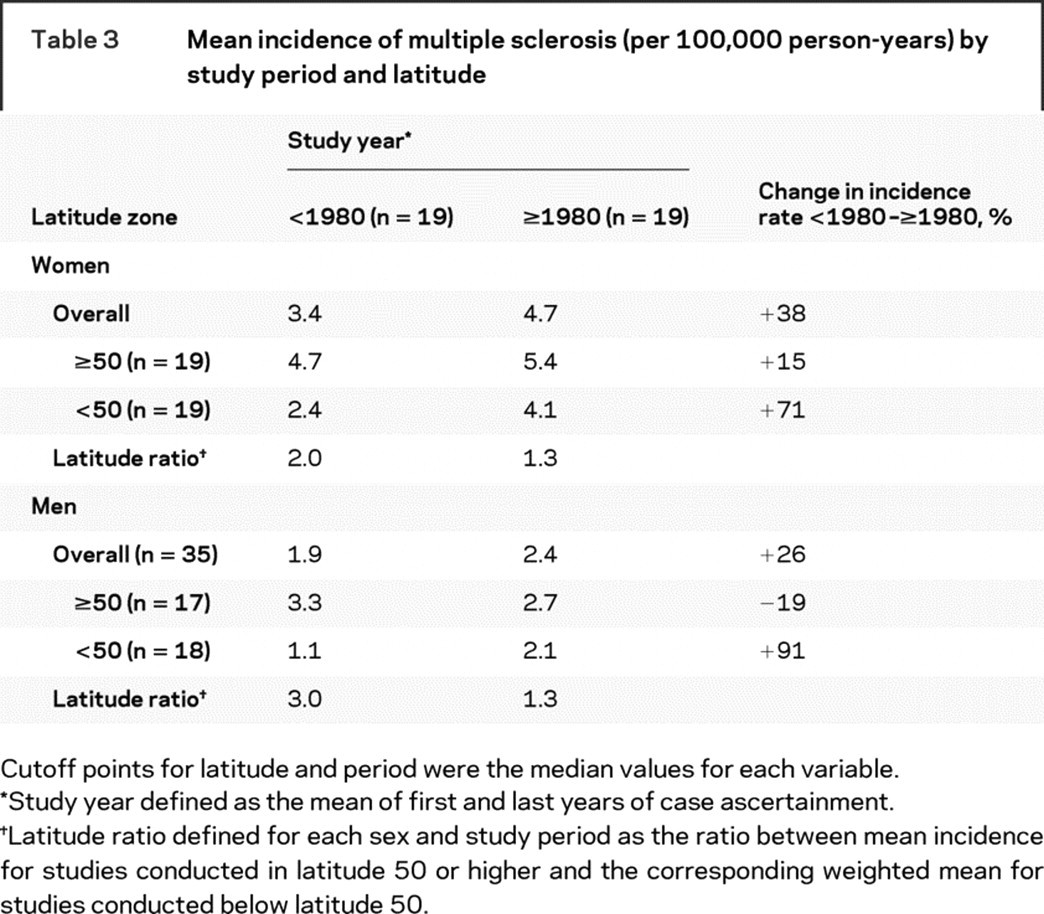
The mean MS incidence rates by study period and latitude zone are shown in table 3. Compared with studies conducted before 1980, the MS incidence was generally higher after 1980, especially in lower latitudes. As a consequence, the incidence rate ratio for high vs low latitude was higher, both in women and men, before 1980 than after 1980. In fact, latitude was clearly associated with MS incidence only before 1980, when a 10-degree increment in latitude was associated with a 31% increase (95% CI: 17% to 47%) in MS incidence among women and 54% (95% CI: 35% to 77%) among men. After 1980 the corresponding numbers were 15% (95% CI: −9% to 44%) in women and 11% (95% CI: −13% to 41%) in men.
Table 3 Mean incidence of multiple sclerosis (per 100,000 person-years) by study period and latitude
We found an association between study year and sex ratio: for each 5-year period, the female-to-male incidence ratio increased 6% (95% CI: 3% to 10%) on average, from a predicted mean sex ratio of 1.4 in 1955 to 2.3 in 2000. These results did not materially change when the model included a quadratic term for the study year. The increase in the sex ratio was apparent when we examined separately studies conducted in the same region over different periods of time (figure 2).
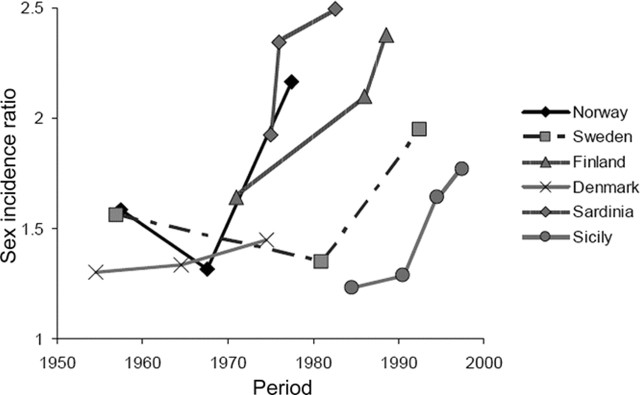
Figure 2 Sex (female-to-male) incidence rate ratio of multiple sclerosis by study year and region
Study period was defined as the mean of the first and last year of the case ascertainment for that particular study. Only regions with information from three or more periods of time are included.
DISCUSSION
Our findings suggest an attenuation of the latitude gradient in MS incidence over the last 25 years, apparently as a result of increased incidence of MS in regions closer to the equator, and an increase of the female-to-male ratio of MS over time.
The existence of a latitude gradient in the distribution of MS was an early finding in the epidemiologic study of this disorder. Two seminal studies, one conducted among US veterans and the other in different populations from Australia and New Zealand, found a higher frequency of MS in regions farther from the equator.3,4 These studies, together with observations from migrant populations,45,46 make it unlikely that the latitude gradient is fully explained by the genetic composition of the population or, as some authors have argued,9 by differential diagnosis of MS in contiguous regions.
More recent reports, however, pointed to an attenuation of the latitude gradient. An analysis from the Nurses’ Health Study (NHS) and NHS II cohorts assessed MS incidence among US female nurses born between 1921 and 1946 (NHS) and between 1947 and 1964 (NHS II). In the NHS, women born north of 41–42 degrees North latitude had a risk of developing MS 3.5 times higher than women born south of 37 degrees North latitude. In contrast, in the NHS II, being born in the north was not associated with a higher incidence of MS.6 Similarly, an extension of the study conducted among US war veterans by Kurtzke et al. in 1979 showed that the north to south relative risk in the United States declined from 2.6 for veterans from the Second World War and the Korean Conflict to 2.0 for those from the Vietnam War and the Gulf War.7 Our results confirm the attenuation of the latitude gradient, and extend this finding outside the United States.
The observed change in the latitude gradient suggests that, in addition to genetic determinants, one or more environmental factors play a role in the etiology of MS. Vitamin D and sun exposure (highly correlated), and infections have been suggested as potential candidates.8,47 Several studies have observed an inverse association between vitamin D (both dietary intake and blood levels) and the risk of developing MS.48,49 Changes in lifestyle associated to decreased sun exposure, and therefore lower synthesis of vitamin D, could account in part for the attenuation of the latitude gradient. Another potential explanation for the change in the latitude gradient is a change in the timing of exposure to infections in early life. According to the so-called hygiene hypothesis, an increased exposure to infections during childhood reduces the risk of autoimmune disorders, possibly including MS. Individuals in the southern regions of Europe and the United States have been traditionally more exposed to infections at young ages,50 but recent improvements in socioeconomic conditions and lifestyle modifications might have eliminated this earlier exposure.
We also found an increase in the female-to-male ratio among MS cases. Two previous reports had detected this increase in North America. The Canadian Collaborative Project on Genetic Susceptibility to Multiple Sclerosis evaluated the MS sex ratio by year of birth among 27,073 patients with MS born between 1931 and 1980. The ratio was 1.90 for cases born in 1931–1935, and increased steadily to 3.21 for those born in 1976–1980.10 Similarly, in 30,000 North American patients enrolled in the NARCOMS MS registry, the female-to-male ratio increased from approximately 2 for patients diagnosed in 1940 to 4 for those diagnosed in 2000.11 Again, our study confirms these findings and extend them outside North America.
The observed rise in the female-to-male ratio cannot be easily explained by genetics or by new diagnostic technologies or increased awareness, which would apply to both sexes. Some possible environmental factors that could contribute to this change are smoking (which is associated with an increased MS risk47 and whose prevalence increased among women during the 20th century), or reproductive factors (though there is no evidence for an increased MS risk associated with oral contraceptive use, pregnancy,51 or a sexually transmitted agent).
In contrast to our results, a previous systematic review concluded that there was not a true latitude gradient in the incidence of this disorder.9 Two main reasons could explain the disagreement between our study and the older one. First, the previous review only included articles published between 1980 and 1998. Our review, on the other side, included articles published up to 2007. Second, we weighed study-specific incidence rates by the inverse of the variance, while the previous report did not attempt to correct for study size or number of MS cases included.
Our review has several limitations. First, the absence of incidence studies in Africa, Asia, and Central/South America makes it difficult to portray accurately the distribution of MS worldwide. Second, the lack of a uniform methodology in the studies included in our review may have introduced noise in our estimates. We tried to partially limit this problem by including only publications that provided age- and sex-specific incidence rates, which allowed us to compute standardized rates. Third, we could not differentiate between relapsing remitting and primary progressive MS. Finally, our review does not provide direct evidence regarding the causes of the attenuation in the latitude gradient or the increase in the female-to-male ratio.
ACKNOWLEDGMENT
The authors thank Dr. Alberto Ascherio for his comments on an earlier version of this manuscript.
Glossary
- MS
multiple sclerosis
- NHS
Nurses’ Health Study.
Footnotes
Alvaro Alonso was partially supported by a Fulbright fellowship.
Disclosure: The authors report no disclosures.
Received October 9, 2007. Accepted in final form March 17, 2008.
REFERENCES
- 1.Hirtz D, Thurman DJ, Gwinn-Hardy K, Mohamed M, Chaudhuri AR, Zalutsky R. How common are the “common” neurologic disorders? Neurology 2007;68:326–337. [DOI] [PubMed] [Google Scholar]
- 2.Acheson ED, Bachrach CA, Wright FM. Some comments on the relationship of the distribution of multiple sclerosis to latitude, solar radiation, and other variables. Acta Psychiatr Scand Suppl 1960;35:132–147. [DOI] [PubMed] [Google Scholar]
- 3.Miller DH, Hammond SR, McLeod JG, Purdie G, Skegg D. Multiple sclerosis in Australia and New Zealand: are the determinants genetic or environmental? J Neurol Neurosurg Psychiatry 1990;53:903–905. [DOI] [PMC free article] [PubMed] [Google Scholar]
- 4.Kurtzke JF, Beebe GW, Norman JE. Epidemiology of multiple sclerosis in US veterans: 1. Race, sex, and geographic distribution. Neurology 1979;29:1228–1235. [DOI] [PubMed] [Google Scholar]
- 5.Noseworthy JH, Lucchinetti C, Rodriguez M, Weinshenker BG. Multiple sclerosis. N Engl J Med 2000;343:938–952. [DOI] [PubMed] [Google Scholar]
- 6.Hernán MA, Olek MJ, Ascherio A. Geographic variation of multiple sclerosis incidence in two prospective studies of US women. Neurology 1999;53:1711–1718. [DOI] [PubMed] [Google Scholar]
- 7.Wallin MT, Page WF, Kurtzke JF. Multiple sclerosis in US veterans of the Vietnam era and later military service: race, sex, and geography. Ann Neurol 2004;55:65–71. [DOI] [PubMed] [Google Scholar]
- 8.Ascherio A, Munger KL. Environmental risk factors for multiple sclerosis: part I: the role of infection. Ann Neurol 2007;61:288–299. [DOI] [PubMed] [Google Scholar]
- 9.Zivadinov R, Iona L, Monti-Bragadin L, et al. The use of standardized incidence and prevalence rates in epidemiological studies on multiple sclerosis. Neuroepidemiology 2003;22:65–74. [DOI] [PubMed] [Google Scholar]
- 10.Orton S-M, Herrera BN, Yee IM, et al. Sex ratio of multiple sclerosis in Canada: a longitudinal study. Lancet Neurol 2006;5:932–936. [DOI] [PubMed] [Google Scholar]
- 11.Cutter G, Yadavalli R, Marrie R-A, et al. Changes in the sex ratio over time in multiple sclerosis. Neurology 2007;68:A162 [Google Scholar]
- 12.Pugliatti M, Rosati G, Carton H, et al. The epidemiology of multiple sclerosis in Europe. Eur J Neurol 2006;13:700–722. [DOI] [PubMed] [Google Scholar]
- 13.Wasay M, Khatri IA, Khealani B, Sheerani M. Multiple sclerosis in Asian countries. Int MS Journal 2006;13:58–65. [PubMed] [Google Scholar]
- 14.Ahmad OB, Boschi-Pinto C, Lopez AD, Murray CJL, Lozano R, Inoue M. Age standardization of rates: a new WHO standard. GPE Discussion Paper Series No. 31. Geneva: World Health Organization, 2002 [Google Scholar]
- 15.Rothman KJ, Greenland S. Measures of disease frequency. In: Rothman, KJ, Greenland S, eds. Modern Epidemiology, 2nd ed. Philadelphia: Lippincott Williams & Wilkins, 1998:29–46. [Google Scholar]
- 16.Greenland S, Rothman KJ. Introduction to stratified analysis. In: Rothman KJ, Greenland S, eds. Modern Epidemiology, 2nd ed. Philadelphia: Lippincott Williams & Wilkins, 1998:253–279. [Google Scholar]
- 17.Sundstrom P, Nystrom L, Forsgren L. Incidence (1988–97) and prevalence (1997) of multiple sclerosis in Vasterbotten County in northern Sweden. J Neurol Neurosurg Psychiatr 2003;74:29–32. [DOI] [PMC free article] [PubMed] [Google Scholar]
- 18.Kinnunen E. Multiple sclerosis in Finland: evidence of increasing frequency and uneven geographic distribution. Neurology 1984;34:457–461. [DOI] [PubMed] [Google Scholar]
- 19.Sumelahti ML, Tienari PJ, Wikstrom J, Palo J, Hakama M. Regional and temporal variation in the incidence of multiple sclerosis in Finland 1979–1993. Neuroepidemiology 2000;19:67–75. [DOI] [PubMed] [Google Scholar]
- 20.Sarasoja T, Wikstrom J, Palmataa J, Hakama M, Sumelahti ML. Occurrence of multiple sclerosis in central Finland: a regional and temporal comparison during 30 years. Acta Neurol Scand 2004;110:331–336. [DOI] [PubMed] [Google Scholar]
- 21.Larsen JP, Kvaale G, Riise T, Nyland H, Aarli JA. An increase in the incidence of multiple sclerosis in Western Norway. Acta Neurol Scand 1984;69:96–103. [DOI] [PubMed] [Google Scholar]
- 22.Svenningsson A, Runmarker B, Lycke J, Andersen O. Incidence of MS during two fifteen-year periods in the Gothenburg region of Sweden. Acta Neurol Scand 1990;82:161–168. [DOI] [PubMed] [Google Scholar]
- 23.Koch-Henriksen N, Bronnum-Hansen H, Hyllested K. Incidence of multiple sclerosis in Denmark 1948–1982: a descriptive nationwide study. Neuroepidemiology 1992;11:1–10. [DOI] [PubMed] [Google Scholar]
- 24.Murray S, Bashir K, Penrice G, Womersley J. Epidemiology of multiple sclerosis in Glasgow. Scott Med J 2004;49:100–104. [DOI] [PubMed] [Google Scholar]
- 25.Villard-Mackintosh L, Vessey MP. Oral contraceptives and reproductive factors in multiple sclerosis incidence. Contraception 1993;47:161–168. [DOI] [PubMed] [Google Scholar]
- 26.Thorogood M, Hannaford PC. The influence of oral contraceptives on the risk of multiple sclerosis. Br J Obstet Gynaecol 1998;105:1296–1299. [DOI] [PubMed] [Google Scholar]
- 27.Alonso A, Jick SS, Olek MJ, Hernán MA. Incidence of multiple sclerosis in the United Kingdom: findings from a population-based cohort. J Neurol 2007;254:1736–1741. [DOI] [PubMed] [Google Scholar]
- 28.Materljan E, Sepcic J, Antonelli L, Sepic-Grahovac D. Multiple sclerosis in Istria, Yugoslavia. Neurologija 1989;38:201–212. [PubMed] [Google Scholar]
- 29.Guidetti D, Cavalletti S, Merelli E, et al. Epidemiological survey of multiple sclerosis in the provinces of Reggio Emilia and Modena, Italy. Neuroepidemiology 1995;14:7–13. [DOI] [PubMed] [Google Scholar]
- 30.Granieri E, Malagu S, Casetta I, et al. Multiple sclerosis in Italy: a reappraisal of incidence and prevalence in Ferrara. Arch Neurol 1996;53:793–798. [DOI] [PubMed] [Google Scholar]
- 31.Mayr WT, Pittock SJ, McClelland RL, Jorgensen NW, Noseworthy JH, Rodriguez M. Incidence and prevalence of multiple sclerosis in Olmsted County, Minnesota, 1985–2000. Neurology 2003;61:1373–1377. [DOI] [PubMed] [Google Scholar]
- 32.Hammond SR, McLeod JG, Millingen KS, et al. The epidemiology of multiple sclerosis in three Australian cities: Perth, Newcastle and Hobart. Brain 1988;111:1–25. [DOI] [PubMed] [Google Scholar]
- 33.Rosati G, Aiello I, Pirastru MI, et al. Epidemiology of multiple sclerosis in northwestern Sardinia: further evidence for higher frequency in Sardinians compared to other Italians. Neuroepidemiology 1996;15:10–19. [DOI] [PubMed] [Google Scholar]
- 34.Pugliatti M, Sotgiu S, Solinas G, et al. Multiple sclerosis epidemiology in Sardinia: evidence for a true increasing risk. Acta Neurol Scand 2001;103:20–26. [DOI] [PubMed] [Google Scholar]
- 35.Milonas I, Tsounis S, Logothetis I. Epidemiology of multiple sclerosis in northern Greece. Acta Neurol Scand 1990;81:43–47. [DOI] [PubMed] [Google Scholar]
- 36.Granieri E, Casetta I, Govoni V, et al. The increasing incidence and prevalence of MS in a Sardinian province. Neurology 2000;55:842–847. [DOI] [PubMed] [Google Scholar]
- 37.Grimaldi LME, Salemi G, Grimaldi G, et al. High incidence and increasing prevalence of MS in Enna (Sicily), southern Italy. Neurology 2001;57:1891–1893. [DOI] [PubMed] [Google Scholar]
- 38.Nicoletti A, Lo Bartolo ML, Lo Fermo S, et al. Prevalence and incidence of multiple sclerosis in Catania, Sicily Neurology 2001;56:62–66. [DOI] [PubMed] [Google Scholar]
- 39.Nicoletti A, Patti F, Lo Fermo S, et al. Possible increasing risk of multiple sclerosis in Catania, Sicily. Neurology 2005;65:1259–1263. [DOI] [PubMed] [Google Scholar]
- 40.Grimaldi LME, Palmeri B, Salemi G, et al. High prevalence and fast rising incidence of multiple sclerosis in Caltanissetta, Sicily, southern Italy. Neuroepidemiology 2007;28:28–32. [DOI] [PubMed] [Google Scholar]
- 41.Barnett MH, Williams DB, Day S, Macaskill P, McLeod JG. Progressive increase in incidence and prevalence of multiple sclerosis in Newcastle, Australia: a 35-year study. J Neurol Sci 2003;213:1–6. [DOI] [PubMed] [Google Scholar]
- 42.Aladro Y, Alemany MJ, Pérez-Vieitez MC, et al. Prevalence and incidence of multiple sclerosis un Las Palmas, Canary Islands, Spain. Neuroepidemiology 2005;24:70–75. [DOI] [PubMed] [Google Scholar]
- 43.Hammond SR, de Wytt C, Maxwell IC, et al. The epidemiology of multiple sclerosis in Queensland, Australia J Neurol Sci 1987;80:185–204. [DOI] [PubMed] [Google Scholar]
- 44.Midgard R, Riise T, Svanes C, Kvale G, Nyland H. Incidence of multiple sclerosis in More and Romsdal, Norway from 1950 to 1991: an age-period-cohort analysis. Brain 1996;119:203–211. [DOI] [PubMed] [Google Scholar]
- 45.Kurtzke JF, Beebe GW, Norman JE Jr. Epidemiology of multiple sclerosis in US veterans: III: migration and the risk of MS. Neurology 1985;35:672–678. [DOI] [PubMed] [Google Scholar]
- 46.Gale CR, Martyn CN. Migrant studies in multiple sclerosis. Progr Neurobiol 1995;47:427–448. [PubMed] [Google Scholar]
- 47.Ascherio A, Munger KL. Environmental risk factors for multiple sclerosis: part II: noninfectious factors. Ann Neurol 2007;61:504–513. [DOI] [PubMed] [Google Scholar]
- 48.Munger KL, Zhang SM, O’Reilly E, et al. Vitamin D in-take and incidence of multiple sclerosis. Neurology 2004;62:60–65. [DOI] [PubMed] [Google Scholar]
- 49.Munger KL, Levin LI, Hollis BW, Howard NS, Ascherio A. Serum 25-hydroxyvitamin D levels and risk of multiple sclerosis. JAMA 2006;296:2832–2838. [DOI] [PubMed] [Google Scholar]
- 50.Bach JF. The effect of infections on susceptibility to autoimmune and allergic diseases. N Engl J Med 2002;347:911–919. [DOI] [PubMed] [Google Scholar]
- 51.Alonso A, Jick SS, Olek MJ, Ascherio A, Jick H, Hernán MA. Recent use of oral contraceptives and the risk of multiple sclerosis. Arch Neurol 2005;62:1362–1365. [DOI] [PubMed] [Google Scholar]


