Abstract
Previous research has shown that listeners can adapt to particular samples of noise, a phenomenon known as “frozen noise” [Langhans and Kohlrausch, J. Acoust. Soc. Am. 125, 3456–3470 (1992)]. However, no studies have reported a similar effect for multi-talker babble. The results of this study comparing open-set word recognition in multi-talker babble showed that listeners are significantly more accurate when the babble is fixed than when the babble is random. This documents the effect the authors refer to as “frozen babble.”
I. Introduction
Previous studies have shown that listeners can adapt to particular repeated samples of identical noise, a phenomenon known as “frozen noise.” For example, Langhans and Kohlrausch (1992) reported that the threshold for listeners to detect the presence of signals presented in frozen noise is significantly lower than for signals presented in random noise. However, no studies have reported such effects for multi-talker babble, a form of noise that is being used more in studies of speech perception and spoken word recognition due to its high level of ecological validity (e.g., Killion et al., 2004; Cutler et al., 2004; Wilson, 2003). In this paper, we report a subset of data from a larger study, in which a change in our methodology allows us to compare spoken word recognition performance of words mixed with a fixed segment of babble to spoken word recognition of words mixed with a random segment of babble.
II. Method
A. Materials
The stimulus list consisted of 1428 English words chosen from the Hoosier Mental Lexicon (HML; Nusbaum et al., 1984), designed to be a representative sample of the entire English lexicon. To create a representative sample, the list was constructed such that it did not differ statistically from either the HML or the CELEX (Baayen et al., 1993) on the following features: (1) number of phonemes, (2) number of syllables, (3) syllable structure, (4) initial phoneme, and (5) lexical frequency.
Digital audio recordings of each word were created from the production of a male speaker of American English in an IAC sound-proof booth at a sampling rate of . Six-talker babble (three male and three female speakers) from the Connected Speech Test (Cox et al., 1987) was added to the stimuli at three different signal-to-noise ratios (S/N): 0, 5, and . The signal was centrally embedded in the babble, with a leading and trailing of babble. The S/N ratio for each token was determined by comparing the rms average amplitude of the signal file with the babble file.
B. Procedure
The stimuli were presented to 96 native English-speaking undergraduates from Indiana University over Beyer-Dynamic D-210 headphones at SPL. Each listener heard only one-quarter of the stimuli (357). One-third of the stimuli were presented at each S/N and were fully randomized such than no listener heard the same words at the same S/N. The experiment was self-paced and responses were typed on a keyboard.
C. Fixed versus random babble
After running the first 48 listeners, two changes in the methodology were made. The first change involved a switch from using a fixed portion of babble to a random portion of babble. That is, the stimuli presented to the first 48 listeners used a segment of multi-talker babble which always began at a fixed point. In contrast, the stimuli for the remaining 48 listeners were mixed with randomly selected segments of multi-talker babble.
In addition to the fixed versus random babble difference, a slightly different leveling procedure was used for the stimuli presented to the final 48 listeners. The level of the stimuli with fixed babble was equated before mixing in the multi-talker babble, which had the effect that the overall level of the stimuli increased as S/N decreased. Alternatively, the random babble stimuli were releveled after mixing in the babble, so that the average rms amplitude of all the stimuli was equal.
III. Results and discussion
Figure 1 shows the mean accuracy rates for listeners in the frozen and random babble conditions. The listeners in the random babble condition were significantly less accurate (, ) on the word recognition task than the listeners in the frozen babble condition (, ; , ). To determine whether these differences were due to random subject factors, the listeners in each condition were split in half and the two groups were compared. No significant difference was found between the two subgroups in either condition.
FIG. 1.
Percent correct of fixed and random babble groups.
The significant difference in word recognition accuracy between the listeners in the fixed babble condition and the random babble condition is consistent with the claim that the listeners in the former condition adapted to the frozen babble. However, it remains possible that the difference was related to the releveling of the stimuli.1 To address this, we examined changes in accuracy over the course of the experiment. If the accuracy difference comes from listeners adapting to the frozen babble, we should see an improvement over the course of the experiment (as they become more familiar with the noise pattern). Note that it is common for listeners to improve over the course of an experiment as they become more familiar with the task. It is likely that the listeners in the random babble condition will also show some learning, but not as much as the listeners in the fixed babble condition. If listeners in the fixed babble condition show a steeper learning curve than those in the random babble condition, we can conclude that the difference in accuracy is not due to the way the stimuli were leveled, but rather to the difference between fixed and random babble.
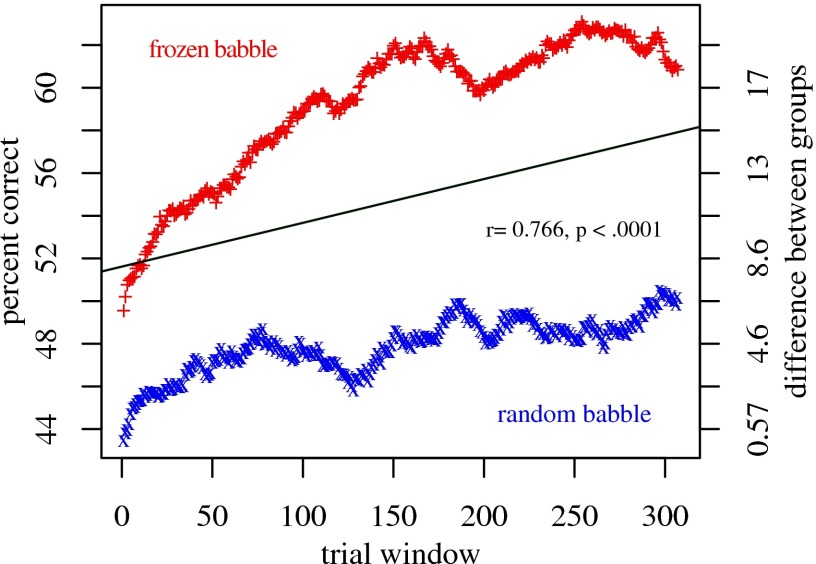
Figure 2 displays the accuracy for subjects in each condition over a moving 50-trial window. The first point represents trials 1–50, the second point 2–51, and so on. To determine whether these learning rates were significantly different, the frozen babble values were subtracted from the random babble values, and a Pearson’s correlation test was performed between these differences and the trial window. If the learning rates are the same, then there should be no correlation (as the difference should be a horizontal line). However, a significant positive correlation indicates that the frozen babble group shows a steeper learning rate. This analysis revealed a strong positive correlation (; ), consistent with the claim that the difference in accuracy shown in Fig. 1 is an example of the frozen noise phenomenon.
FIG. 2.
Learning rate for fixed and random babble. Each point corresponds to the mean percent correct for all subjects in the respective condition over a 50 trial window starting with trials 1–50 and ending with trials 308–357. The left axis shows percent correct. The line shows the least-squares fit to the difference in percent correct between the two groups for each 50 trial window and is represented by the right axis.
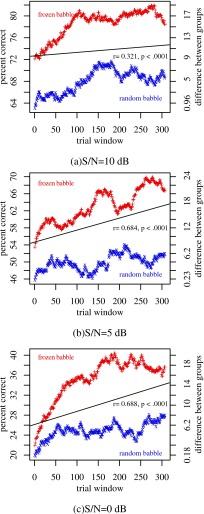
In order to determine whether the frozen noise phenomenon can be changed based on the S/N ratio in the stimuli, we also analyzed the data at each S/N ratio. Analysis of the learning rate between the fixed and random babble groups was significant at each S/N ratio, as shown in Fig. 3. In addition, learning rate was computed for each listener as the slope of the least-squares fit regression line to the moving window data for each listener. A ANOVA was carried out with learning rate as the dependent variable, babble type (fixed versus random) as between subjects factor, and S/N (0, 5, and ) as within subjects factor. The ANOVA showed babble type to be a significant factor (, , , ), but neither S/N (, ) nor the S/N by babble type interaction was significant.
FIG. 3.
Learning rate for fixed and random babble by S/N. The axes are the same as in Fig. 2 but broken down for each S/N used.
IV. Conclusions
Our results indicate that the frozen noise phenomenon affects listeners who listen to stimuli mixed with the same set of multi-talker babble. Although this outcome is expected given the literature on frozen noise, this has not been previously reported for multi-talker babble, which has been used in a number of studies in recent years. Some of these studies have used frozen babble (e.g., Cutler et al., 2004; Engen and Bradlow, 2007),2 while others have used random babble (e.g., Killion et al., 2004; Wilson, 2003). Depending upon the research questions being investigated, the use of frozen babble may be desired. It is our hope that this finding will aid researchers in designing future experiments using stimuli mixed with multi-talker babble.
Footnotes
A recent study by Engen (2007) found that releveling stimuli of different S/N ratios had little effect. Nevertheless, this possibility will be considered here.
Note that Engen and Bradlow (2007) repeated the same segment of babble in their six-talker babble condition, while they alternated randomly between four different segments of babble in the two-talker babble condition.
REFERENCES
- 1.Baayen, H. R. , Piepenbrock, R., and Rijn, H. (1993). “The CELEX lexical database,” (CD-ROM) (Linguistics Data Consortium, University of Pennsylvania, Philadelphia).
- 2.Cox, R. M. , Alexander, G. C. , and Gilmore, C. (1987). “Development of the connected speech test (cst),” Ear Hear. 10.1097/00003446-198710001-000108, 119S–126S [DOI] [PubMed] [Google Scholar]
- 3.Cutler, A., Weber, A., Smits, R., and Cooper, N. (2004). “Patterns of English phoneme confusions by native and non-native listeners,” J. Acoust. Soc. Am. 10.1121/1.1810292116, 3668–3678 [DOI] [PubMed] [Google Scholar]
- 4.Engen, K. J. V. (2007). “A methodological note on signal-to-noise ratios in speech research,” J. Acoust. Soc. Am. 122, 2994 [Google Scholar]
- 5.Engen, K. J. V. , and Bradlow, A. R. (2007). “Sentence recognition in native- and foreign-language multi-talker background noise,” J. Acoust. Soc. Am. 10.1121/1.2400666121, 519–526 [DOI] [PMC free article] [PubMed] [Google Scholar]
- 6.Killion, M. C. , Niquette, P. A. , and Gudmundsen, G. I. (2004). “Development of a quick speech-in-noise test for measuring signal-to-noise ratio loss in normal-hearing and hearing-impaired listeners,” J. Acoust. Soc. Am. 10.1121/1.1784440116, 2395–2405 [DOI] [PubMed] [Google Scholar]
- 7.Langhans, A., and Kohlrausch, A. (1992). “Differences in auditory performance between monaural and diotic conditions. I. Masked thresholds in frozen noise,” J. Acoust. Soc. Am. 10.1121/1.40283491, 3456–3470 [DOI] [PubMed] [Google Scholar]
- 8.Nusbaum, H. C. , Pisoni, D. B. , and Davis, C. K. (1984), “Sizing up the hoosier mental lexicon: Measuring the familiarity of 20,000 words,” Research on Speech Perception Progress Report 10, Speech Research Laboratory, Psychology Department, Indiana University, Bloomington.
- 9.Wilson, R. H. (2003). “Development of a speech-in-multitalker-babble paradigm to assess word-recognition performance,” J. Am. Acad. Audiol 14, 453–470 [PubMed] [Google Scholar]


