

Abstract
Background
The purpose of this study was to test the hypothesis that decreased dietary intake of Vitamin D contributes to Vitamin D deficiency in end-stage renal disease (ESRD) patients on hemodialysis (HD).
Methods
We performed a cross-sectional study of 58 hemodialysis outpatients from two Mount Sinai Medical Center (MSMC)-affiliated outpatient HD units in New York City and 648 outpatients at MSMC with CKD stages I-IV. Serum 25(OH)D concentrations were measured from August 2010 to July of 2011 in recruited hemodialysis patients (n=58) and linked with results of dietary and lifestyle surveys. The Mount Sinai Data Warehouse (electronic medical record) was used to capture 25(OH) Vitamin D levels for outpatients with CKD stages I-IV who had Vitamin D testing during the same time period.
Results
The prevalence of Vitamin D insufficiency/deficiency in the HD cohort was 96.6%. Mean (SD) and median (IQR) 25(OH)D concentrations were 15.65 (6.82) and 13.55 (10.15) ng/mL, respectively. Dietary surveys showed a median weekly Vitamin D intake of 1044 IU (IQR=808, vs. a recommended weekly allowance of 4200 IU) and specific avoidance of foods containing both Vitamin D and phosphorus. In contrast, mean and median 25(OH)D concentrations in patients with CKD stages I-IV were 25.66 (13.44) and 23.60 (15.48) ng/mL (p<0.001 vs. HD patients).
Conclusions
Vitamin D deficiency is more prevalent in HD patients than in pre-dialysis patients with CKD and is associated with decreased dietary intake of Vitamin D. Dialysis restrictions imposed to reduce dietary phosphorus intake likely contributes to the development of hypovitaminosis D in ESRD patients.
Keywords: Hemodialysis diet, Phosphorus, Vitamin D deficiency
Introduction
Vitamin D deficiency (serum 25(OH)D levels <20 ng/mL), and insufficiency (serum 25(OH)D levels <30 ng/mL), [1] are common in patients with chronic kidney disease (CKD), [2] including patients with end-stage renal disease (ESRD) on maintenance hemodialysis (HD) despite treatment with 1,25(OH)2D (or its equivalent) to prevent/reverse osteopenia [3-5]. Vitamin D deficiency is associated with increased morbidity and decreased survival in patients with CKD and ESRD [3,6]. The etiologies of hypovitaminosis D in the ESRD population are not clear, but include limited sunlight exposure, reduced UVB-induced Vitamin D synthesis in the skin, and disturbed Vitamin D metabolism [2,7-9]. In the United States, a significant source of Vitamin D is the consumption of Vitamin D fortified foods, in particular dairy products [10]. Whether the physician/nutritionist imposed, phosphorus-restricted, “renal diet” impacts serum Vitamin D levels HD patients has not been studied.
To understand this issue, we undertook a cross-sectional study of HD patients at two outpatient dialysis units in New York City, examining Vitamin D status (serum 25(OH)D), sun exposure, and dietary Vitamin D intake using a dietary and lifestyle survey tool. We compared Vitamin D status to that of a cohort of pre-dialysis outpatients with CKD to address the impact of HD on Vitamin D levels.
Subjects and Methods
Study design and data collection
The study was approved by the Institutional Review Board (IRB) of the Mount Sinai School of Medicine and in adherence with the Declaration of Helsinki. Patients from two outpatient hemodialysis units in New York City (Mount Sinai Medical Center and Terrence Cardinal Cooke) were recruited over the course of one year (from August 2010 to July of 2011) and enrolled into the study after providing written informed consent. Patients must have been receiving hemodialysis for at least two months prior to enrollment to be included in the study. Clinical and demographic characteristics of the patients (including self-reported race and ethnicity, past medical history, anthropometric parameters, medications, and clinically-indicated laboratory tests) were collected at the time of enrollment, and peripheral blood samples were obtained for 25(OH)D testing during the hemodialysis procedure. Serum 25(OH)D levels were determined commercially by the DiaSorin 25(OH)D competitive chemiluminescent immunoassay (CLIA) [11] in a CLIA-certified laboratory (Nationwide Laboratories, Ft. Lauderdale, FL, USA).
A dietary and lifestyle survey was performed in each study subject after enrollment describing sun exposure and dietary intake of Vitamin D-rich foods (attached as Supplemental Appendix A).
The Mount Sinai Data Warehouse was used to obtain de-identified Vitamin D data for a comparison group consisting of all outpatients with CKD stages I-IV (ICD-9 codes: 585.0, 585.1, 585.2, 585.3, 585.4). Patients with the above ICD-9 diagnoses and a 25(OH)D level measured between August 2010 and July 2011 were included in the query. For patients with multiple 25(OH)D levels during that time period, only the first level was included in the analysis. Any patients with a concomitant ICD-9 diagnosis of 585.5 and 585.6 were excluded to exclude any patients with ESRD on dialysis.
Statistical methods
Continuous data are reported as means (+/- SD) for normally distributed variables or medians (IQR) for non-normally distributed variables. Categorical data are reported as percentages of total. The Kolmogorov-Smirnov test was used to determine the distribution of continuous variables. Correlations between continuous variables (i.e. age and 25(OH)D level) were determined using a Spearman's correlation coefficient. Comparison of continuous variables between groups was done using Mann-Whitney or Student's t-test, as appropriate. Comparison of categorical variables was done using a Chi-square test or Fisher's Exact test, as appropriate. Two-sided p<0.05 was considered to be statistically significant. All analyses were performed using SPSS version 19.0 (SPSS, Chicago, IL, USA).
Results
We performed serum 25(OH)D testing and dietary and lifestyle surveys in 58 patients with ESRD (Table 1). The majority of patients were male and of African ancestry, the average age of study participants was 59 years, the median time on dialysis was 4 years, and most patients developed ESRD as a result of diabetes and/or hypertension. Twenty-one (36.2%) patients reported taking a daily multivitamin and 41 (70.7%) patients reported taking phosphorus binders (calcium carbonate, calcium acetate, or sevelamer). Thirty-seven (63.8%) patients were receiving activated Vitamin D (1,25(OH)2D) in the form of intravenous doxercalciferol or paricalcitol during hemodialysis.
Table 1.
Population Demographics (N=58)
| Age, years (mean +/- SD) | 59 +/- 15 |
| Gender: Male (%) | 34 (58.6%) |
| Race: Black (%) | 39 (67.2%) |
| White (%) | 18 (31.0%) |
| Other (%) | 1 (1.7%) |
| Ethnicity: Hispanic (%) | 19 (32.8%) |
| Non-Hispanic (%) | 39 (67.2%) |
| Dialysis Vintage, years (median, IQR) | 4 (6) |
| Smoking Status: Nonsmoker (%) | 33 (56.9%) |
| Current Smoker (%) | 7 (12.1%) |
| Former Smoker (%) | 18 (31.0%) |
| Body Mass Index (BMI) (median, IQR) | 26.95 (8.3) |
| Cause of ESRD: Hypertension (%) | 16 (27.6%) |
| Diabetes (%) | 16 (27.6%) |
| Glomerulonephritis (%) | 5 (8.6%) |
| Polycystic Kidney Disease (%) | 3 (5.2%) |
| Other (%) | 18 (31.0%) |
| Comorbidities: Diabetes (%) | 23 (39.7%) |
| Peripheral vascular disease (%) | 13 (22.4%) |
| Coronary artery disease (%) | 12 (20.7%) |
| Hepatitis C (%) | 10 (17.2%) |
| Failed kidney transplant (%) | 9 (15.5%) |
| Dialysis Access: Arteriovenous Fistula (%) | 37 (63.8%) |
| Arteriovenous Graft (%) | 9 (15.5%) |
| Tunneled Catheter (%) | 12 (20.6%) |
The prevalence of Vitamin D insufficiency (25(OH)D<30ng/mL) was 96.6%. Over seventy percent (70.7%) of patients met criteria for Vitamin D deficiency (25(OH)D<20ng/mL), with 20.7% of patients severely deficient (25(OH)D<10ng/mL, Figure 1). Mean (SD) and median (IQR) 25(OH)D were 15.65 (6.82) and 13.55 (10.15) ng/mL, respectively. The distribution of 25(OH)D concentrations was similar regardless of the month of testing (Table S1), and patient characteristics did not vary between the deficient and insufficient/normal groups (Table 2).
Figure 1.

Serum 25(OH)D (ng/mL) of the HD cohort (n=58)
Table 2.
Patient Characteristics of Deficient (25(OH)D<20ng/mL) versus Non-deficient Study Subjects
| Deficient (n=41) | Non-Deficient (n=17) | P-value | |
|---|---|---|---|
| Age, years (mean +/- SD) | 60 +/- 16 | 58 +/- 13 | 0.731 |
| Gender: Male (%) | 25 (61.0%) | 9 (52.9%) | 0.572 |
| Race: Black (%) | 30 (73.2%) | 9 (52.9%) | 0.208 |
| White (%) | 10 (24.4%) | 8 (47.1%) | |
| Other (%) | 1 (2.4%) | 0 (0.0%) | |
| Dialysis Vintage, years (median, IQR) | 4 +/- 6 | 3.5 +/- 6 | 0.644 |
| Body Mass Index (BMI) (median, IQR) | 27.8 (6.4) | 26.7 (12.5) | 0.718 |
We found no statistically significant associations between 25(OH)D concentration and age, gender, race, ethnicity, dialysis vintage, smoking status, or body mass index (BMI). There were also no significant associations between 25(OH)D and other laboratory parameters of mineral metabolism, nutrition, and inflammation, including serum calcium, phosphorus, intact parathyroid hormone (PTH), albumin, and ferritin (Table 3).
Table 3.
Laboratory Markers of Mineral Metabolism, Nutrition, and Inflammation and Correlation with serum 25(OH)D
| Value | Spearman’s correlation coefficient (rho) | P-value | |
|---|---|---|---|
| Calcium, mg/dL, median (IQR) | 9,2 (1.0) | −0.242 | 0.067 |
| Phosphorus, mg/dL, mean +/- SD | 5.8 +/- 1.4 | −0.018 | 0.895 |
| Intact Parathyroid Hormone, pg/mL, median (IQR) | 373 (413) | −0.047 | 0.725 |
| Albumin, g/dL, median (IQR) | 3.9 (0.4) | −0.095 | 0.479 |
| Ferritin, ng/mL, median (IQR) | 454 (321) | −0.080 | 0.551 |
Lifestyle surveys revealed that in the summer, patients spent a median number of 7 days/week outside for more than 15 minutes; in the winter, they spent a median number of 3 days/week outside for more than 15 minutes. Thirteen (22.4%) patients reported regular sunscreen use.
Dietary surveys showed a median weekly vitamin D intake of 1044 IU (IQR=808), well below the Institute of Medicine's (IOM) recommended dietary allowance (RDA) of Vitamin D of 600 IU/day, or 4200 IU/week [12]. The median number of servings/week of specific Vitamin D-rich foods consumed is given in Table 4. The avoidance of dairy products (milk, yogurt, and cheese) was as per the dialysis unit dietician recommendations, as these foods are also high in phosphorus.
Table 4.
Median Intake of Vitamin D Rich Foods
| Item | Vit D (IU) per serving | Amount per serving | Median number servings/week (IQR) | Total vit D/week (IU) |
|---|---|---|---|---|
| Fish | 100-654 | 3oz | 2(2) | 200-1308 |
| Milk | 100 | 8oz | 0.5 (2) | 50 |
| Yogurt | 80 | 6oz | 0 (0.75) | 0 |
| Cheese | 6-12 | 1oz | 6 (5) | 36-72 |
| Cereal | 40 | 1cup | 2 (4) | 80 |
| Eggs | 20-25 | 1egg | 5 (5) | 100-125 |
| Total 520-1689 IU/week |
The high prevalence of Vitamin D deficiency in HD patients and low intake of Vitamin D containing foods (which are also high in phosphates) suggested the possibility that initiating HD results in lower serum Vitamin D, in part because of imposed dietary restrictions to limit phosphate intake. In an effort to address this possibility, we compared serum 25(OH)D concentrations in the HD cohort with those of a cohort of 648 outpatients followed over the same time period at Mount Sinai Medical Center carrying diagnoses of chronic kidney disease stages (CKD) I-IV. This analysis revealed mean (SD) and median (IQR) 25(OH)D concentrations of 25.66 (13.44) and 23.60 (15.48) ng/mL, respectively in the CKD cohort, significantly higher than the serum concentrations in the HD patients (Figure 2 and 3, p<0.001).
Figure 2.

Serum 25(OH)D (ng/mL) of the CKD cohort (n=648)
Figure 3.
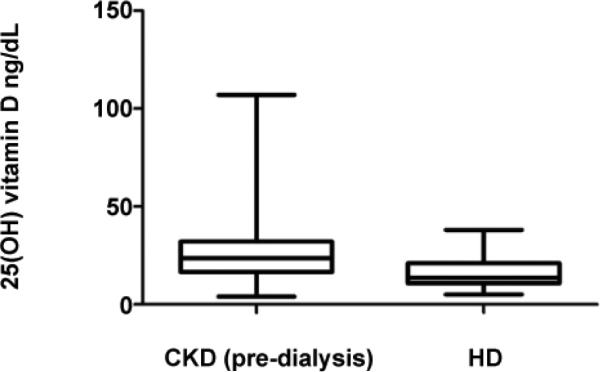
Serum 25(OH)D (ng/mL) of the CKD cohort (n=648) vs HD cohort (n=58)* *p < 0.001
Discussion
Our results extend previously published studies indicating a high prevalence of Vitamin D deficiency/insufficiency among HD outpatients by providing new insight into the etiology of this observation [3-5]. While others have suggested that patient race, time of year of testing (due to limited sunlight exposure), and rates of sunscreen use can impact serum Vitamin D levels [13], our data indicate that these factors are largely inconsequential in our patient population, as all HD patients appeared to be at risk. In contrast, as we found a) avoidance of phosphate rich, Vitamin D containing foods by the HD patients and b) that patients with CKD (not on dialysis) have higher serum 25(OH)D concentrations than HD patients, our data suggest that dialysis-imposed dietary restrictions contribute to the hypovitaminosis D. Since many patients struggle to adhere to phosphate binder regimens, they are often counseled against dairy product consumption by their nephrologists and renal dieticians. Nutritional guidelines for dialysis patients are consistent with this conclusion as they recommend limited intake of Vitamin D-containing dairy products [14]. Serial measurements of Vitamin D levels in prospectively followed cohorts of CKD patients as they initiate dialysis are needed to formally prove this hypothesis.
We acknowledge that other factors may influence Vitamin D status in HD patients, including physiological effects of progression of renal disease that impair Vitamin D metabolism (i.e. elevated fibroblast growth factor-23 levels) [15], and limited ultraviolet-B (UVB) exposure. The majority of patients surveyed in our study had enough sun exposure (at least during the summer) to achieve maximal cutaneous Vitamin D synthesis [16]. 22.4% of patients in our study reported regular sunscreen use. Sunscreen, when used appropriately, reduces the capacity of the skin to produce vitamin D3 by 95% [17]. Regardless, physiological or environmental circumstances that hinder the production of D3 in the skin are generally compensated for by increased dietary intake of vitamin D [18], which did not occur in our cohort. HD patients in our study consumed well below the Institute of Medicine's (IOM) recommended dietary allowance (RDA) of Vitamin D of 600 IU/day, or 4200 IU/week [12], and essentially none were being treated with Vitamin D supplements. It is also possible that oral Vitamin D supplementation, which can be administered to CKD patients, was discontinued as the patients initiated dialysis, contributing to lower serum Vitamin D levels over time, although this is purely speculative.
Despite the high prevalence of 25(OH)D deficiency among dialysis patients, screening for Vitamin D deficiency is not standard of care in many dialysis units. Perhaps this is due to a perception that treatment with activated Vitamin D(1,25(OH)2D) bypasses any need for its precursor (25(OH)D). Most chronic hemodialysis patients are treated for secondary hyperparathyroidism with intravenous activated Vitamin D or its analogs (i.e. doxercalciferol or paricalcitol), as renal 1-alpha hydroxylase is decreased or absent in these patients, and intact parathyroid hormone levels are used to guide therapy. The impact of 25(OH)D deficiency and its treatment on secondary hyperparathyroidism and renal bone disease in dialysis patients is not known, and no guidelines for therapy in this population exist.
Vitamin D (25(OH)D) has many biological effects beyond those affecting bone metabolism, including potent immunomodulatory and anti-inflammatory effects [19,20]. Up to two-thirds of dialysis patients are characterized by a malnutrition-inflammation syndrome [21], and many display disturbances in both innate and adaptive immunity [22-32]. This raises the intriguing hypothesis that Vitamin D deficiency could contribute to the inflammation and immune abnormalities found in this patient population, making it imperative that we understand the etiology of this problem and pursue solutions. Larger prospective studies of cohorts of patients with CKD progressing to ESRD are necessary to achieve this goal, as our study is limited by its single-center nature, small sample size, and reliance on patient recall for dietary history.
In conclusion, our data build upon previous work by providing evidence that the high prevalence (>90%) of Vitamin D deficiency and insufficiency among hemodialysis outpatients accompanies decreased consumption of Vitamin D-rich foods, a phenomenon which may be inadvertently caused by dialysis-imposed dietary restrictions. As evidence suggests that Vitamin D deficiency has negative health consequences and that oral Vitamin D repletion can be administered safely to dialysis patients, [20,33,34] our findings support the need for controlled studies to address the impact of Vitamin D repletion (via supplements and/or dietary modifications) on dialysis patient health.
Supplementary Material
Acknowledgements
We would like to thank the physicians, staff, and patients at the Mount Sinai Medical Center and Terrence Cardinal Cooke dialysis units for their participation. This study was funded by grants from the National Kidney Foundation (to PSH) and American Heart Association (to AM) as well as grant UL1TR000067 from the National Center for Advancing Translational Sciences (NCATS), National Institutes of Health (NIH).
Footnotes
Conflict of Interest Statement
The authors have no other relevant conflicts of interests.
References
- 1.Holick MF. Vitamin D deficiency. N Engl J Med. 2007;357:266–281. doi: 10.1056/NEJMra070553. [DOI] [PubMed] [Google Scholar]
- 2.Mehrotra R, Kermah D, Budoff M, Salusky IB, Mao SS, et al. Hypovitaminosis D in chronic kidney disease. Clin J Am Soc Nephrol. 2008;3:1144–1151. doi: 10.2215/CJN.05781207. [DOI] [PMC free article] [PubMed] [Google Scholar]
- 3.Wolf M, Shah A, Gutierrez O, Ankers E, Monroy M, et al. Vitamin D levels and early mortality among incident hemodialysis patients. Kidney Int. 2007;72:1004–1013. doi: 10.1038/sj.ki.5002451. [DOI] [PubMed] [Google Scholar]
- 4.Jean G, Terrat JC, Vanel T, Hurot JM, Lorriaux C, et al. Daily oral 25-hydroxycholecalciferol supplementation for vitamin D deficiency in haemodialysis patients: effects on mineral metabolism and bone markers. Nephrology, dialysis, transplantation: official publication of the European Dialysis and Transplant Association - European Renal Association. 2008;23:3670–3676. doi: 10.1093/ndt/gfn339. [DOI] [PubMed] [Google Scholar]
- 5.Del Valle E, Negri AL, Aguirre C, Fradinger E, Zanchetta JR. Prevalence of 25(OH) vitamin D insufficiency and deficiency in chronic kidney disease stage 5 patients on hemodialysis. Hemodial Int. 2007;11:315–321. doi: 10.1111/j.1542-4758.2007.00186.x. [DOI] [PubMed] [Google Scholar]
- 6.Pilz S, Iodice S, Zittermann A, Grant WB, Gandini S. Vitamin D status and mortality risk in CKD: a meta-analysis of prospective studies. Am J Kidney Dis. 2011;58:374–382. doi: 10.1053/j.ajkd.2011.03.020. [DOI] [PubMed] [Google Scholar]
- 7.Doorenbos CR, van den Born J, Navis G, de Borst MH. Possible renoprotection by vitamin D in chronic renal disease: beyond mineral metabolism. Nat Rev Nephrol. 2009;5:691–700. doi: 10.1038/nrneph.2009.185. [DOI] [PubMed] [Google Scholar]
- 8.Jacob AI, Sallman A, Santiz Z, Hollis BW. Defective photoproduction of cholecalciferol in normal and uremic humans. J Nutr. 1984;114:1313–1319. doi: 10.1093/jn/114.7.1313. [DOI] [PubMed] [Google Scholar]
- 9.Helvig CF, Cuerrier D, Hosfield CM, Ireland B, Kharebov AZ, et al. Dysregulation of renal vitamin D metabolism in the uremic rat. Kidney Int. 2010;78:463–472. doi: 10.1038/ki.2010.168. [DOI] [PubMed] [Google Scholar]
- 10.Calvo MS, Whiting SJ, Barton CN. Vitamin D fortification in the United States and Canada: current status and data needs. Am J Clin Nutr. 2004;80:1710S–6S. doi: 10.1093/ajcn/80.6.1710S. [DOI] [PubMed] [Google Scholar]
- 11.Wagner D, Hanwell HE, Vieth R. An evaluation of automated methods for measurement of serum 25-hydroxyvitamin D. Clin Biochem. 2009;42:1549–1556. doi: 10.1016/j.clinbiochem.2009.07.013. [DOI] [PubMed] [Google Scholar]
- 12.Ross AC, Manson JE, Abrams SA, Aloia JF, Brannon PM, et al. The 2011 report on dietary reference intakes for calcium and vitamin D from the Institute of Medicine: what clinicians need to know. J Clin Endocrinol Metab. 2011;96:53–58. doi: 10.1210/jc.2010-2704. [DOI] [PMC free article] [PubMed] [Google Scholar]
- 13.Gilchrest BA. Sun exposure and vitamin D sufficiency. Am J Clin Nutr. 2008;88:570S–577S. doi: 10.1093/ajcn/88.2.570S. [DOI] [PubMed] [Google Scholar]
- 14.National Kidney Foundation Dietary Guidelines for Adults Starting on Hemodialysis.
- 15.Quarles LD. Role of FGF23 in vitamin D and phosphate metabolism: implications in chronic kidney disease. Exp Cell Res. 2012;318:1040–1048. doi: 10.1016/j.yexcr.2012.02.027. [DOI] [PMC free article] [PubMed] [Google Scholar]
- 16.Holick MF, Jenkins M. The UV advantage. ibooks. 2004 Incorporated. [Google Scholar]
- 17.Matsuoka LY, Ide L, Wortsman J, MacLaughlin JA, Holick MF. Sunscreens suppress cutaneous vitamin D3 synthesis. J Clin Endocrinol Metab. 1987;64:1165–1168. doi: 10.1210/jcem-64-6-1165. [DOI] [PubMed] [Google Scholar]
- 18.Calvo MS, Whiting SJ, Barton CN. Vitamin D intake: a global perspective of current status. J Nutr. 2005;135:310–316. doi: 10.1093/jn/135.2.310. [DOI] [PubMed] [Google Scholar]
- 19.Tsoukas CD, Provvedini DM, Manolagas SC. 1,25-dihydroxyvitamin D3: a novel immunoregulatory hormone. Science. 1984;224:1438–1440. doi: 10.1126/science.6427926. [DOI] [PubMed] [Google Scholar]
- 20.Holick MF. Sunlight and vitamin D for bone health and prevention of autoimmune diseases, cancers, and cardiovascular disease. Am J Clin Nutr. 2004;80:1678S–88S. doi: 10.1093/ajcn/80.6.1678S. [DOI] [PubMed] [Google Scholar]
- 21.Noori N, Kovesdy CP, Dukkipati R, Feroze U, Molnar MZ, et al. Racial and ethnic differences in mortality of hemodialysis patients: role of dietary and nutritional status and inflammation. Am J Nephrol. 2011;33:157–167. doi: 10.1159/000323972. [DOI] [PMC free article] [PubMed] [Google Scholar]
- 22.Griveas I, Visvardis G, Fleva A, Papadopoulou D, Mitsopoulos E, et al. Comparative analysis of immunophenotypic abnormalities in cellular immunity of uremic patients undergoing either hemodialysis or continuous ambulatory peritoneal dialysis. Ren Fail. 2005;27:279–282. [PubMed] [Google Scholar]
- 23.Griveas I, Visvardis G, Papadopoulou D, Mitsopoulos E, Kyriklidou P, et al. Cellular immunity and levels of parathyroid hormone in uremic patients receiving hemodialysis. Ren Fail. 2005;27:275–278. [PubMed] [Google Scholar]
- 24.Hauser AB, Stinghen AE, Kato S, Bucharles S, Aita C, et al. Characteristics and causes of immune dysfunction related to uremia and dialysis. Perit Dial Int. 2008;28(Suppl 3):S183–187. [PubMed] [Google Scholar]
- 25.Kuroki Y, Tsuchida K, Go I, Aoyama M, Naganuma T, et al. A study of innate immunity in patients with end-stage renal disease: special reference to toll-like receptor-2 and -4 expression in peripheral blood monocytes of hemodialysis patients. Int J Mol Med. 2007;19:783–790. [PubMed] [Google Scholar]
- 26.Lim WH, Kireta S, Leedham E, Russ GR, Coates PT. Uremia impairs monocyte and monocyte-derived dendritic cell function in hemodialysis patients. Kidney Int. 2007;72:1138–1148. doi: 10.1038/sj.ki.5002425. [DOI] [PubMed] [Google Scholar]
- 27.Lonnemann G. Impaired NK cell function in ESRD patients. Blood Purif. 2008;26:315–316. doi: 10.1159/000130067. [DOI] [PubMed] [Google Scholar]
- 28.Vacher-Coponat H, Brunet C, Lyonnet L, Bonnet E, Loundou A, et al. Natural killer cell alterations correlate with loss of renal function and dialysis duration in uraemic patients. Nephrol Dial Transplant. 2008;23:1406–1414. doi: 10.1093/ndt/gfm596. [DOI] [PubMed] [Google Scholar]
- 29.Pahl MV, Gollapudi S, Sepassi L, Gollapudi P, Elahimehr R, et al. Effect of end-stage renal disease on B-lymphocyte subpopulations, IL-7, BAFF and BAFF receptor expression. Nephrol Dial Transplant. 2010;25:205–212. doi: 10.1093/ndt/gfp397. [DOI] [PMC free article] [PubMed] [Google Scholar]
- 30.Raska K, Jr, Raskova J, Shea SM, Frankel RM, Wood RH, et al. T cell subsets and cellular immunity in end-stage renal disease. Am J Med. 1983;75:734–740. doi: 10.1016/0002-9343(83)90401-1. [DOI] [PubMed] [Google Scholar]
- 31.Raskova J, Ghobrial I, Czerwinski DK, Shea SM, Eisinger RP, et al. B-cell activation and immunoregulation in end-stage renal disease patients receiving hemodialysis. Arch Intern Med. 1987;147:89–93. [PubMed] [Google Scholar]
- 32.Song JY, Cheong HJ, Ha SH, Kee SY, Jeong HW, et al. Active influenza immunization in hemodialysis patients: comparison between single-dose and booster vaccination. Am J Nephrol. 2006;26:206–211. doi: 10.1159/000093306. [DOI] [PubMed] [Google Scholar]
- 33.Wasse H, Huang R, Long Q, Singapuri S, Raggi P, et al. Efficacy and safety of a short course of very-high-dose cholecalciferol in hemodialysis. Am J Clin Nutr. 2012;95:522–528. doi: 10.3945/ajcn.111.025502. [DOI] [PMC free article] [PubMed] [Google Scholar]
- 34.Armas LA, Andukuri R, Barger-Lux J, Heaney RP, Lund R. 25-Hydroxyvitamin D response to cholecalciferol supplementation in hemodialysis. Clin J Am Soc Nephrol. 2012;7:1428–1434. doi: 10.2215/CJN.12761211. [DOI] [PMC free article] [PubMed] [Google Scholar]
Associated Data
This section collects any data citations, data availability statements, or supplementary materials included in this article.