Abstract
How do we quantify cellular alignment? Cellular alignment is an important technique used to study and promote tissue regeneration in vitro and in vivo. Indeed, regenerative outcomes are often strongly correlated with the efficacy of alignment, making quantitative, automated assessment an important goal for the field of tissue engineering. There currently exist various classes of algorithms, which effectively address the problem of quantifying individual cellular alignments using Fourier methods, kernel methods, and elliptical approximation; however, these algorithms often yield population distributions and are limited by their inability to yield a scalar metric quantifying the efficacy of alignment. The current work builds on these classes of algorithms by adapting the signal processing methods previously used by our group to study the alignment of cellular processes. We use an automated, ellipse-fitting algorithm to approximate cell body alignment with respect to a silk biomaterial scaffold, followed by the application of the normalized cumulative periodogram criterion to produce a scalar value quantifying alignment. The proposed work offers a generalized method for assessing cellular alignment in complex, two-dimensional environments. This method may also offer a novel alternative for assessing the alignment of cell types with polarity, such as fibroblasts, endothelial cells, and mesenchymal stem cells, as well as nuclei.
Keywords: cellular alignment, algorithm, NCP criterion, silk, PC-12 cells
Introduction
Numerous tissues have preferential, highly organized cellular alignment along two- or three-dimensional axes. This includes the collagen lamella of the annulus fibrosus within the vertebral column, stromal fibroblasts within the cornea, osteocytes of lamellar bone, cardiomyocytes of cardiac tissue, and neurons within the central and peripheral nervous system, among many others. To help in the injury repair process, tissue engineers have sought to mimic native tissue architectures with biomaterial solutions to encourage preferential cellular alignment. These techniques include chemical and electrical gradients and physical patterning.1–5 Scaffold anisotropy is a particularly popular technique in regenerative medicine to guide cell and tissue regrowth due to its simplicity and efficacy.
Different biomaterial processing techniques have yielded patterning ranging from the nano- to the micrometer scale in pattern widths. Recent research has focused principally on developing and assessing the efficacy of cellular alignment on these scaffolds,4,6–9 though some groups are beginning to investigate the effects of various substrate modifications on cell viability10 and differentiation.11 Silk is an FDA-approved biomaterial from the Bombyx mori silkworm, which was selected for patterning studies due to its biocompatibility, mechanical properties, favorable cellular interactions, simple patterning options, and the ability to be chemically modified with adhesive peptides such as RGD (arginine–glycine–aspartic acid).12–14 Additionally, silk has been proven effective in promoting the alignment of many different cell types, such as human corneal fibroblasts,15,16 chondrogenic-differentiated human mesenchymal stem cells,17 and human primary fibroblasts and chondrocytes.18 Thus, silk films are an excellent biomaterial platform for evaluating cellular alignment.
The quantification of cellular alignment is often performed manually using microscope images. Many approaches to quantifying cellular alignment within this realm have been successful, and powerful statistical techniques have been developed to analyze data generated from nerve alignment experiments.19 However, while this image processing technique is fairly accurate, it suffers from certain limitations: the current manual methods are susceptible to inter-operator angle measurement variability, it is time-consuming, and the method becomes highly inefficient when the data set ranges from hundreds to thousands of images.8 Therefore, an automated, objective, and repeatable image processing technique is needed to address these issues. There are many effective algorithms that accomplish this end, such as Fourier-based methods, kernel methods, least-squares methods, binarization-based extraction of alignment, and elliptical approximation of cellular and subcellular structures.
The two most recent advances in automated quantification of cellular alignment come from a binarization-based extraction of alignment score8 and elliptical approximation.20–22 The former technique is generalizable to most cell types and yields a cellular orientation distribution. Elliptical approximation is a particularly promising method for analyzing nuclear orientation and cells with polarity, given their ellipse-like structure. Previous groups have reported the successful use of ellipse-fitting algorithms to approximate nuclear and cellular alignment, as well as neurite outgrowth.20–22 Both of these algorithms are effective in monitoring cellular alignment, though the former is best suited for dense and complex cellular shapes, while the latter is optimized for elliptical structures.
The current work uses a simple image filtering process in tandem with an ellipse-fitting algorithm (for cellular alignment) and a scaffold orientation scheme. We used the differentiated PC-12 cell line as a model for a polar, pseudoelliptical cell type.23 We wanted to find the five parameters—the centroid (x and y coordinates), major and minor axis lengths, and major axis orientation (relative to the horizon)—of the ellipse that best fits a thresholded image of the differentiated PC-12 cells used in this study. Because this model results in a nonlinear least-squares problem, the Gauss–Newton algorithm was used to solve for these five parameters. For each fitted ellipse, the deviation of the major axis of orientation from the alignment of the patterned film was determined. Then it remained to quantitatively assess cellular alignment. To accomplish this end, we report the development of a scheme, which can successfully identify and assess the efficacy of the biomaterial scaffolds with respect to cellular orientation.
In previous work, our group has shown through the study of neurite (cellular process) outgrowth that cellular alignment can be quantified through studying the statistical distributions of populations of neurons.24 Thus, a goal of this system was being able to quantify generalized cellular alignment in terms of cell body orientation. To accomplish this end, we wanted to determine when a population of cells diverges from ‘aligned’ to ‘unaligned.’ This was determined to be the point at which population alignment diverged from the uniform random distribution. This property of cellular alignment distributions then allowed us to adapt the normalized cumulative periodogram (NCP) criterion, which quantifies when a signal diverges from uniformity.25 The output of this criterion is a scalar value, which allowed us to interpolate to the angle or point at which a population of cells can no longer be considered ‘aligned.’
Methods
Preparation of silk fibroin solution
Using a previously established protocol, an 8% (w/v) aqueous silk fibroin solution was prepared from the cocoons of the B. mori silkworm.26,27 Briefly, cocoons were boiled for 30 min before being extracted using a 0.02M Na2CO3 solution and washed in distilled water. A 9.3M LiBr solution was then used to dissolve the silk, which was then dialyzed against 1 L of Milli-Q water. The silk was then centrifuged at 8700 RPM for 20 min to eliminate impurities.
Preparation of porous silk films
Flat and micropatterned porous silk fibroin films were prepared according to our previously established protocol. 15,27 Briefly, 1% silk solutions with 0.035% (w/w) polyethylene oxide (PEO, MW = 90,000; Sigma-Aldrich, St. Louis, MO) were cast onto 25 mm square polydimethylsiloxane (PDMS) molds obtained from flat and diffraction gratings (500 nm depth, 300 grates/mm, 17° pitch; Edmund Optics, Barrington, NJ) and allowed to dry overnight. The dried films were then water annealed for 7 h to induce a transition from the amorphous aqueous phase to the anti-parallel β-sheet or crystalline structure for stability in cell culture,28 before being placed into a water bath for 3 days to extract the PEO. All films were then coupled with RGD following our previously established protocol for increased cellular adhesion.14 Prior to cell plating, the films were sterilized with alternating two 30-min ethanol and phosphate-buffered saline (PBS) washes, followed by 30 min of UV irradiation.
Cell culture
An adhesive variant of the rat pheochromocytoma PC-12 cell line was obtained (ATCC, Manassas, VA). The PC-12 cells were cultured in F-12K medium (ATCC), supplemented with 1% penicillin–streptomycin (Invitrogen, Carlsbad, CA), 2.5% fetal bovine serum (Invitrogen), and 15% horse serum (Invitrogen). Cells were cultured at 37°C and 5% CO2/95% air. Medium was replenished every 3 days, and cells were passaged at 70–80% confluence using trypsin (0.25% with ethylenediaminetetraacetic acid–EDTA 4Na; Invitrogen). To achieve polarized cellular morphologies, the PC-12 cells were differentiated in complete growth medium supplemented with 50 ng/mL nerve growth factor (NGF 2.5S; Invitrogen).23
Immunohistochemistry
Fluorescence and transmission images of the PC-12 cells and silk films, respectively, were obtained using confocal microscopy (DM IRE2, Leica Microsystems, Buffalo Grove, IL). Prior to imaging, the cells were fixed for 20 min in 10% formalin, followed by permeabilizing for 30 min at room temperature using a 0.5% Triton X-100 solution. The cells were stained for actin using Alexa Fluor 488 phalloidin (Invitrogen) and counterstained for the nucleus with Hoechst 33342 (Sigma-Aldrich), according to the manufacturers' protocols.
Image thresholding
A typical, maturing (plated for ≤8 days) differentiated PC-12 cell body resembles that of a narrow ellipse. Examples of typical cells on micropatterned silk films are shown in Figure 1(a). The images are close to being piecewise continuous: the pixel values inside the cells are close to a single constant value, while pixel values outside of the cells belong to the silk biomaterial scaffold, with a well-defined gap between the two average values. In order to find a best-fit ellipse to the cell body, each cell image was first converted into a piecewise constant image. A value of 1 was assigned to points estimated by the thresholding to be inside the cell, and a value of 0 was assigned to points outside of the cell [Fig. 1(b), left panels].
Figure 1.
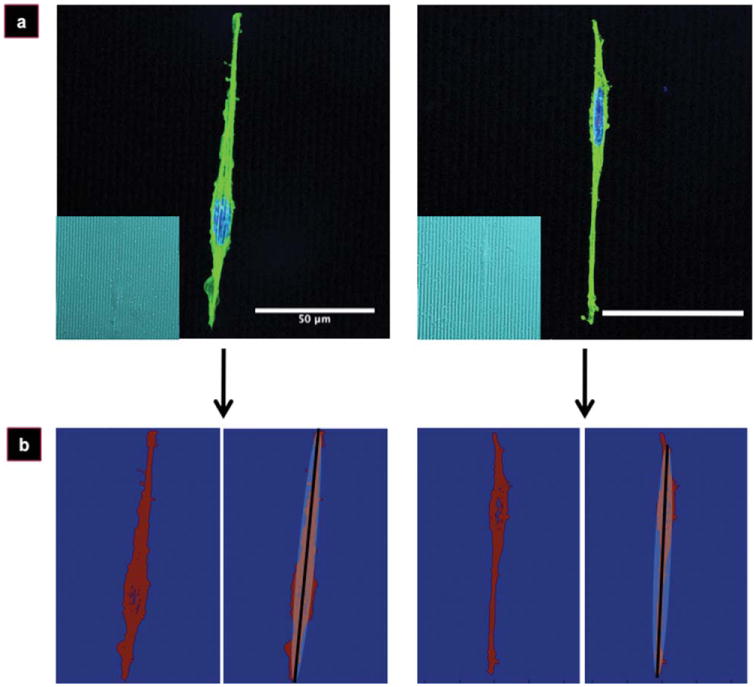
Imaging of PC-12 cells on silk films. Fluorescent micrographs of representative PC-12 cells (a) on micropatterned silk films (a, inset) used for cellular orientation analysis. Thresholded and discretized images (b, left panels), and the ellipse-fitting result after application of the Gauss–Newton algorithm (b, right panels). Cells stained for nucleus (blue) and actin (green). Scale bar, 50 μm.
Quantification of cellular alignment
Cellular orientation relative to the horizon was measured using the following algorithm: the n × n pixel space was mapped to [0,1] × [0,1] with spacing 1/(n − 1). The optimization problem to be solved is minp║h(p) − d║, where p = [σ1; σ2; xc; yc; θ], with σ1 being the length of major axis, σ2 the length of minor axis, xc the x-coordinate of the centroid, yc the y-coordinate of the centroid, and θ being the counterclockwise angle of the major axis relative to the x-axis. The vector d is the vector form of the piecewise constant image described above. Since the image is n × n, d is length n2. The functional notation h(p) is used to represent a piecewise constant output image of an ellipse that results from the parameter values given in p. The notation ║v║ means the Euclidean norm (length) of a vector v.
Since this is a nonlinear least-squares problem, we used the Gauss–Newton method to compute the solution to this optimization problem, which has been described in detail elsewhere.29 Briefly, let pk denote the value of the parameters at iteration k, and let rk = h(pk) − d. Then, iterate through the following steps:
Compute h(pk), rk, and Jk (the Jacobian at iteration k).
Solve (JkTJk)sk = −JkTrk for sk.
Set pk+1 = pk + sk, then
Stop if ║pk+1 − pk║/║pk║ < tol1, or ║h(pk+1) − d║ < tol2.
The Jacobian Jk is an n2 × 5 matrix of partial derivative estimates computed using first-order finite differences. Specifically, the (i,j)th entry of Jk is computed as (h(pk) − h(pk + ej))/(2 * δj), where δj is the spacing for the jth parameter, and ej is a vector of length 5 with all zeros except a δj in the jth position. Spacing parameters were chosen as δj, j = 1,…, 4 = 0.0001 and δ5 = π/16. The initial parameter vector was p0 = [0.5; 0.4; 0.5; 0.5; 0].
Quantification of scaffold alignment
Transmission images for each cell were used to determine the angle of the scaffold relative to the x-axis. Images were first passed through a six-class k-means algorithm.30 The pixels in the valleys were assigned to the class with the lowest pixel value. This class was then used to obtain a binary image revealing only the micropattern valleys (postclassification), which are a series of parallel lines (Fig. 2, step 1).
Figure 2.
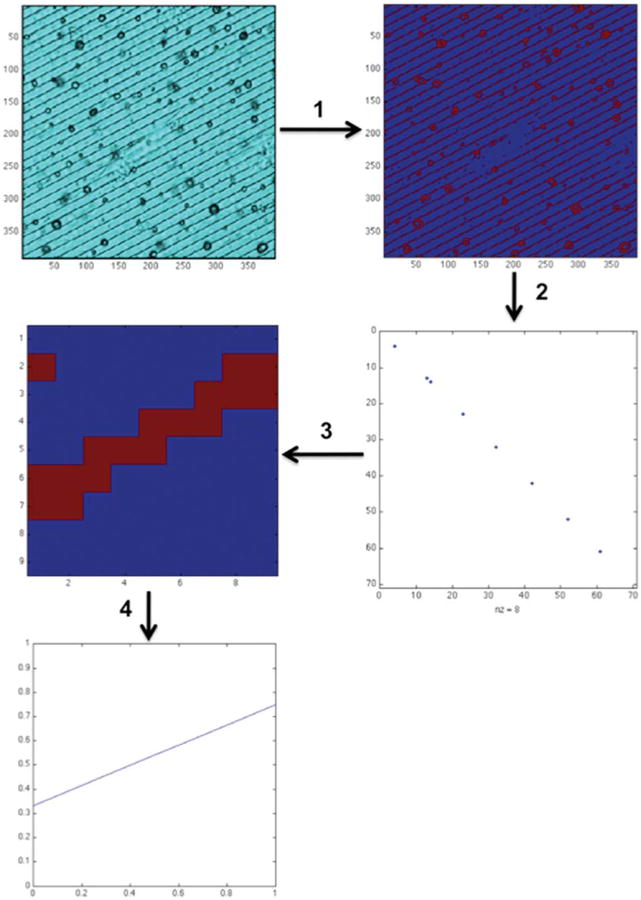
Automated scaffold image processing scheme. The original transmission image (top left) is converted into a binary, sorted image (1), analyzed for groove spacing (2), translated into a ∼1 pixel-wide line (3), and fit with a linear least-squares regression to yield an angle output relative to the x-axis (4).
The next goal was to then isolate one of these lines, so that its angle (with respect to the x-axis) could be computed. To accomplish this aim, the binary line image was overlaid onto the image form of the identity matrix—a single line running from the upper left to lower right corner of the image, and the pixel intersection between these two images was found (Fig. 2, step 2). The image of the pixel intersection(s) should consist of a roughly periodic, binary sequence running from the upper left to lower right of the image, as the binary line image approximates a series of parallel lines. The difference between the neighboring pixels on this line was computed, and a search was performed for the first pixel with sufficient spacing between itself and its next neighbors to yield a linear pixel set. This yielded a sub-image in which a single line could be isolated. This single line was then subjected to a least-squares best fit, yielding an angle between the best-fit line and the x-axis. This process was performed on a series of lines and averaged to increase algorithm robustness. To obtain cellular alignment, the difference between the angle obtained for cell body alignment and scaffold alignment was computed.
Heuristic alignment criterion
As previously described,24 the mean–median divergence allows for the heuristic identification of the ‘angle of alignment.’ Briefly, under the uniform distribution, the mean (m) and median (med) are equivalent (on the interval [a,b], m = med = (a + b)/2). Thus, when the mean and median are no longer equivalent, the distribution is no longer uniform. The mean is more sensitive to outliers; so once these outliers are introduced into the data set, the mean abruptly diverges from the median data set [Fig. 4(a)]. This divergence point is indicative of the angle beyond which the cells can no longer be considered uniform, and thus they are ‘unaligned.’
Figure 4.
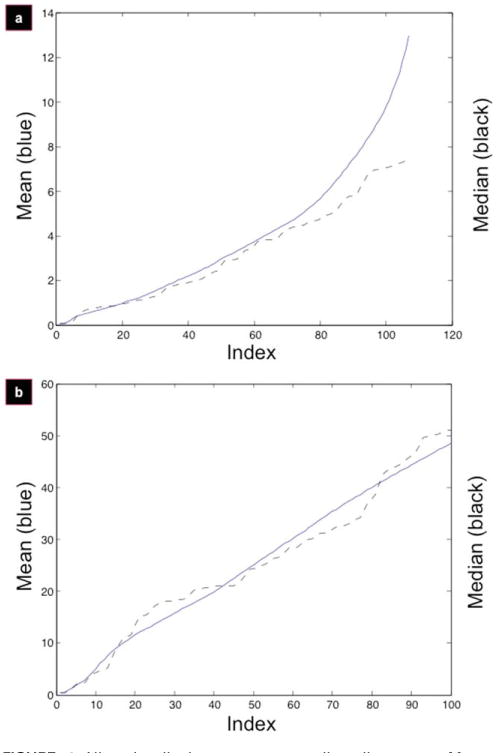
Aligned cells have a mean–median divergence. Mean–median divergence for micropatterned films (a) and control (b). Mean (solid blue line) and median (dashed black line) are calculated as a function of increasing index.
NCP criterion
The development of the NCP criterion25 and its application to cellular alignment distributions24 has been discussed in detail elsewhere. Briefly, cellular alignment data were obtained using the algorithm described in ‘Quantification of cellular alignment’ and ‘Quantification of scaffold alignment’ sections. This yielded an n-length vector containing the angles of cellular alignment [see Fig. 3(a,b), left panels for histograms], which were then sorted in increasing order [Fig. 3(a,b), right panels]. This new vector was then transformed into a local difference measure vector, referred to as Diff (short for difference). Diff(k) is the difference between the (k + 1)st angle and the kth angle in the angle vector. Thus, Diff is a vector of length n − 1. The NCP criterion was then applied to Diff every five cells, the output of which is a series of Boolean values, which determine when Diff strays from the uniform random distribution. This produced the cell index beyond which the population could no longer be considered aligned. This cell index was then interpolated to its angle of alignment, and that was considered to be the population's ‘angle of alignment.’
Figure 3.
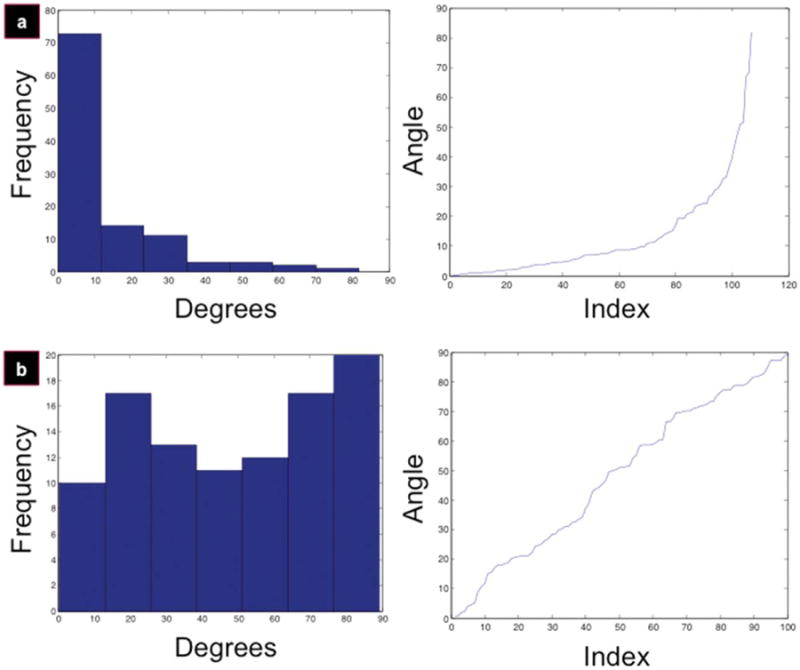
PC-12 cells align on micropatterned silk films. Cellular alignment results for micropatterned films (a) and control (b). Data are organized into seven-bin histograms (left panels) and sorted alignment indices (right panels).
Statistics and data analysis
Data are represented as mean ± standard deviation. The Kolmogorov–Smirnov test is used for the NCP criterion (p = 0.05) to determine the boundaries of divergence from the uniform random distribution. All computational and algorithm work was performed in MATLAB (Mathworks).
Results
Control studies with test data set
A test set of ellipses of various shapes and angle orientations were generated using a simple, randomizing algorithm to test the convergence properties of the Gauss–Newton algorithm. To assess the alignment algorithm accuracy, a string of 100 images was run through the scheme, and the resultant ellipse orientation data were compared to the actual image input. In this case, vmeasured is the vector of angle outputs from the algorithm, and vactual is the vector of angle inputs from the ellipse-generating algorithm. The algorithm error (|vmeasured − vactual|/n) was found to be 0.8973; thus, the algorithm is accurate to approximately ±1° for the test data set.
Algorithm accuracy and robustness
To assess the accuracy of the algorithm, a randomly selected subset of the original data set (n = 15 cells) was reassessed for alignment with a user-specific ellipse and compared to the original data. The individual alignments were compiled as vectors, vold and vnew. Variation in degree output was determined using the same measure as in the previous section but substituting vmeasured and vactual for vold and vnew, respectively. The algorithm, here, was found to be accurate within ±3.5°.
To assess algorithm robustness, a post hoc analysis was conducted on the experimental data set. Of the images obtained, 42% needed to be further processed to reduce the extracellular noise. A user-specific ellipse was defined by clicking on three coordinates to define an ellipse, and this ellipse was used to mask the noisy binary image; the algorithm was then applied to this masked image. Only 14% of images lacking noise benefited significantly from the selection of a user-specific ellipse.
Scaffold orientation scheme
The scaffold orientation algorithm was developed to recognize periodic patterns in the silk micropatterns. In 16% of scaffold images, noise from the pores in the silk scaffold made it not possible to run an accurate scheme. Thus, the code was run on 84% of the film images, of which 56% of measurements fell within 10° and 42% fell within 5° of the ‘true,’ user-defined axis. Measurements that fell within 5° were used for overall PC-12 alignment analysis. The incorporated algorithm measurements used were accurate to 1.70 ± 1.44°. The remaining scaffold images were analyzed in a semi-automated fashion, using a looped point-and-click method.
Quantification of PC-12 angle distribution on silk films
The PC-12 cells were analyzed for alignment after 7 days of growth on the films, using the algorithm described earlier. A seven-bin histogram displaying the absolute orientation of the PC-12 cells was created (n = 107 cells), with a binning width of ∼11.7° per bin [Fig. 3(a), left panel]. Bin width was justified based on the fact that the Gauss–Newton algorithm is accurate to ±3.5° and the scaffold orientation scheme is accurate to ±1.7°. Thus, this requires a bin width in the neighborhood of 10.4°. The center of the first bin was 5.88°, with 73 cells (∼68%) falling within this domain. The control data set histogram is displayed in Figure 3(b) (left panel).
Determination of cellular alignment threshold
From Figure 3 (right panels), it is clear that the micropatterned film is uniformly distributed up to a certain point [Fig. 3(a), right], whereas the control set is uniform throughout [there is no mean–median divergence, Fig. 3(b), right], as represented by a linear curve. These qualitative features become more apparent when we display the mean–median divergence for the micropatterned films [Fig. 4(a)] and the control set [Fig. 4(b)]. It is possible, at this point, to approximate the divergence from the uniform distribution in the micropatterned set (at approximately index 70); however, a quantitative measure is required to confirm this observation.
Transformation of the micropatterned and control data sets to the respective local difference measures, Diffmicro [Fig. 5(a)] and Diffcontrol [Fig. 5(b)], is more revealing. Signal instabilities around indices 65–80 in Diffmicro are more apparent, while Diffcontrol shows white noise throughout. When these measures were processed using the NCP criterion, the index of alignment for the micropatterned films [Fig. 6(a)] was found to be at index 70, while the control set [Fig. 6(b)] is uniform throughout (thus, no alignment was observed).
Figure 5.
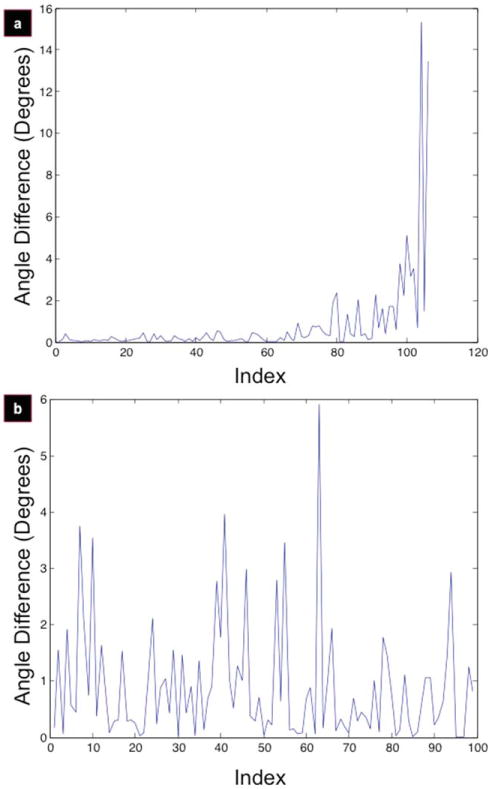
Local angle difference signal. Local angle differences converted from sorted alignment indices for micropatterned films (a) and control (b).
Figure 6.
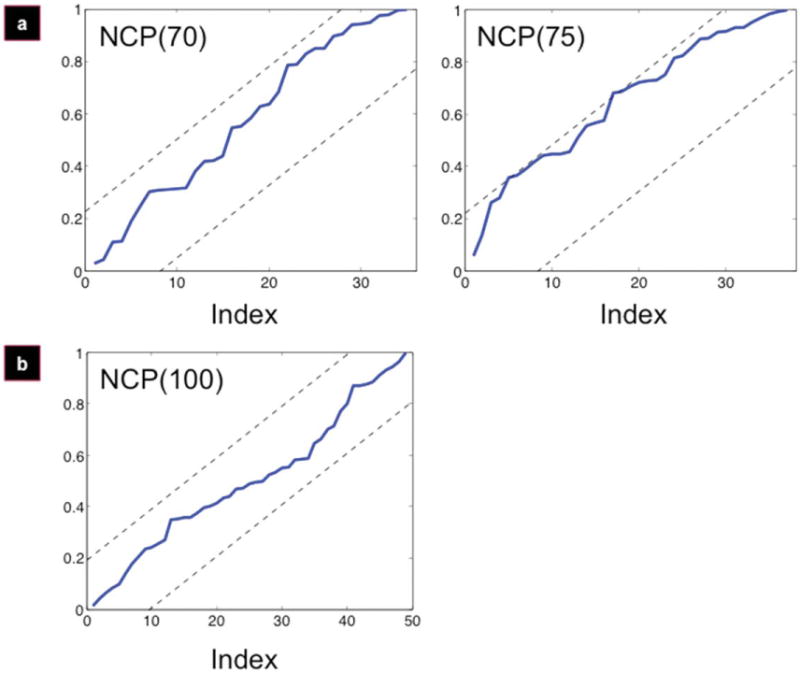
Alignment yields a divergence from the uniform random distribution. NCPs for micropatterned films (a) and control (b). Micropat-terned film alignment diverges at NCP(75) (a, right panel); control (b) is uniformly distributed throughout.
For the micropatterned film data set, angles are uniformly distributed (and therefore, aligned) up to a certain point, followed by a divergence pattern between the mean and the median, indicating that there is no longer uniformity. Interpolating from this divergence point to the y-axis (cell angle) in Figure 3(a) (right panel), it was possible to compute the cell at which the distribution diverged from uniformity. This corresponded to cell index 70, which has an angle of 10.8°. Thus, the angle of alignment is 10.8°. This means that all cells within 10.8° (70) are to be considered aligned, which corresponds to a population alignment of 65.4%.
Discussion
Optimizing cellular alignment remains an important goal in tissue engineering, as tissue form is intrinsically linked to its function. Native cellular alignment confers many benefits unto myriad tissues: for neurons it guarantees proper target innervation, for the cornea, transparency, and for lamellar bone, mechanical strength. Thus, cellular alignment contributes in essential ways to numerous tissues, with respect to their development, function, and regeneration. Recent advances in the field of regenerative medicine have allowed for the efficient alignment of various cell types. Our group has focused on development of silk biomaterials, which have been used by our group to achieve enhanced alignment cells from various tissues, such as neurons,24 corneal fibroblasts,31 and bone,32 among others. Work from many different tissue engineering groups has also allowed for preclinical and clinical advances in enhancing tissue regeneration. However, cellular alignment, with alignment requirements that vary by tissue, has not yet been completely optimized, and we are continuing to learn how different biomaterial platforms interact with cells to affect their function.10,11,33,34
One hurdle in optimizing cellular alignment is a lack of automated algorithms that can quantify and compare the efficacy of various biomaterial platforms simultaneously. Recent work on this subject has led to numerous advances in cellular identification, size, and orientation. Image processing techniques developed have included use of the fast Fourier transform,35 gradient methods,9 direct least-squares methods,21 and other signal processing methods.8 Thus, the application of scientific computing to the field tissue engineering has been very effective, leading to more accurate and efficient identification of cellular orientation and population distributions. These methods, however, are not without limitations. While such techniques are effective in generating population distributions to describe general cellular alignment, they are limited by their inability to clearly characterize and compare cellular alignment on various biomaterial platforms, relative to one another. Powerful statistical methods have been explored to combat this problem,19 though the lack of a quantitative, scalar metric to address the question of relative scaffold efficacy remains an issue.
In the current work, we studied interactions of differentiated PC-12 cells with silk biomaterials to further understand the cell body alignment of polarized, pseudo-elliptical cell types on anisotropic biomaterials. To characterize cellular and scaffold orientation relative to one another, we developed an ellipse-fitting algorithm and a scaffold pattern recognition algorithm and further adapted a previously established signal processing technique,24,25 the NCP criterion, which now enables us to apply a quantitative, scalar metric to compare various cell body alignments. The latter development arose from the initial empirical observation that, when plated on various anisotropic biomaterials, polarized cells and their processes tend to ‘align’ with the scaffold in a uniform distribution up to a certain point, beyond which the cells distribute themselves non-uniformly. This allowed for the adaptation of the NCP criterion, which was originally developed for identifying white noise in a signal, to the study of cellular alignment. Its scalar output now serves as the criterion we use to identify an ‘angle of alignment,’ and this can be confirmed heuristically by observing the sorted alignment indices, as well as the mean–median divergence of alignment distributions.
Our study demonstrates that it is now possible to quantitatively describe cell body alignment using a simple scalar metric, implicitly defined by the cell populations being studied. The current work offers a new dimension for the analysis of cellular alignment and is indeed generalizable: the NCP criterion could be used in tandem with other ellipse-fitting algorithm or any alignment distribution-generating algorithm. While this work presents a novel technique for evaluating cellular alignment in vitro, a more powerful implementation of this algorithm would be for the prediction of in vivo success of anisotropic biomaterials. Indeed, cellular alignment has been proven to be particularly effective in promoting tissue regeneration for peripheral nerve,36,37 cartilage,38 and cornea,31,39 among many others. Thus, if the degree of in vitro cellular alignment could be correlated with in vivo regeneration using the statistical tests currently applied, a model could be developed yielding predictions of regenerative success prior to biomaterial scaffold implantation. Additionally, because alignment of many cell types is intrinsically linked to their native tissue function, this class of methods may also be of help in characterizing developmental processes in tissues as diverse as nerve, bone, cornea, and cardiac muscle.
When preferentially aligned tissues are injured, regenerative outcomes are usually optimal when the tissue engineering solution can recapitulate native tissue architecture. Quantifying the alignment response of cells to various biomaterials, however, is not easy to accomplish. Understanding scaffold alignment efficacy will hopefully lead to optimized regenerative outcomes. The current work is important because it demonstrates the capability of a signal processing algorithm to quantify cellular alignment using a novel scalar metric to comparatively evaluate biomaterials. It is also of note that the NCP criterion is compatible with previously developed algorithms that sought to quantitatively assess cellular orientation and would hopefully serve as another layer upon which biomaterials are evaluated.
Acknowledgments
The authors would like to thank Biman Mandal and Eun Seok Gil for contributing the micropatterned silk films. We thank the Tissue Engineering Resource Center (TERC) through the NIH from the National Institute of Biomedical Imaging and Bioengineering, and the Armed Forces Institute of Regenerative Medicine (AFIRM) for support for this work.
Contract grant sponsor: NIH; contract grand number: P41EB002520
References
- 1.Adams DN, Kao EY, Hypolite CL, Distefano MD, Hu WS, Letourneau PC. Growth cones turn and migrate up an immobilized gradient of the laminin IKVAV peptide. J Neurobiol. 2005;62:134–147. doi: 10.1002/neu.20075. [DOI] [PubMed] [Google Scholar]
- 2.Cao X, Shoichet MS. Defining the concentration gradient of nerve growth factor for guided neurite outgrowth. Neuroscience. 2001;103:831–840. doi: 10.1016/s0306-4522(01)00029-x. [DOI] [PubMed] [Google Scholar]
- 3.Li GN, Liu J, Hoffman-Kim D. Multi-molecular gradients of permissive and inhibitory cues direct neurite outgrowth. Ann Biomed Eng. 2008;36:889–904. doi: 10.1007/s10439-008-9486-z. [DOI] [PubMed] [Google Scholar]
- 4.Mahoney MJ, Chen RR, Tan J, Saltzman WM. The influence of microchannels on neurite growth and architecture. Biomaterials. 2005;26:771–778. doi: 10.1016/j.biomaterials.2004.03.015. [DOI] [PubMed] [Google Scholar]
- 5.Song HK, Toste B, Ahmann K, Hoffman-Kim D, Palmore GT. Micropatterns of positive guidance cues anchored to polypyrrole doped with polyglutamic acid: A new platform for characterizing neurite extension in complex environments. Biomaterials. 2006;27:473–484. doi: 10.1016/j.biomaterials.2005.06.030. [DOI] [PubMed] [Google Scholar]
- 6.Cecchini M, Gumma G, Serresi M, Beltram F. PC12 differentiation on biopolymer nanostructures. Nanotechnology. 2007;18:1–7. [Google Scholar]
- 7.Chien HW, Chang TY, Tsai WB. Spatial control of cellular adhesion using photo-crosslinked micropatterned polyelectrolyte multilayer films. Biomaterials. 2009;30:2209–2218. doi: 10.1016/j.biomaterials.2008.12.060. [DOI] [PubMed] [Google Scholar]
- 8.Xu F, Beyazoglu T, Hefner E, Gurkan UA, Demirci U. Automated and adaptable quantification of cellular alignment from microscopic images for tissue engineering applications. Tissue Eng Part C: Methods. 2011;17:641–649. doi: 10.1089/ten.tec.2011.0038. [DOI] [PMC free article] [PubMed] [Google Scholar]
- 9.Karlon WJ, Hsu PP, Li S, Chien S, McCulloch AD, Omens JH. Measurement of orientation and distribution of cellular alignment and cytoskeletal organization. Ann Biomed Eng. 1999;27:712–720. doi: 10.1114/1.226. [DOI] [PubMed] [Google Scholar]
- 10.Brunetti V, Maiorano G, Rizzello L, Sorce B, Sabella S, Cingolani R, Pompa PP. Neurons sense nanoscale roughness with nanometer sensitivity. Proc Natl Acad Sci USA. 2010;107:6264–6269. doi: 10.1073/pnas.0914456107. [DOI] [PMC free article] [PubMed] [Google Scholar]
- 11.Engler AJ, Sen S, Sweeney HL, Discher DE. Matrix elasticity directs stem cell lineage specification. Cell. 2006;126:677–689. doi: 10.1016/j.cell.2006.06.044. [DOI] [PubMed] [Google Scholar]
- 12.Altman GH, Diaz F, Jakuba C, Calabro T, Horan RL, Chen J, Lu H, Richmond J, Kaplan DL. Silk-based biomaterials. Biomaterials. 2003;24:401–416. doi: 10.1016/s0142-9612(02)00353-8. [DOI] [PubMed] [Google Scholar]
- 13.Yang Y, Chen X, Ding F, Zhang P, Liu J, Gu X. Biocompatibility evaluation of silk fibroin with peripheral nerve tissues and cells in vitro. Biomaterials. 2007;28:1643–1652. doi: 10.1016/j.biomaterials.2006.12.004. [DOI] [PubMed] [Google Scholar]
- 14.Sofia S, McCarthy MB, Gronowicz G, Kaplan DL. Functionalized silk-based biomaterials for bone formation. J Biomed Mater Res. 2001;54:138–148. doi: 10.1002/1097-4636(200101)54:1<139::aid-jbm17>3.0.co;2-7. [DOI] [PubMed] [Google Scholar]
- 15.Gil ES, Mandal BB, Park SH, Marchant JK, Omenetto FG, Kaplan DL. Helicoidal multi-lamellar features of RGD-functionalized silk biomaterials for tissue engineering. Biomaterials. 2010;31:8953–8963. doi: 10.1016/j.biomaterials.2010.08.017. [DOI] [PMC free article] [PubMed] [Google Scholar]
- 16.Gil ES, Park SH, Marchant J, Omenetto F, Kaplan DL. Response of human corneal fibroblasts on silk film surface patterns. Macromol Biosci. 2010;10:664–673. doi: 10.1002/mabi.200900452. [DOI] [PMC free article] [PubMed] [Google Scholar]
- 17.Mandal BB, Park SH, Gil ES, Kaplan DL. Stem cell-based meniscus tissue engineering. Tissue Eng Part A. 2011;17:2749–2761. doi: 10.1089/ten.tea.2011.0031. [DOI] [PMC free article] [PubMed] [Google Scholar]
- 18.Mandal BB, Park SH, Gil ES, Kaplan DL. Multilayered silk scaffolds for meniscus tissue engineering. Biomaterials. 2011;32:639–651. doi: 10.1016/j.biomaterials.2010.08.115. [DOI] [PMC free article] [PubMed] [Google Scholar]
- 19.Li GN, Hoffman-Kim D. Evaluation of neurite outgrowth anisotropy using a novel application of circular analysis. J Neurosci Methods. 2008;174:202–214. doi: 10.1016/j.jneumeth.2008.07.001. [DOI] [PMC free article] [PubMed] [Google Scholar]
- 20.Bray MA, Adams WJ, Geisse NA, Feinberg AW, Sheehy SP, Parker KK. Nuclear morphology and deformation in engineered cardiac myocytes and tissues. Biomaterials. 2010;31:5143–5150. doi: 10.1016/j.biomaterials.2010.03.028. [DOI] [PMC free article] [PubMed] [Google Scholar]
- 21.Fitzgibbon A, Pilu M, Fisher RB. Direct least square fitting of ellipses. IEEE Trans Pattern Anal Mach Intell. 1999;21:476–480. [Google Scholar]
- 22.Haines C, Goodhill GJ. Analyzing neurite outgrowth from explants by fitting ellipses. J Neurosci Methods. 2010;187:52–58. doi: 10.1016/j.jneumeth.2009.12.010. [DOI] [PubMed] [Google Scholar]
- 23.Greene LA, Tischler AS. Establishment of a noradrenergic clonal line of rat adrenal pheochromocytoma cells which respond to nerve growth factor. Proc Natl Acad Sci USA. 1976;73:2424–2428. doi: 10.1073/pnas.73.7.2424. [DOI] [PMC free article] [PubMed] [Google Scholar]
- 24.Nectow AR, Gil ES, Kaplan DL, Kilmer ME. A statistical algorithm for assessing cellular alignment. J Biomed Mater Res Part A. 2013;101A:884–891. doi: 10.1002/jbm.a.34385. [DOI] [PMC free article] [PubMed] [Google Scholar]
- 25.Hansen PC, Kilmer ME, Kjeldsen RH. Exploiting residual information in the parameter choice for discrete ill-posed problems. BIT Numer Math. 2006;46:41–59. [Google Scholar]
- 26.Li C, Vepari C, Jin HJ, Kim HJ, Kaplan DL. Electrospun silk-BMP-2 scaffolds for bone tissue engineering. Biomaterials. 2006;27:3115–3124. doi: 10.1016/j.biomaterials.2006.01.022. [DOI] [PubMed] [Google Scholar]
- 27.Lawrence BD, Cronin-Golomb M, Georgakoudi I, Kaplan DL, Omenetto FG. Bioactive silk protein biomaterial systems for optical devices. Biomacromolecules. 2008;9:1214–1220. doi: 10.1021/bm701235f. [DOI] [PubMed] [Google Scholar]
- 28.Jin HJ, Kaplan DL. Mechanism of silk processing in insects and spiders. Nature. 2003;424:1057–1061. doi: 10.1038/nature01809. [DOI] [PubMed] [Google Scholar]
- 29.Heath MT. Scientific Computing: An Introductory Survey. 2nd. New York: McGraw-Hill; 2002. [Google Scholar]
- 30.Manjon-Herrera JV. kmeans Image Segmentation, Version 2005. Natick, MA: Mathworks MATLAB Central; 2005. [Google Scholar]
- 31.Lawrence BD, Pan Z, Liu A, Kaplan DL, Rosenblatt MI. Human corneal limbal epithelial cell response to varying silk film geometric topography in vitro. Acta Biomater. 2012;8:3732–3743. doi: 10.1016/j.actbio.2012.06.009. [DOI] [PMC free article] [PubMed] [Google Scholar]
- 32.Oliveira AL, Sun L, Kim HJ, Hu X, Rice W, Kluge J, Reis RL, Kaplan DL. Aligned silk-based 3-D architectures for contact guidance in tissue engineering. Acta Biomater. 2012;8:1530–1542. doi: 10.1016/j.actbio.2011.12.015. [DOI] [PMC free article] [PubMed] [Google Scholar]
- 33.Discher DE, Janmey P, Wang YL. Tissue cells feel and respond to the stiffness of their substrate. Science. 2005;310:1139–1143. doi: 10.1126/science.1116995. [DOI] [PubMed] [Google Scholar]
- 34.Nectow AR, Marra KG, Kaplan DL. Biomaterials for the development of peripheral nerve guidance conduits. Tissue Eng Part B. 2012;18:40–50. doi: 10.1089/ten.teb.2011.0240. [DOI] [PMC free article] [PubMed] [Google Scholar]
- 35.Ng CP, Hinz B, Swartz MA. Interstitial fluid flow induces myofibroblast differentiation and collagen alignment in vitro. J Cell Sci. 2005;118:4731–4739. doi: 10.1242/jcs.02605. [DOI] [PubMed] [Google Scholar]
- 36.Kim YT, Haftel VK, Kumar S, Bellamkonda RV. The role of aligned polymer fiber-based constructs in the bridging of large peripheral nerve gaps. Biomaterials. 2008;29:3117–3127. doi: 10.1016/j.biomaterials.2008.03.042. [DOI] [PMC free article] [PubMed] [Google Scholar]
- 37.Clements IP, Kim YT, English AW, Lu X, Chung A, Bellamkonda RV. Thin-film enhanced nerve guidance channels for peripheral nerve repair. Biomaterials. 2009;30:3834–3846. doi: 10.1016/j.biomaterials.2009.04.022. [DOI] [PMC free article] [PubMed] [Google Scholar]
- 38.Zhang Y, Yang F, Liu K, Shen H, Zhu Y, Zhang W, Liu W, Wang S, Cao Y, Zhou G. The impact of PLGA scaffold orientation on in vitro cartilage regeneration. Biomaterials. 2012;10:2926–2935. doi: 10.1016/j.biomaterials.2012.01.006. [DOI] [PubMed] [Google Scholar]
- 39.Phu D, Wray LS, Warren RV, Haskell RC, Orwin EJ. Effect of substrate composition and alignment on corneal cell phenotype. Tissue Eng Part A. 2011;17:799–807. doi: 10.1089/ten.tea.2009.0724. [DOI] [PMC free article] [PubMed] [Google Scholar]


